1) G. Osann, Poggendorfs Ann. 67, 372 [1845].
2) C. F. Schdnbein, J. prakt. Chem. (1) 53, 69 [1851].
3
) see H. Stetter: Enzymatische Analyse. Verlag Chemie, Weinheim/Bergstr. 1951.
4
) O. Warburg: WasserstofTiibertragende Fermente. Verlag Dr. W. Saenger, Berlin 1948.
5) N. O. Kaplan, S. P. Colowick and C. C. Barnes, J. biol. Chemistry 191, 461 [1951].
6) O. H. Lowry, N. R. Roberts, J. L. Kapplahn and C. Lewis, Feder. Proc. 15, 304 [1956].
Principles of Enzymatic Analysis
Hans-Ulrich Bergmeyer
1. Determination of concentration a) Methods measuring total changes
a) Direct measurements
p) Measurements with the aid o f coupled reactions
b) Determination of concentration by measuring the kinetics of the reaction a) Substrates
P) Activators and inhibitors 2. Assay of enzyme activity
a) General information o n kinetics b) Simple reactions
c) Coupled reactions
The use of enzymes for analysis is not new. As early as 1845 OsannV detected hydrogen peroxide with peroxidase; C. F. Schdnbein
2
> gave the concentration which could be detected as 1 in 2000000. In the eighties of last century enzyme preparations were used extensively for the determination of carbohydrate in foodstuffs
3
*. About 25 years ago Otto Warburg**
evolved the method of enzymatic analysis based on measurement of the light absorption of the reduced coenzymes, diphospho- and triphosphopyridine nucleotide. The latest advance in this field is the measurement of the fluorescence of these coenzymes
5 - 6
\ with the result that the sensitivity of the determinations has been increased by two or three orders of magnitude.
Today the term "enzymatic analysis" is generally understood to mean analysis with the aid of enzymes. Although in fact all metabolic reactions of living cells are catalysed by enzymes, the determination of a compound by living cells (e.g. micro-organisms) is not part of the field of enzymatic analysis; these are microbiological assays. Recently it has become common to also include in the term "enzymatic analysis" the assay of enzyme activity in organs and biological fluids. This has been the usual practice in food chemistry for several decades.
The particular value of enzymes in analysis lies in their ability to react specifically with individual components of a mixture. This avoids lengthy separations of the components and therefore the time taken for the analysis is less. Owing to the mild conditions employed, enzymes often allow the detection and determination of labile substances, which can only be estimated very inaccurately by other methods.
4 Section A: General
Basically, enzymes can be used for the determination of metabolic products, inorganic ions essential for metabolism and pharmacological agents which influence metabolic reactions.
1. Determination of Concentration
The concentration of a substance which takes part in an enzymatic reaction can be determined in two ways.
a) By physical, chemical or enzymatic analysis of the product or unreacted starting material after completion of the reaction catalysed by the enzyme.
b) From the rate of the enzyme reaction, which depends on the concentration of the substrate, cofactor, activator or inhibitor. The two methods are basically different. In the first case ("measurement of total change method"), the reaction should be completed as rapidly as possible. Relatively large amounts of enzyme and relatively small amounts of substrate are used. The measured values should be easily readable, not too small and not too large. In the second case ("kinetic method"), the substrate and enzyme concentrations are so arranged that the rate of the reaction, i. e. the amount of substrate reacting per unit time, is not too fast and so can be measured accurately.
a) M e t h o d s m e a s u r i n g total c h a n g e s
Enzyme reactions are equilibrium reactions. If the substrate is virtually completely consumed, then the enzymatic analysis is simple; the result is easily calculated by means of a known constant of the substance (e.g. by means of the extinction coefficient of light absorbing sub
stances). If the substrate is not all consumed because of the unfavourable position of the equilibrium it is often possible to obtain quantitative utilization of the substrate by trapping the products (carbonyl compounds with semicarbazide, hydrazine, etc.; if a proton is formed in the reaction, then the reaction medium should be made as alkaline as possible), or by increasing the concentration of the other reactants. It is not always possible to displace the equilibrium sufficiently in favour of the product and therefore a standard curve must be pre
pared under defined conditions.
a) Direct measurements
The substance A is to be determined. It is completely converted to B in the enzymatic reaction A -> B. B can be distinguished chemically and physically from A.
If A, in contrast to B, has a characteristic absorption spectrum, then A can be determined directly in the presence of other absorbing substances by means of the enzyme reaction which occurs in the spectrophotometer cuvette. The absorption decreases by an amount corres
ponding to the amount of A.Example: Determination of uric acid (e29o my. —12 x
10 6
cm.
2 /mole) with uricase (see p. 500). Or if B absorbs and A does not. Example: Determination of diphos
phopyridine nucleotide (DPN): alcohol dehydrogenase reduces DPN to DPNH ( £3 40 m [L •=
6.22 x 10 6
cm.
2
/mole) in the presence of ethanol.
Another typical case is if B is an acid. It can then be titrated or measured manometrieally by the production of CO2 from a bicarbonate buffer. Example: The older method for the determination of glucose with glucose oxidase (Keilin and Hartree
1
^); the reaction product is gluconic acid.
7) D. Keilin and E. F. Hartree, Biochem. J. 42, 230 [1948].
More rare is the chemical determination of the reaction product. Example: The determination of L-arabinose by conversion to L-ribulose with L-arabinose isomerase and measurement of the ketopentose by means of the cysteine carbazole reaction (see p. 178).
The enzymes most widely used for enzymatic analysis are the DPN *) and TPN-dependent dehydrogenases.
General equation: A + c o e n z y m e
+
> B + coenzyme-H + H
+
Example: Ethanol + D P N + > acetaldehyde + D P N H + H+
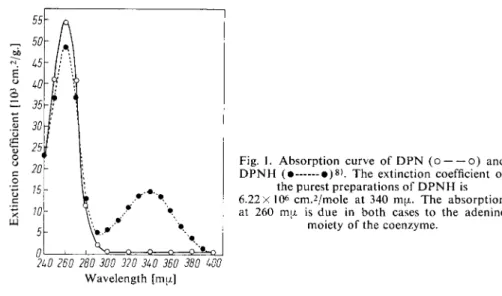
The transfer of the hydrogen of the substrate to the pyridine ring of DPN or TPN leads to the formation of a peak in the absorption curve at 340 ma (Fig. 1).
Fig. 1. Absorption curve of D P N (o o) and D P N H ( • • ) » ) . The extinction coefficient of
the purest preparations of D P N H is 6.22X 10
6
c m .
2
/ m o l e at 340 ma. The absorption at 260 ma is due in both cases to the adenine
moiety of the coenzyme.
2U0 260 280 300 320 3U0 360 380 WO Wavelength [m(j.]
Consequently, the enzymatic conversion of substrate A can be followed directly in the spectro
photometer cuvette by the changes in the optical density at 340 ma (or an adjacent wave
length). According to the Lambert-Beer law, with a light path of d = 1 cm.,
log I0/ I - s X c X d * * )
the conversion of 1 [xmole substrate/ml. is indicated by an optical density change
A E - log IQ/AI = 6.22 X 10<*x 10-6x 1 = 6.22.
*) Abbreviations:
D P N = diphosphopyridine nucleotide A D P = adenosine diphosphate D P N H = reduced diphosphopyridine nucleotide A T P = adenosine triphosphate T P N = triphosphopyridine nucleotide PEP = phosphoenolpyruvate T P N H = reduced triphosphopyridine nucleotide PK = pyruvic kinase A M P = adenosine monophosphate L D H = lactic dehydrogenase
** Ho = intensity of the incident light
I = intensity of the emergent light (from the cuvette) z = extinction coefficient [cm.
2
/mole]
c = concentration of the light absorbing substance [moles/ml.]
d = light path of the cuvette [cm.]
8) O, Warburg and W. Christian, Biochem. Z. 287, 291 [1936],
Section A : General
It is the same if DPN accepts the substrate hydrogen, as in the example of the oxidation of ethanol given above, or if DPNH donates hydrogen, as in the reduction of pyruvate to lactate (see p. 253, for the reaction curve see Fig. 2 on p. 9).
(3) Measurements with the aid of coupled reactions
The use of DPN and TPN-dependent dehydrogenases is not limited to the estimation of their substrates. In many cases an enzymatic reaction can be taken further with a dehydro
genase: The substance to be determined, A, is converted to product B with an "auxiliary enzyme" ("auxiliary reaction"). B is the substrate for a DPN-linked dehydrogenase and can be determined as usual. The dehydrogenase reaction which has been coupled with the enzymatic conversion A -> B is termed an "indicator reaction". It indicates how much A is converted to B and, if the auxiliary reaction is quantitative, the original amount of A.
An example is the determination of phosphoenolpyruvate (PEP). PEP is converted to pyru
vate by adenosine diphosphate (ADP) in the auxiliary reaction; DPNH is oxidized in the indicator reaction and the pyruvate is determined by the corresponding decrease in optical density.
Auxiliary reaction Indicator reaction
General equation:
auxiliary enzyme indicator enzyme
A > B B + D P N H + H+ > C + D P N + Example:
PK L D H PEP + A D P > A T P + pyruvate Pyruvate + D P N H + H+ > lactate + D P N
ADP can be determined in the same way; it is converted in the auxiliary reaction to ATP by PEP and the pyruvate formed is reduced with DPNH.
Dyes can also serve as indicators in coupled reactions by reacting, enzymatically or non- enzymatically, with a product of the auxiliary reaction.
An example is the determination of glucose with glucose oxidase and peroxidase, using odianisidine as the indicator (see p. 23).
Auxiliary reaction:
glucose oxidase
Glucose + H20 + 02 gluconic acid -f H 2 O 2 Indicator reaction:
peroxidase
H202 + leuco-dye > H20 + dye
The intensity of the dye is a measure of the reaction. Other examples can be found in the section on "Assay of Enzyme Activity".
b) D e t e r m i n a t i o n of concentration by m e a s u r i n g the kinetics of the reaction a) Substrates
The rate of an enzyme reaction depends, within certain limits, on the substrate concentration.
Common to all the (sometimes complicated) mathematical formulation of enzyme reaction rates is a term showing that the initial rate is proportional to the substrate concentration,
providing that this is low. Generally, in comparison to the corresponding Michaelis constant the substrate concentration must be ignored, [S]o <CKM (refer to
9
>).
In the determination of substrates by measurement of the rate of enzyme reactions the ex
perimental conditions must be strictly adhered to. In general, standard curves for defined conditions of temperature, buffer and pH must be used. Since the experimental result usually changes in direct proportion to the enzyme activity, a new standard curve should be prepared for each series of measurements, in which the substrate concentration is similar to the expected value for the unknown sample. The simple form of "kinetic" determination of substrate, such as the determination of alcohol by means of the rate of the alcohol dehydro
genase reaction (Theorell and Bonnichsen
10
>) is used much less. These methods have gener
ally been superseded by methods measuring the total change.
In contrast "catalytic assays" have become established where no quantitative method is possible. By this method is understood the determination of a compound which in the first reaction is consumed and in the second is regenerated. The amount of substance which can be determined is small. Example: The determination of coenzyme A with a-oxoglutaric oxidase and deacylase (v. Korff
n
*)\
oxidase
(1) a-Oxoglutarate + C o A + D P N + > succinyl-CoA + D P N H + C 02 + H+
deacylase
(2) Succinyl-CoA -—vr~^r~^ succinate + C o A
The coenzyme A to be determined is required for the oxidative decarboxylation of a-oxo- glutarate by the oxidase. The rate of reaction (1) therefore depends on the concentration of CoA. This remains constant because the CoA is regenerated in reaction (2). The rate of reaction (1), which is measured by the increase in the optical density at 340 ma with time due to the formation of DPNH, is a measure of the amount of CoA present.
p) Activators and inhibitors
The rates of enzyme reactions in the living cell are controlled by different regulators. In prin
ciple, it should be possible to determine inorganic ions, SH compounds, etc. by their acti
vation of certain enzymes. However, different activators may affect the same enzyme in the same way, so that the specificity of such analyses is often low. An example of such a method is the determination of magnesium by the activation of isocitric dehydrogenase
1 2)
(see p. 640).
Inhibitors can be determined in a similar way. A compound usually inhibits a whole group of enzymes, but this lack of specificity is unimportant. More important is the fact that the same enzyme may be inhibited by several compounds. In this case the determination is only valid if the sample does not contain several inhibitors whose action is similar. It is usually possible to find an enzyme which is fairly specific for the inhibitor present in the sample.
Example: The inhibition of carbonic anhydrase by DDT; determination of DDT according
to Keller 13) (see p. 626).
9
> E. A. Moelwyn-Hughes in F. F. Nord and F. Weidenhagen: Handbuch der Enzymologie. Akade- mische Verlagsgesellschaft, Berlin 1940, Vol. I, p. 259.
10) H. Theorell and R. K. Bonnichsen, Scand. J. clin. Lab. Invest. 3, 58 [1951].
n) R. W. v. Korff, J. biol. Chemistry 200, 401 [1953].
12) p. Baum and R. Czok, Biochem. Z. 332, 121 [1959].
i3> H. Keller, Naturwissenschaften 39, 109 [1952].
8 Section A : General
2. Assay of Enzyme Activity
a) General information o n kinetics
The activity of an enzyme is defined by the rate of the reaction catalysed by the enzyme.
The concept of the chemical reaction rate, v = ±dc/dt, is especially well illustrated on the direct reading photometer. The rate at which the photometer needle moves over the scale indicates the speed of the chemical reaction, i.e. the decrease of the reacting compound with time or the increase of the reaction product.
Substrate transformations involving light absorbing reactants (e.g. DPN and TPN-linked dehydrogenase reactions occurring in the cuvette, see p. 5) are measured in this way.
Automatic recording or plotting the time against the optical density gives information on the course of the reaction. The reaction curve is not always linear.
Allocation of enzyme reactions to one of the classical orders of uncatalysed reactions (first or second order) is usually not possible. Therefore by the rate of an enzyme reaction is always understood the initial rate vo*K This rate is obtained from the slope of the tangent to the reaction curve at zero time. It is possible to obtain this value exactly with non-linear curves by use of a mirror ruler
1 4 )
. An approximate value, which is usually sufficient for routine work, can be obtained by plotting several measurements made just after the start of the re
action and then extrapolating to t = 0 as illustrated in Fig. 10, p. 35.
With non-linear reaction curves the intervals at which measurements are made should be small. It is incorrect to take only a few measurements after a relatively long incubation time.
Unfortunately, the course of the reaction cannot always be followed continuously, as is possible with the changes in light absorption brought about by dehydrogenase reactions occurring in the spectrophotometer cuvette. For example, in the determination of trypsin activity according to Anson
1
^ the measurement of the product formed at a certain time requires that the enzyme reaction be stopped before starting the measurement. Only by the continuous removal and analysis of samples, involving a great expenditure in time and effort, is it possible to obtain reaction curves by such methods. The simple method of determining the amount of substrate converted after a fixed time must lead to erroneous results (see
1 5 a ) ), because the shape of the reaction curve depends on several factors including the substrate concentration. Some of the older methods, such as the previously mentioned assay of trypsin activity, have been improved
1 6 ).
*) Each simple enzyme reaction is a combination of two separate steps, namely the formation of the enzyme-substrate complex ES from the enzyme E and the substrate S and its decomposition to yield the reaction product P and regeneration of the unchanged enzyme:
E + S ES > E + P
The "initial rate" as indicated by normal techniques of measurement is only obtained when ES is formed and its concentration is stationary. The stage of the formation of ES can only be mea
sured in very slow reactions and with highly sensitive instruments
1 3 3
). Only when the optimal concentration of ES has been reached is the rate of the step ES ^ E -f P, i.e. the formation of P, maximal; it corresponds to the decrease in S with time, since the concentration of S in the first reaction stage E + S ^ ES falls off rapidly.
i3a) B. Chance, J. biol. Chemistry 235, 2440 [I960].
14) see also e.g. H.-U. Bergmeyer, Biochem. Z. 323, 163 [1952].
15) M. L. Anson, J. gen. Physiol. 22, 79 [1938].
isa) H.-U. Bergmeyer, Biochem. Z. 323, 163 [1952].
16) G. W. Schwert and Y. Takenata, Biochim. biophysica Acta 16, 570 [1955].
Like all chemical transformations reactions catalysed by enzymes are sensitive to changes in temperature. The temperature coefficient of the reaction rate is 10% per degree
1 7
) or more.
In other words, a 10° C rise in temperature causes a 100% increase in the reaction rate.
Constant temperature is essential in the assay of enzyme activity.
All enzymes have an optimum pH range for their activity and often this optimum is very narrow. With increasing concentration of substrate the rate of enzyme catalysed reactions finally reaches a maximum value. According to the equation of Michaelis and Menten
1
®
further increase in concentration should no longer change the rate. However, many enzymes are inhibited by a large excess of substrate. The optimum substrate concentration also depends on the pH and temperature (e.g. lactic dehydrogenase, p. 737, see also
1 9
*).
If all the precautions taken with normal laboratory equipment are adhered to in the measure
ment of enzyme activity, then the error is usually less than ± 5 %. Greater accuracy requires a disproportionate expenditure on apparatus.
b) Simple reactions
In contrast to substrate determinations the measurement of enzyme activity is always carried out with the optimum substrate concentration and if necessary the enzyme sample is diluted.
The reaction should proceed so slowly (with a few exceptions) that at the end of the mea
surements only a small part of the substrate has been converted. The substrate must be pure since contamination with substrates of other enzymes leads to errors. For example, the oxaloacetate used for the measurement of malic dehydrogenase activity in serum must be free from its decarboxylation product pyruvate. Otherwise measurement of the decrease in the optical density of DPNH would include that due to the activity of the lactic dehydro
genase also contained in the serum (see p. 757).
Generally the reaction is started by addition of the substrate. Since the sample cannot be deproteinized all the enzymes contained in it are active and can react with their substrates if these are present in the sample. This can cause considerable interference with the mea
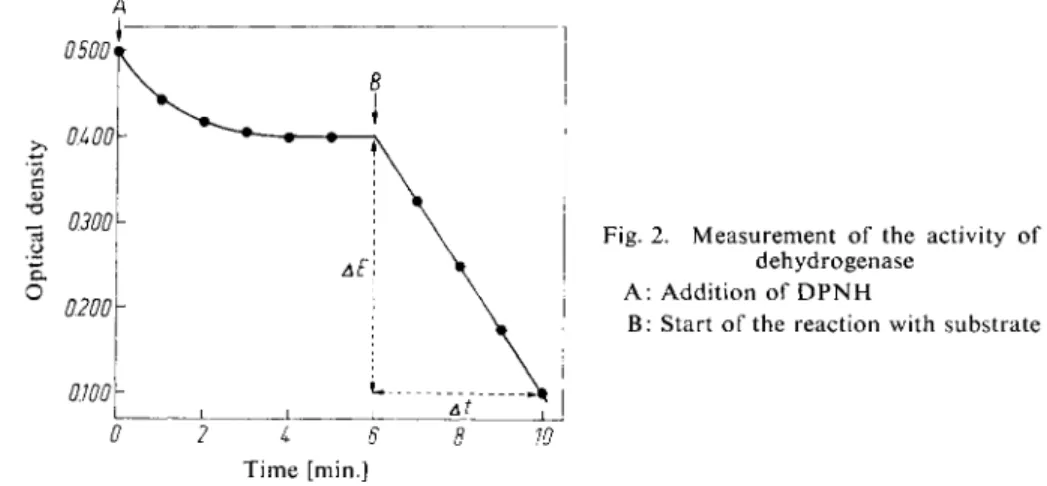
surements. For example, in the spectrophotometric assay of dehydrogenases in serum a signi- A
Fig. 2. Measurement of the activity of a dehydrogenase
A : Addition of D P N H
B: Start of the reaction with substrate
0 2 i 6 8 Time [min.]
] 7
> see e.g. H. Netter: Theoretische Biochemie. Springer-Verlag, Berlin-Gottingen-Heidelberg 1959, p. 554 et seq.
*8) L. Michaelis and M. L. Menten, Biochem. Z. 49, 333 [1913].
19) A. D. Winer and G. W. Schwert, J. biol. Chemistry 231, 1065 [1958].
10 Section A : General
flcant decrease in optical density is observed after the addition of DPNH. This is due to the reduction of pyruvate contained in the serum by serum lactic dehydrogenase. The real measurements are only started when the initial reaction has stopped (Fig. 2).
The ideal situation in which the reaction can be followed directly by means of the light ab
sorption should only be abandoned if a linear conversion of substrate with time is guaranteed.
Such as is the case, for example, with glutamate-oxaloacetate and glutamate-pyruvate trans
aminase, where the reaction products can be determined chemically after a long incubation time. The estimation of the oxaloacetate or pyruvate formed as the dinitrophenylhydrazones requires very careful consideration of additional sources of error. Any carbonyl compounds present in the sample must be allowed for by a blank determination. It is also necessary to distinguish between the hydrazones of the reaction products and the hydrazone of the substrate a-oxoglutarate; therefore it is not always possible to use optimum substrate con
centrations with this method (for further details, see pp. 842 and 851).
c) C o u p l e d reactions
Just as coupled reactions can be used for the determination of substrates so they can be used for the measurement of reaction rates. The indicator enzyme is usually a DPN or TPN-linked dehydrogenase. For example, the activity of glutamate-pyruvate transaminase (GPT) can be determined with lactic dehydrogenase (LDH) as indicator enzyme. (For a three compo
nent assay with an auxiliary enzyme as intermediary, see p. 12).
Indicator reaction General equation :
enzyme of
unknown indicator enzyme A B B + D P N H + H
+
> C + D P N + activity
Example:
GPT L D H Alanine + a-oxoglutarate > Pyruvate + D P N H + H+ > lactate + D P N +
glutamate + pyruvate
The role of the indicator reaction in determinations of enzyme activity is to indicate the amount of reaction product, in this case pyruvate, formed with time. This is only possible if the pyruvate is reduced extremely rapidly by the DPNH. Then the rate of the trans
amination can be followed by means of the decrease in optical density due to the oxidation of the DPNH.
For the practical execution of this type of assay it is of interest to know how much more rapid the indicator reaction must be than the reaction to be measured. To calculate this ratio the mathematical formulation of the two individual steps must be known, which at present only occurs with very few reactions. However, by means of a sequence of two un- catalysed first order reactions it is possible to estimate approximately how large the error of measurement will be with an insufficient excess of the indicator enzyme.
With comparable rates for the individual steps the time course for the formation of the reaction product C in the sequence
ki „ k2
A > B > C
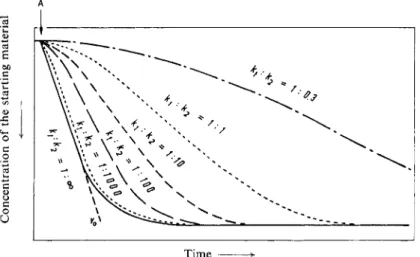
shows the typical S-shape characteristic of all sequence (or consecutive) reactions (Fig. 3).
The slopes of the inflection tangents to these curves give the maximum rates, but these slopes are always less than the slope of the tangent at zero time with a more rapid indicator reaction.
o c U
Time
Fig. 3. Course of consecutive reactions with different ratios of the two individual rates ki : k(diagrammatic). A : Start of the reaction 2
Only the tangent to the curve k i : k2 = 1:1000 comes near to the ideal case of curve k i : k2 = 1: °°, whose tangent through the origin has the slope vn. With the former curve the "induction period" of the reaction is practically zero and the S-shape of the curve has virtually disappeared.
The calculations are as follows: For the step A -> B the initial rate is
(1) v0 = aki (for t = 0)
For the coupled reaction A -> B -> C the rate (see 2 0 )
) at any time is
1'
(2) aki e + •
k2 ( k i e -
k2e - k
2 t ) i ;
a is the substrate concentration at time t.
To obtain vinf., i.e. the rate at the inflection point of the curve of the coupled reaction, it is necessary to substitute
In (ki/ka) W . = — ;—•
ki - k2 for t in equation (2)
Let k i : k2 = 1:10. Even with this relatively low gradient in the reaction rates the expression in the round brackets in equation (2) can be neglected. Therefore
ln(k,/k2)
Vinf.
Vinf. '
~ - k i x aki X e
_ k l t
i n f . ^ aki X e~ ~* - kl _ kz
ak! X e - ° -
2 56
^ 0.774 aki ^ 0.774 v0
Under the conditions k2 = 10 ki the slope of the tangent at the inflection point represents approximately a 23 % lower rate than the reaction step A -> B at t = 0 actually has.
20) H.-U. Bergmeyer, Biochem. Z. 324, 408 [1953].
12 Section A : General
In the same way when k2 = 100 ki the error is only 4 %. When k2 = 1000 ki then vi nf & 0.993 and therefore vi nf ^ aki ^ vn (error is 0.7%).
This estimation shows that more than a 100-fold excess of indicator enzyme is required.
By excess is understood not the amount of enzyme, but rather the product of the amount and the specific activity or turnover number of the enzyme. With an unfavourable ratio for the turnover numbers (specific activities) the amount of indicator enzyme which is required may be very large.
Three component assays are rare, because it is difficult to obtain a sufficiently rapid rate for the auxiliary reaction in comparison to the primary reaction and for the indicator reaction in comparison to the auxiliary reaction. Only if the ratios of the specific activities of the participating enzymes are favourable can this type of assay be carried out. The following example illustrates this:
The activity of myokinase (MK) was measured in a three component assay 2 1 )
. The auxiliary enzyme was pyruvic kinase (PK) and the indicator enzyme lactic dehydrogenase (LDH):
A M P + A T P Auxiliary reaction: A D P + PEP Indicator reaction: Pyruvate - f D P N H + H
+
(abbreviations, see p. 5).
The MK preparation had a specific activity of 169 units/mg. (according to Racker et al.
22)
)
and therefore consumed 169 ^moles AMP per minute (in the calculations it is necessary to allow for the fact that for each mole of AMP 2 moles of lactate are formed, i.e. 2 moles of DPNH are oxidized). The specific activity of PK and LDH was 156 and 455 units/mg.
respectively.
Amounts of enzyme were taken with the following activities:
M K : 1.18X 1 0- 4 m g . ; 1.18X 10-4x 169 = 1.99X 10~2 jimoles/min.
P K : 2 x l 0~ 2 m g . ; 2 x l 0 ~ 2 x l 5 6 = 3.12 [xmoles/min.
The ratio of the rates is about 1:170, therefore according to what has been said above the auxiliary reaction is rapid. The amount of LDH was varied.
L D H a) 2 x 10⁻³ mg.; 2 X 10-3x455 = 0.9 (xmoles/min.
b) 2 X l O -
2
mg.; 2 x 1 0 - 2 x 4 5 5 = 9 [xmoles/min.
c) 2 x 10-i mg.; 2 x 1 0
- 1
X 4 5 5 = 90 [jimoles/min.
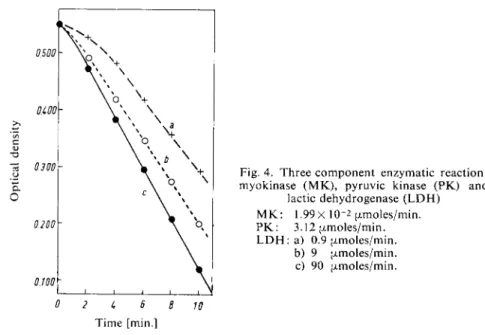
With these amounts of LDH the values for the ratio of the rate of the auxiliary reaction to the indicator reaction are 1 : 0.3, 1 : 3 and 1 : 30. Accordingly the reaction curves in Fig. 4 have induction periods of different length and the rates (AE/min.) increase from 0.030 (a), 0.036 (b) to 0.044 (c). Depending on the required accuracy, a 30-fold excess of activity of the indicator enzyme over the auxiliary enzyme may be satisfactory or the amount of LDH must be in
creased three or four-fold.
2D H. Mollering, unpublished.
22) j . Cooper, P. A. Srere, M. Tabachnick and E. Racker, Arch. Biochem. Biophysics 74, 306 [1958].
M K
> 2 A D P PK
A T P + pyruvate LDH
> lactate + D P N +
Although the 3 :1 ratio for the specific activity of lactic dehydrogenase and pyruvic kinase is favourable it is necessary to add about 1 mg. (!) LDH per assay in order to measure the activity of 1.18 x 10~
4
mg. MK exactly.
0.500 h
OiOO
13 OdOOY O o.
0.200
0.100
Fig. 4. Three component enzymatic reaction:
myokinase ( M K ) , pyruvic kinase (PK) and lactic dehydrogenase ( L D H )
M K : 1.99 X 1 0 - 2 ^moles/min.
P K : 3.12 [xmoles/min.
L D H : a) 0.9 (i.moles/min.
b) 9 (jimoles/min.
c) 90 (jLmoles/min.
0 2 1, 6 8 10 Time [min.]
The example shows that three component reactions for the measurement of enzyme activity should be avoided if possible. Whether, as is the case for the measurement of MK activity, other methods
2 3)
are more reliable, or whether the advantages outweigh the disadvantages indicated above, must be decided separately for each system.
23) see L. Noda and A. Kuby, J. biol. Chemistry 226, 541 [1957].