NATURAL RESOURCE ECONOMICS
Sponsored by a Grant TÁMOP-4.1.2-08/2/A/KMR-2009-0041 Course Material Developed by Department of Economics,
Faculty of Social Sciences, Eötvös Loránd University Budapest (ELTE) Department of Economics, Eötvös Loránd University Budapest
Institute of Economics, Hungarian Academy of Sciences Balassi Kiadó, Budapest
2
NATURAL RESOURCE ECONOMICS
Week 5
Landscape effects of changes in the water cycle
Bodrogköz
Gábor Ungvári
I. táblázat. Területhasználat a 12 településen
Típus Terület
nagysága (ha)
Rész- arány
Belterület 736 3%
Nagytáblás szántóföld 15.049 57%
Kistáblás szántóföldek 3.708 14%
Intenzív legelők és erősen degradált gyepek bokrok és fák nélkül 1.254 5%
Vegyes mezőgazdaság területek, komplex művelési szerkezet, épületek nélkül 545 2%
Zárt lombkoronájú természetes lombhullató erdők nem vizenyős területen 409 2%
Nyílt lombkoronájú természetes lombhullató erdők, vizenyős területen 382 1%
Lombos erdő ültetvények 1.091 4%
Természetes gyep fák és cserjék nélkül 2.236 9%
Láp, mocsár 845 3%
Összes terület 26.254
3 A népesség alakulása
0 200 400 600 800 1000 1200 1400 1600 1800 2000 2200 2400 2600 2800 3000 3200 3400 3600 3800 4000
1784 1830
1869 1900
1910 1920
1930 1936
1938 1941
1949 1960
1970 1980
1990 Évek
Lakosság száma (fő)
F.Berecki A.Berecki Karos Karcsa Pácin K.rozvágy Semjén T.karád T.csermely B.halom Vajdácska
Population Changes
A népesség alakulása
0 200 400 600 800 1000 1200 1400 1600 1800 2000 2200 2400 2600 2800 3000 3200 3400 3600 3800 4000
1784 1830
1869 1900
1910 1920
1930 1936
1938 1941
1949 1960
1970 1980
1990 Évek
Lakosság száma (fő)
F.Berecki A.Berecki Karos Karcsa Pácin K.rozvágy Semjén T.karád T.csermely B.halom Vajdácska
Population Changes
4 Grading of floodplain regions according to biological activity rate
Grading of floodplain regions according to biological activity rate
5
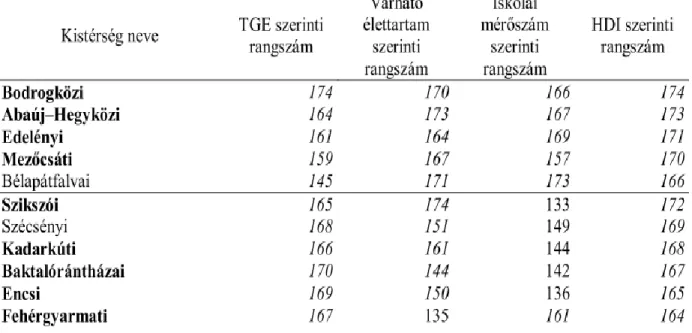
Table I. Least developed regions (HDI), sorted by components Table I. Least developed regions (HDI), sorted by components
Potential vegetation Potential vegetation
6
• Sinking – Sedimentary deposition, interchanging periods of sedimentation and soil formation
• Medium growing area attributes (high acidity, low-grade mechanical composition, risk of inland inundation), medium soil-degradation
• Low water permeability (clay soil grade)
The condition of the environment
The condition of the environment
7
• Considerable landscape transformation, growing incomes, but no nationwide improvement
I. táblázat. A művelési ágak aránya községenként (1855-1913) Név év Termőterület Beltelek tó- ér-
folyó Terméketlen terület
Alsóberecki 1855 75,2 0 0 24,8
Alsóberecki 1913 88,0 0 0 12,0
Felsőberecki 1855 84,1 0 0 15,9
Felsőberecki 1913 86,8 0 0 13,2
Karcsa 1855 36,1 0 0 63,9
Karcsa 1913 94,7 0 0 5,3
Karos 1855 44,3 0 0 55,7
Karos 1913 95,0 0 0 5,0
Bodroghalom (Luka) 1855 49,7 0 0 50,3
Bodroghalom (Luka) 1913 97,5 0 0 2,5
Pácin 1855 89,6 1,6 8 0,8
Pácin 1913 95,4 0 0 4,6
Kisrozvágy 1855 56,8 0 0 43,2
Kisrozvágy 1913 96,2 0 0 3,8
Nagyrozvágy 1855 50,1 0 0 49,9
Nagyrozvágy 1913 96,4 0 0 3,6
Semjén 1855 51,6 0 0 48,4
Semjén 1913 95,8 0 0 4,2
Karád 1885 23,9 0 0 76,1
Karád 1863 90,7 0,7 7,6 1,0
Vajdácska 1855 52,8 0 0 47,2
Vajdácska 1913 95,8 0 0 4,2
Bodrogközi járás 1855 67,2 0 0 32,8
Bodrogközi járás 1897 91,6 0 0 8,4
Királyhelmeci becslőjárás
I.osztálya 1913 92,8 0 0 7,2
Magyarország 1855 92,9 0 0 7,1
Magyarország+Erdély 1913 94,9 0 0 5,1
Forrás: Borsos 2000
I. táblázat. Jövedelmek kataszteri holdra vetítve
Név Év Szántó Rét Legelő Kert Szőlő Erdő Nádas Teljes
határ Növekedés / Előző
Bodrogközi járás 1855 153
Királyhelmeci becslő
járás 1883 268 200 107 590 577 115 370 218 1,42
Királyhelmec b.j. 1.
Osztálya 1913 844 457 306 1065 1138 195 740 683 3,13
Szabolcs vármegye 1855 160
Szabolcs vármegye 1883 320 194 106 679 423 151 176 276 1,73
Szabolcs vármegye 1913 702 460 268 1350 1076 264 413 643 2,33
Zemplén vármegye 1855 148
Zemplén vármegye 1883 319 252 78 488 908 24 290 198 1,34
Zemplén vármegye 1913 719 537 171 965 1916 46 521 442 2,23
Magyarország 1855 277
Magyarország 1883 533 366 134 793 1055 86 416 351 1,27
Magyarország, Erdély Horvátország
1883 462 359 123 778 982 77 345 302
Magyarország, Erdély Horvátország
1913 823 692 226 1517 1870 175 724 623 2,06
Borsos (2000) 15. Táblázata alapján, a jövedelem mértékegysége feltehetőleg – konkrét utalás hiányában – korona. 1913-ra Magyarországra vonatkozó adatokat a szerző nem közöl, az 1883. évi adatok alapján feltételezhető, hogy az értékek magasabbak mint, a teljes vizsgálatba vont területekre.
8
Drivers of landscape transformation
• The evolution of intensive landscape usage was controlled by technology expanding arability (water drainage) and the estate-structure controlled.
• The evolution of large estates – estate-concentration surpassing the national average 1895 57%, employing 60% of the population
• With the landscape-transformation process, infrastructure serving drainage became the foundation of agricultural production. Increasing the efficacy of the system was expected to improve the conditions constraining agricultural efficiency.
• Implementing the damming in Tiszalök affected the region through the increase in the low water level of the Tisza, which changed the average level of groundwater and erased the option gravitational draining of surface waters.
• The size of the plots in large estate cultivation increased (expectations of efficiency and economies of scale) However, the side effects worsened the area’s condition of water management, thus the conditions of cultivation on the plow-land needed to be developed worsened too.
• These interventions resulted in decreasing water drainage efficiency, and the density of the water blocking layers of the soil increased. The water unable to drain concentrated in larger amounts on certain areas, which complicated the
homogenised industrialized cultivation that was the basis of the efficacy of ridge and furrow cultivation.
9
Regional development
•
Melioration as part of the VI. and VII. 5-year plan from 1977, but the national strategy progressed until 19942.1. táblázat A meliorációs beruházások hatása a termelési költségekre és a hozamokra és a jövedelmezőségre Ft, 1988
Termelési költség Termelési érték Tiszta jövedelem Országosan
Melioráció előtt (millió Ft/ha) 11,11 13,79 2,68
Melioráció után (millió Ft/ha) 15,23 19,07 3,84
Melioráció utáni % 137 138 143
Bodrogközben
Melioráció előtt (millió Ft/ha) 9,23 8,8 -0,43
Melioráció után (millió Ft/ha) 15,47 13,33 -2,14
Melioráció utáni % 168 151 498
Bodrogközi eredmények az országos átlag %-ában
Melioráció előtt 83,1 63,8
Melioráció után 101,6 69,9
(Forrás: Fehér, 1988)
I. táblázat. A főbb növények költségei az országos termelőszövetkezeti átlaghoz viszonyítva
%-os értékben (1984)
Búza Kukorica Napraforgó Lucerna
Költségek
Sárosp. Cigánd Sárosp. Cigánd Sárosp. Cigánd Sárosp. Cigánd Anyagköltség 91,6 70,4 26,4 42,1 75,7 39,4 197,9 96,7
- Műtrágya 67,3 56,4 18,4 1,8 16,1 229,1 211,1
Munkabér 79,8 57,1 49,1 47,4 44,1 41,4 63,7 404,7
Segédüzemi költség 121,9 86,4 137,2 119,7 147,3 107,5 165,5 101,4 - Traktor 120,2 96,7 177,3 94,5 153,1 139,9 170,7 158,1 Egyéb költség 102,4 78,4 230,7 48,4 73,9 96,8 25,1 163,6 Közvetlen költség 119,7 79,6 110,8 78,6 115,9 80,4 163,8 133,4 Főágazati általános
költség
163,1 36,6 130,8 202,1 164,1 187,7 226,3 263,9 Főtermék szűk. 120,4 84,6 112,5 87,1 119,6 88,2 169,9 145,4 Gazdasági általános
költség
77,4 97,8 54,6 127,3 79,4 123,5 100,9 177,6 Termelési költség 110,6 84,2 101,9 90 111,9 91,1 152,2 145,5 Termésátlag 72,3 61,2 38,1 77,7 46,2 38,3 125 102 Főtermék szűkített
önköltség
167,8 136,9 290,3 112,1 258,7 229,6 135,8 141,3 Főtermék teljes
önköltség
154,1 136,4 262,9 116,9 241,9 237,1 121,6 141,6 Főtermék
jövedelme
75,2 10,1 -40,4 -413,2 -491,7 -188,9
10
Consequences of landscape transformation
• The changes in (agricultural) economics practices were simultaneously conditioned by ecological and societal constraints. Due to the interventions aimed at changing environmental factors, the set of natural resources used by the local population was reduced and transformed. Production has became one-dimensional, a generally less complex utilization of the natural resources has started, while the usage intensity of the resources that serve as the foundation of production has increased.
• • With the transformation of resources, the proprietary components of the resources in the new economy have changed as well. The local population was marginalized as users of regional resources due to the evolving system of large estates. The earlier, communal use or opportunity of individual use of communal resources gradually disappeared. Resources that no longer served cultivation (ecological systemic services) were devalued, then became victims of new methods of land use (with their complimentary eeccoo--ssyysstteemmss))..
Outcomes
• Constant underdevelopment and migration due to the production generating deficit or comparatively less income
• Large-scale production reduced the labour demand of agriculture - industrialization
• Growing demand for specialized knowledge – divergence from local labour supply – simultaneous rise of the lack of specialized knowledge and unemployment
• Investments not to develop the production structure and improve the welfare infrastructure, but to maintain the production structure + the industrial innovation due to the public exclusory effect of compulsory local co-financing (siphoning of incomes)
• A growing population that is centralized and thus excluded from the landscape – causing damage for the individual and the community, degradation processes – alcoholism, migration
11
Opportunities
• Ecological and societal resources, reserves – (re)generation of capital
• Ecological: water-detention – closing of small water cycles, increasing its volume, its range
• Societal: strengthening internal regional connections, complexity – protecting current level of incomes – increasing its multiplying effect and its capacity of income-generation
• Building on existing opportunities, fostering demand that absorbs residential labour supply
• Reinterpreting the role of agricultural economics – Agenda 2000 – Pillars of KAP I.
and II, NAKP, ÚMVP
• The eco-social services – developing institutional frameworks / markets to fulfil the communal demand for ecological services
The location of the surveyed area
The location of the surveyed area
12
13
Actual landscape usage Actual landscape usage
Suggested landscape usage prior to terrain survey
Suggested landscape usage prior to terrain survey
14
3.4. táblázat : Az NVT ártéri tájgazdálkodás számára fontos intézkedéseinek összefoglalása
Emberi beavatkozás jellege Igénybe vehető programcsomag a Nemzeti Vidékfejlesztési Tervben 2004-ben gazdálkodás Alapcsomag* Kiegészítő csomag* Kiegészítő
csomag*
Egyéb kiegészítő
csomag*
Ártéri szint
Élőhely
tájrehabilitáció
Haszonállat Hasznosítás
Hínárnövényzet Hal
halászat, biomassza energetikai célú felhasználása
Állandó extenzív halastó: E.1.; vagy a más vizes élőhely- csomagok, ld. alább
N), O), P)
Nádasok Bivaly
legeltetés, nád és gyékény feldolgozás, biomassza energetikai célú felhasználása
E.4. M), N), O), P)
Mélyártér
Vízparti-mocsári növényzet
Könnyen regenerálódó területek, különös kezelést nem igényelnek, célszerű a biomassza rendszeres kitermelése,
bivaly, mangalica, szürkemarha
legeltetés, biomassza energetikai célú felhasználása
Kialakítás: E.2.1; E.2.2.
Fenntartás: E.3.
D.3.1.; D.3.2.; D.2.1;
D.2.2.
M), N), O), P)
Magassásosok bivaly,
mangalica, szürkemarha
legeltetés, biomassza energetikai célú felhasználása
Kialakítás: E.2.1; E.2.2.
Fenntartás: E.3.
Ld. fent M), N), O), P)
Mocsárrétek
Könnyen regenerálódó területek, rendszeres
kaszálást igényelnek szürkemarha, magyar tarka, húsmarha
legeltetés, kaszálás, biomassza energetikai célú felhasználása
E.3.; A.9.11., B.3.12.;
B.1 (gyep fenntartása), (gyepesítés); B.2.
Csak ökológiai gazdálkodásnál (B.2.): D.3.1.; D.3.2.
M), N), O), P)
Nedves cserjések Tájidegen fajok kezelése Attól függ, hogy minek a
szegélye D.2.
Alacsonyártér
Fás növényzet, ligeterdők Ligeterdők kialakítása komoly és hosszú távú emberi tevékenységet igényel
fa felhasználás, fűzvessző feldolgozás
Erdőtelepítési támogatás puhafás erdőre**
Erdőfenntartási támogatás puhafás erdőre***
Jövedelemkiesés
pótlása**** A), B), C), D), E), F), G), H), I), J), K), L), M), N), O), P)
15 Landscape management in the Bodrogköz floodplains
Cigánd emergency reservoir and the connecting Tiszakarád landscape management model area during low water
Landscape management in the Bodrogköz floodplains
Cigánd emergency reservoir and the connecting Tiszakarád landscape management model area during low water
Landscape management in the Bodrogköz floodplains
Cigánd emergency reservoir and the connecting Tiszakarád landscape management model area during high water
Landscape management in the Bodrogköz floodplains
Cigánd emergency reservoir and the connecting Tiszakarád landscape management model area during high water
16
Potential agrarian scenarios of landscape use
• Version "0" – The comparison is based on version zero, the case, when no shift is facilitated in landscape usage. In this case, the change in management conditions – in comparison to the raw data – means the introduction of the pillar subsidization of KAP I. This zero version can be followed within the frameworks of ”dry”
reservoir-utilization.
• Landscape use shift 1. - which does not take into account,that the water would cover large areas, but just as presently, during the dominantly plow-land cultivation those options are utilized that, with minimal alteration, allow the farmer to
participate in the AVOP programmes. In this version the nature of land use does not change (e.g. the plow-land remains as it is, but as part of the II. pillar
management package)
• Landscape use shift 2. – This scenario introduces the financial effects of adapting cultivation methods that establish conditions for optimal landscape use by
accommodating the annually appearing temporary water coverage. The individual terrain positions ensure possibility of farming based on the earlier specified, most optimal organic association, according to the management systems laid down in the NVT (at the same time qualifying for those payments).
17
Farmers
• Surveyed farm-types – Region of Észak-Alföld
• Joint farming establishments – medium-sized
• Individual farms with better than average efficiency
• Individual farms with worse than average efficiency
Észak Alföld
Tásas gazdálkodó szervezet országos
átlag 2. negyed 4. negyed
Országos egyéni
gazdálkodói átlag 20-80 mFt
Mezőgazdasági terület hektár 16,68 76,29 22,2 523,9
Szántó hektár 15,13 68,84 18,54 483,9
Gyep hektár 0,96 6,3 2,76 31,96
Gyümölcsös hektár 0,58 1,15 0,89 8,37
Parlag a szántóból hektár 2,31 1,89 1,25 3,64
Állatállomány / 100 ha MT 23,4 19,8 28,3 24,0
Állatállomány 3,9 15,1 6,3 125,9
Bruttó mezőgazdasági termelési
érték 1000 Ft/ha MT 185 269 273 375
Adózás előtti eredmény 1000
Ft/ha MT -1,17 68,11 22,8 5,73
Munka fajlagos
jövedelmezősége 1000 Ft/ÉME 289 3497 943 1149
Munkavégzők létszáma / 100 ha
MT 3,65 2,29 4,46 3,59
Forrás Keszthelyi, Kovács (2003)
18
• Interest differentiated
according to size, efficiency
• The feedback of costs from landscape maintenance is missing! This would influence the outcome – VKI
• Individual labour is decisive in terms of factual profitability.
• The original condition is the situation as subsidized prior to the EU accession.
• The management packages financed the costs of transfer, including a comprehensive incentivizing feature.
• Do not reflect the actual rate of indirect ecological benefits – areas are present individually, not as part of a landscape usage system.
The effects of financing on individual regions
• The amount of communal resources do not corresponde to the benefits of the
3.5 Tánlázat : Az átlag társas gazdálkodószervezet pénzügyi mutatóinak változása (ezer Ft ) Gazdasági szervezetek Eredeti állapot 0. verzió 1. verzió 2. verzió Bruttó mezőgazdasági termelési
érték 196310 208856 205463 191231
Adózás előtti eredmény 3001 19696 3897 4626
Munka fajlagos jövedelmezősége 41 73 43 44
Munkavégzők össz jövedelmezősége 21616 38310 22511 23240
Kifizetés aránya / brut.mezg.term.
érték 0,02 0,09 0,08 0,16
3.6 Táblázat: Az átlag jó eredményességű egyéni gazdálkodó pénzügyi mutatóinak változása (ezer Ft)
Észak Alföld 4. Negyed Eredeti állapot 0. verzió 1. verzió 2. verzió
Bruttó mezőgazdasági termelési érték 20512 22291 23445 19231
Adózás előtti eredmény 5196 7553 8233 6871
Munka fajlagos jövedelmezősége 80 110 129 117
Munkavégzők össz jövedelmezősége 6110 8467 9894 8979
Kifizetés aránya / brut.mezg.term. érték 0,04 0,13 0,23 0,22
3.7. Táblázat A rosszabb gazdálkodási helyzetben lévő átlag gazdaság pénzügyi mutatóinak változása ( ezer Ft)
Észak Alföld 2. negyed Eredeti állapot 0. verzió 1. verzió 2. verzió 2. becsült verzió
Bruttó mezőgazdasági termelési érték 3093 3459 3756 2738 2949
Adózás előtti eredmény -19 457 560 454 534
Munka fajlagos jövedelmezősége 10 39 54 55 60
Munkavégzők össz jövedelmezősége 175 652 911 921 1001
Kifizetés aránya / brut.mezg.term. érték 0,06 0,16 0,31 0,33 0,33
The fluctuation of cost-yield calculated for the entire reservoir area and bay (Thousand HUF)
The fluctuation of cost-yield calculated for the entire reservoir area and bay (Thousand HUF)
19 ecological services of subsidized activities.
• The transfers between the defrayers and beneficiaries are inadequate both within the region, and between the region and the government.
• Outcome: The allocation of land usage is inefficient and resultant of the subsidiary system do not point to the direction of optimal development.