OIL DEPLETION AND QUALITY OF DEMOCRACY IN SELECTED MIDDLE-EAST COUNTRIES*
Lotfali AGHELI
(Received: 7 August 2016; revision received 8 October 2016;
accepted: 17 October 2016)
Oil-abundant countries, Iran, Iraq and the Gulf Cooperation Council (GCC) countries try to im- prove democratic institutions and to manage their chronically big governments, while experiencing decreased world oil prices. These countries pursue open door policies. Most of the foreign revenues of the region stem from oil and gas exports. Thus, how to manage the production and exports of fos- sil resources is of great importance. This study aims to analyse the effects of quality of democracy, government size, and the degree of openness in explaining depletion of reserves between 1985 and 2015. After testing for panel unit root and co-integration, a panel data model was estimated consid- ering random effects. The results indicate that democratisation and political stability causes higher depletion of oil. In addition, government size affects depletion in a non-linear form, so that oil production is maximised, when government expenditure accounts for nearly 14% of GDP, on aver- age. Furthermore, trade openness positively impacts on the oil depletion. In this case study, higher oil depletion follows strengthening democratic foundations, resizing the public sector, expanding politico-economic ties with trade partners, and applying the modern technology in the upstream oil industries.
Keywords: democracy, oil depletion, government size, openness JEL classifi cation indices: F43, H11, O13, Q32, P48
* I am very grateful to Tarbiat Modares University for supporting this research by providing access to web, scientific journals and databases.
Lotfali Agheli, Faculty Member at Economic Research Institute, Tarbiat Modares University, Tehran , Iran. E-mail: aghelik@modares.ac.ir
1. INTRODUCTION
In resource-rich countries, governments finance public expenditure through natural resources exports. Thus, the aggregate tax-to-GDP ratios are generally low. For instance, the average tax/GDP ratio was 7.4% for the Organization of Petroleum Exporting Countries (OPEC) in 2015, whereas OECD countries ex- perience an average of 34.8% (Heritage Foundation 2015). Generally, the politi- cal regimes which benefit from public participation in socioeconomic decisions, liberal elections, free media, plural parties and non-governmental organisations have high tax/GDP ratios, because people usually demand education, health and social welfare. As a result, governments are accountable for public demands.
Iran, Iraq and the Gulf Cooperation Council (GCC) countries1 are oil-depend- ent countries of the politically unstable Middle East. The historical experiences in this region indicate the heavy reliance on exports of crude oil and natural gas from early 1950s until now (Fasano-Iqbal 2003). Although the selling of natural resources is regarded as the easiest income source for oil-rich governments, it re- sults in unsustainable development from an intergenerational justice viewpoint.
The higher oil prices over the 1970s, on the one hand, and financing develop- ment projects in both military and civil sectors, on the other hand, stimulated the increasing extraction from oil and gas fields. These developments have led to oil depletion – the gradual exhaustion of oil reserves.
The common feature of the political systems in the region is the lack of demo- cratic institutions (Ottaway – Carothers 2004). Almost all of the oil-rich countries of the Middle-East have experienced monarchy, kingdom, or sultanate regimes in the pre- and post-exploration periods of oil fields.
Since oil-based countries are highly dependent on exporting crude oil and its products, foreign earnings play an influential role in stabilizing exchange rate market, lowering inflation rate, creating jobs and intervening government in so- cial and political affairs (Jensen – Wantchekon 2004; Schwarz 2008). In par- ticular, economic booms often occur when oil prices are increasing in the world markets. In such conditions, any administrative inefficiency can be compensated by injection of export earnings to the domestic economy and adoption of mon- etary and fiscal expansionary policies. These policies are consistent with higher military budget, which in turn lowers civil society capability.
Speaking of the developing oil-rich economies, this paper aims to answer these questions: How democracy affects oil production and depletion? What are the ef- fects of government size and trade openness on oil production?
1 Its member states are Bahrain, Kuwait, Oman, Qatar, Saudi Arabia and the United Arab
The rest of the paper is outlined in 4 sections. Section 2 reviews the literature.
Section 3 is devoted to the materials and methods applied in the paper and to the analysis of results. Finally, Section 4 concludes.
2. LITERATURE REVIEW
The numerous studies have centered on the exploitation of natural resources.
Rent-seeking, resource curse, Dutch disease and Environmental Kuznets curve (EKC) are common terms in examining natural resource economics. Mismanage- ment of natural resources stems from greed of governmental authorities in ex- tracting and selling natural stocks, lack of non-governmental and environmental organisations and absence of strong rival parties for the ruling party.
As Brooks – Kurtz (2013) point out, the rents accruing from natural resource exports cause authoritarianism, since governments in natural resource-rich na- tions can easily afford to be myopic, and they trade off long-term growth for im- mediate consumption and power.
In a game-theoretic model, Bhattacharyya – Hodler (2010) predict that natural resources lead to an increase in corruption if the quality of the democratic institu- tions is relatively poor. They test this theoretical prediction using panel data of 99 countries during 1980–2004 and confirm that the relationship between resource abundance and corruption depends on the quality of the democratic institutions.
If there are no serious competitors for the ruling party in parliament and the political arena, the exploitation and exhaustion of natural resources can be accel- erated. On the contrary, the presence of strong parties with a significant number of parliamentary seats reduces the possibility of misusing natural resources. Prze- worski – Limongi (1993) suggest that democracies can be beneficial for growth because democratic institutions constrain “predatory” tendencies of the ruling class, which might harm investment and growth.
The weak economic growth of resource-based economies is known as “re- source curse” which has been verified in various studies, for example Sachs – Warner (2001), Gylfason (2001), Atkinson – Hamilton (2003) and Mehlum et al. (2006). Sachs – Warner (2001) argue that resource abundance tends to render the export sectors uncompetitive; and resource-abundant countries never suc- cessfully pursue broad-based export-led growth. Using historical datasets and employing time-series centric techniques, Haber – Menaldo (2011) test to see if there is a long-run relationship between resource reliance and regime type within countries over time. They found that increases in resource reliance are not associated with authoritarianism. In fact, they generate results that suggest a resource blessing.
Morrison (2009) argues that non-tax revenue is neither pro-democratic nor antidemocratic by its nature; rather, such income merely stabilises the extant re- gime. From the point of view of Auty – Gelb (2000), high rents in the resource sector corrode incentives to invest in the non-resource economy and undermine industrialisation by means of the Dutch disease of exchange rate appreciation.
The continued extraction of exhaustible resources reduces the remaining life of reserves. This may leave low stocks for the future generations, which in turn leads to unsustainable and unfair development. To meet intergenerational equity, Hartwick (1977) recommends investing all profits or rents from exhaustible re- sources in reproducible capital, when he designs a model to solve the ethical problem of the current generation shortchanging future generations by “over- consuming” the current product. In addition, the overexploitation of renewable resources such as overextraction of forests and overfishing could endanger bio- diversity by reducing the fauna and flora stocks. Swanson (1994) and Hilborn et al. (1995) have shown that if natural ecosystems confront with overuse and excessive human activities, the degradation and depletion of the environmental capital will be inevitable.
In an investigation of the effect of natural resource rents on the economic performance of democracy, Collier – Hoeffler (2009) found that, in the absence of resource rents, democracies significantly outperform autocracies, whereas if rents are large relative to GDP, autocracies outperform democracies. The critical point at which the two have equivalent effects is when resource rents are around 8% of GDP.
The governments of resource-rich countries tend to be less accountable to their citizens. Collier (2010) believes that the provocation of rebellions is an extreme consequence of lack of accountability.
In an analysis of the rents from natural resources, Auty (2007) finds that over- rapid domestic absorption is inflationary, and risks of Dutch disease weaken the future growth potential of the economy. He adds “rapid absorption will exacer- bate the Dutch disease effects and increase the dependence of the poor on finite rent transfers that are not sustainable” (Auty 2007: 631–633).
The joint aspect of empirical studies on natural resources’ abundance is the negative effect of resource rents on the democratic processes, in such a way, that rent-seeking governments are less accountable and more corrupt. Hence, achiev- ing a long-run and sustainable path for socioeconomic growth and development requires identifying the factors influencing natural resource management. Fo- cusing on oil production, this paper tries to find these factors across the oil-rich countries of Middle-East geopolitical region.
3. MATERIALS AND METHODS
3.1. Data and variables
This research focuses on democracy trend, government size and trade openness as predictors of oil production. The statistical sample consists of the selected oil-producing countries in the Middle East region including Iran, Iraq, Kuwait, Qatar , Saudi Arabia, Oman and United Arab Emirates2. Because of the availabil- ity of data, the period of study was confined to 1985–2015. Most of our data were extracted from World Bank, BP Statistical Review of World Energy and Interna- tional Financial Statistics (IFS).
The dependent variable is oil production (Q). It is influenced by world oil price, oil reserves, climatic and political variables.
Figure 1 illustrates mean oil production for our sample along with world oil price over time. The overall trend in Q matches historical changes in crude oil price, so that a strong positive correlation is derived between logarithms of Q and world oil price by +0.71.
The democracy level is the only variable extracted from Polity IV dataset (Center for Systematic Peace 2015). This dataset covers all independent states with a total population of 500,000 or more. The Polity project examines the quali- ties of democracy in governing institutions. It describes a range of governing
2 Bahrain was excluded from the sample because of its negligible oil production.
Figure 1. World oil price (US$/barrel) and mean oil production (thousands barrel/day) in logarithms Source: World Bank and BP Statistical Review of World Energy (2016).
authority from fully institutionalised autocracies to mixed authority regimes to fully institutionalised democracies. The “Polity score” evaluates regime author- ity on a scale ranging from –10 to +10. Then, the Polity scores are converted into three political categories: “autocracies” (–10 to –6), “anocracies” (–5 to +5) and
“democracies” (+6 to +10) (Center for Systemic Peace 2014).
The quality of democracy is depicted in Figure 2. It shows that democracy quality is very poor according to the Polity score. It varies between –9 and –6. In other words, the selected countries tend to be autocratic and this is not surprising with monarchy systems in 5 out of 7 countries under consideration. However, there is an overall orientation towards improvement in democratic quality in the region.
The coefficient of correlation between averages of Q and quality of democ- racy is +0.83, which indicates more democratic systems result in increasing oil production.
In order to consider all potential factors in the economy which can affect oil production, two variables were added: government size, which shows the extent of public intervention in the national economy; and openness ratio, which indi- cates international economic and political ties.
3.2. Model
The following functional form was specified to explain the movements in oil production, Q:
Figure 2. Quality of democracy in the selected oil-rich countries (mean polity score) Source: Polity IV dataset, Center for Systematic Peace, 2014.
(1) where POLIT denotes quality of democracy in terms of Polity score. GS shows the government size, as government expenditure to GDP ratio, and GS2 denotes the squared GS. OPEN measures the degree of openness defined by the ratio of total trade (sum of exports and imports) to GDP.
The reason to include the government size in the squared form is that oil pro- duction increases with increasing government size, but the unlimited increase in government size is impossible. On the one hand, government expenditure is determined through budget bill. On the other hand, oil production is subject to technical and geological constraints. For instance, among small oil producing countries such as Bahrain, the continued increase in oil production is not feasible due to geological conditions. Therefore, an optimal size for government can be found in such a way that oil production is maximised. In other words, the explicit relation between government size and oil production may take a non-linear form.
Thus, the following panel data model is written:
(2)
where subscripts i and t denote cross-sections (countries) and time horizon (years), respectively.
This model is defined in semi-logarithmic form, because the oil production fig- ures are of million, or billion orders, but POLIT, GS and OPEN are expressed in relative or ordinal forms. Such specification guarantees the comparability among left- and right-hand side variables.
Except for the sign of coefficient of GS2, I expect that partial derivatives of dependent variable to POLIT, GS and OPEN are to be positive. In other words, better quality of democracy encourages the oil production. Moreover, any increase in government size and trade openness results in increase in the oil production. Ac- cording to the theoretical basics, one would expect the following partial derivatives:
(3)
3.3. Results of econometric model estimation
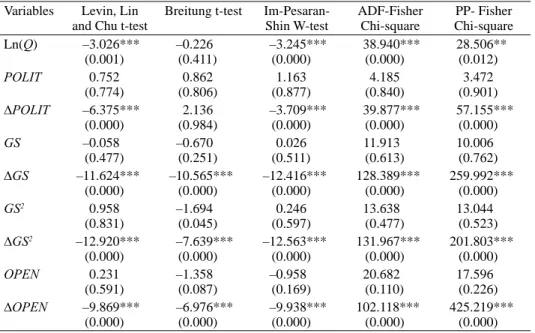
Prior to estimating the model, all variables should be tested against unit root. Oth- erwise, the spurious regression problem will occur. In the panel data models, the unit root tests are known as panel unit root tests, which are performed by various methods proposed by Im et al. (1997), Breitung (2000), and Levin et al. (2002).
( , , 2, ), Q f POLIT GS GS OPEN
2
0 ,
it it it it it it it it it it
LnQ α α POLIT β GS γ GS θ OPEN ε
2
( ) ( ) ( ) ( )
0, 0, 0 , 0 .
Ln Q Ln Q Ln Q Ln Q
POLIT GS GS OPEN
In these cases, the augmented Dickey-Fuller (1984) and Phillips-Perron (1988) tests are applicable. Table 1 reports the panel unit root tests, which indicate the existence of unit roots in the levels of variables, except for Log(Q), but all of them become stationary by the first-order differencing.
Due to panel unit roots, the other problem is to examine the existence of a long-run equilibrium relationship among the variables under study. Since all ex- planatory variables are integrated of order one; I(1), the panel co-integration is tested using Kao residual co-integration test (Kao 1999). The null hypothesis indicates no co-integration. Here, Pedroni (1999) test is not applicable because of near singular matrix created by regression coefficients. The ADF t-statistic is –2.581, while the probability value is 0.0049. Thus, all variables are co-integrated in the long-run.
The third step is to choose between panel and pool system. This comparison is made through F-statistic, which is based on the null hypothesis indicating redun- dant fixed effects. If null hypothesis is rejected, then the alternative hypothesis will be accepted in favour of panel system. Table 2 confirms the panel specifica- tion by considering both cross-section and period fixed effects.
Table 1. Panel unit root tests (1985–2015) Variables Levin, Lin
and Chu t-test
Breitung t-test Im-Pesaran- Shin W-test
ADF-Fisher Chi-square
PP- Fisher Chi-square
Ln(Q) –3.026***
(0.001)
–0.226 (0.411)
–3.245***
(0.000)
38.940***
(0.000)
28.506**
(0.012)
POLIT 0.752
(0.774)
0.862 (0.806)
1.163 (0.877)
4.185 (0.840)
3.472 (0.901)
∆POLIT –6.375***
(0.000)
2.136 (0.984)
–3.709***
(0.000)
39.877***
(0.000)
57.155***
(0.000)
GS –0.058
(0.477)
–0.670 (0.251)
0.026 (0.511)
11.913 (0.613)
10.006 (0.762)
∆GS –11.624***
(0.000)
–10.565***
(0.000)
–12.416***
(0.000)
128.389***
(0.000)
259.992***
(0.000)
GS2 0.958
(0.831)
–1.694 (0.045)
0.246 (0.597)
13.638 (0.477)
13.044 (0.523)
∆GS2 –12.920***
(0.000)
–7.639***
(0.000)
–12.563***
(0.000)
131.967***
(0.000)
201.803***
(0.000)
OPEN 0.231
(0.591)
–1.358 (0.087)
–0.958 (0.169)
20.682 (0.110)
17.596 (0.226)
∆OPEN –9.869***
(0.000)
–6.976***
(0.000)
–9.938***
(0.000)
102.118***
(0.000)
425.219***
(0.000) Note: The numbers in parentheses denote probability values. ***, ** indicate statistical significance at the 1%
and 5% level, respectively.
The fourth step is to choose between models with fixed or random effects. This is performed by Hausman test assuming random effects as null hypothesis. The random effects are preferred reasonably in the following cases:
1. The random intercept term of each cross-section unit is correlated with ex- planatory variables.
2. The “time-invariant” variables, such as gender, religion, geographical re- gion, and language are included in the model (Gujarati 2015).
Table 3 reports the results of Hausman test. This indicates no rejection of ran- dom effects.
Table 3. Results of Hausman test
Test summary Chi-Sq. Statistic Chi-Sq. d.f. Prob.
Cross-section random 0.524 4 0.971
The final step is to estimate Model (2) within a random effects framework. Ac- cording to the settings of cross-section random effects, Eviews software applies the pooled Estimated Generalized Least Squares (EGLS) to estimate the model.
The signs of all coefficients are consistent with theoretical expectations. There are significant relations among variables under consideration. The model is es- timated in the form of panel co-integration, which was confirmed in the former section. F-statistic indicates whole significance of the model and estimated ρ̑3 indicates weak idiosyncratic random effects. These components explain about 4% of total variance, whereas cross-section components (ρ̑1) account for nearly 96% of total variance.
According to the results, one unit increase in quality of democracy (polity score) increases the oil production by 0.043%3, other things being equal. This result is consistent with Bjorvatn et al. (2012) findings. Using panel data of 30
3 Since dependent variable is expressed in logarithm, its change is interpretable as percentage figures.
Table 2. Redundant fixed effects tests
Effects test Statistic d.f. Prob.
Cross-section F 292.248 (6,176) 0.000
Cross-section Chi-square 519.613 6 0.000
Period F 1.857 (30,176) 0.007
Period Chi-square 59.686 30 0.001
Cross-Section/Period F 52.105 (36,176) 0.000
Cross-Section/Period Chi-square 532.946 36 0.000
oil-rich countries, they found that the political power balance moderates the in- come effect of resource rents. Evidently, the balance of political power occurs in democratic and stable countries. The finding is promising in the context of man- agement of oil production in the oil-rich areas. It is expected that in a shift toward democratised societies, the government authorities on the one hand and private sector and environmental activists on the other undertake more responsibility in extracting exhaustible resources and hindering depletion of oil and gas reserves.
The government size affects oil production in non-linear form. In oil-rich countries, governments extract and sell crude oil and gas to finance public ex- penses. The ruling governments in all GCC members, Iran and Iraq have ex- clusive property rights on natural resources, in particular, on energy-producing resources. So, when physical and institutional factors such as proved reserves, sanctions, production quota, let them extract resources, a continued flow of re- sources’ rents is created, which finally reduces the government’s dependence on tax and other sustainable incomes. If the institutional environment is weak, and quality of governance is low, the extraction rates will increase. Because of spe- cific politico-economic situation of the countries under consideration, this article takes unidirectional causality from government size to a given natural resource, i.e., crude oil. But, some authors, for instance, Atkinson – Hamilton (2003) con- sider natural resources, with or without institutional quality effect, as influential factors on public expenditure.
The coefficients of GS and GS2 indicate a parabolic relationship between gov- ernment size and rate of oil production. In other words, crude oil cannot be pro- duced to an infinite horizon. In fact, due to economic, geological and technical reasons oil production follows governmental orders and decisions. By assuming other things constant, the oil production is maximized in our sample when gov- ernment size is set about 13.57% of GDP4.
4 This figure is obtained through partial differentiation of Ln(Q) with respect to GS based on Table 4. Dependent variable: LOG(Q), (1985–2015)
Variable Coefficient Std. Error t-Statistic Prob.
C 6.294 0.513 12.264 0.000
POLIT 0.043 0.0077 5.598 0.000
GS 0.019 0.0064 3.058 0.003
GS2 –0.0007 0.0001 –7.158 0.000
OPEN 0.0069 0.0008 8.356 0.000
F-statistic = 64.578(0.000) ρ̑1= 0.961 ρ̑1= 0.000 ρ̑1= 0.039
Note: With 31 years and 7 countries, total pool (balanced) observations are 217. ρ̑i, i = 1,2,3, denotes shares of total variance considering cross-section, period, and idiosyncratic error components, respectively.
In addition, if trade share in GDP (OPEN) increases by one unit, the oil pro- duction will be increased by 0.0069%. It seems open-door policy induces more production of oil and faster depletion of oil reserves. This is due to high depend- ency to oil and gas revenues. Another explanation of this fact is that the resource curse is coming from fossil resources exports. This finding is incompatible with the results of Arezki – van der Ploeg (2007). In a study on the role of trade poli- cies and institutions in natural resource management, they concluded that the natural resource curse is severe for economic performance in countries with a low degree of trade openness. The key point for the oil-rich countries is the strong relationship between oil supply and trade balance. For these countries, the big- ger openness ratios are correlated with higher extraction of fossil resources. For instance, the increasing demand for importing industrial goods motivates oil pro- duction and exports.
Inter-fuel substitution and switching from exhaustible to renewable resources may help to achieve sustainable growth, so that oil depletion is decreased and environmental damages are minimised.
The other policies, which hinder oil depletion effectively, include designing energy-saving buildings, using efficient transport fleet, scheduling of commercial units properly, and running day light saving (DST) program. After all, making macroeconomic and firm-level policies to improve labour and energy productiv- ity play significant roles in reducing energy intensity in the countries under study.
For instance, the educational investment and market-based energy pricing cause low energy use and oil depletion in the long-term.
4. CONCLUSIONS
Despite natural resource abundance in Iran, Iraq and GCC countries, the develop- ment ranks are lower in terms of human development index (HDI)5 than those of OECD countries (UNDP 2015). This suggests that oil revenues have not played an essential role in their human and economic development. The numerous re- searches in the world have shown that the benefits of resource wealth have re- mained little. Based on these studies, the “resource curse hypothesis” has been tested for resource-rich countries. These concluded that resource-based econo- mies face with adverse effects of economic growth such as high unemployment, inflation, corruption, and rapid depletion of natural resources. By focusing on
5 Qatar with HDI= 0.85 ranks 32th, and Iraq with HDI=0.654 ranks 121th among 188 countries in 2014. Saudi Arabia, United Arab Emirates, Bahrain, Kuwait, Oman and Iran get the 39th, 41th, 45th, 48th, 52th and 69th ranks, respectively.
political systems, the direct relationship between oil depletion and stable and strong economy can be found. This linkage in GCC countries is stronger than in other developing regions.
In line with previous studies, this paper reaches similar findings. The main variable is oil production. According to the econometric results, it is positively affected by quality of democracy, measured by polity score. In explaining the depletion of oil reserves, I have concentrated on selected macroeconomic deter- minants of the presented Middle-East countries.
The findings indicate that high quality of democracy can describe the fast de- pletion of oil reserves in the region. It seems that sample countries are moving toward open societies. To do this, they adopt welfare-enhancing policies, which require enough and certain oil and gas exports.
My research showed a positive relationship between oil depletion and trade openness. This result may be a consequence of dependency on oil and gas exports to fuel economic growth. The higher reliance on oil earnings entails more deple- tion of oil resources. This finding is applied to other resource-abundant econo- mies, which have inefficient tax systems and less democratic regimes.
In the case of resource-rich countries, resource misconduct can be a sign of the allocation of resource revenues to finance public expenditure. Hence, the positive effect of government size on oil depletion is not surprising.
For policy implications, the plural political system, energy-saving policies, di- versification in exports, and using sustainable and endogenous sources to finance government expenditure are recommended for the other resource-rich countries with similar socioeconomic and political regimes.
REFERENCES
Arezki, R. – Van Der Ploeg, F. (2007): Can the Natural Resource Curse Be Turned into a Blessing?
The Role of Trade Policies and Institutions. International Monetary Fund, Working Paper, No.
07/55.
Atkinson, G. – Hamilton, K. (2003): Savings, Growth and the Resource Curse Hypothesis. World Development, 31(11): 1793–1807.
Auty, R. M. – Gelb, A. H. (2000): Political Economy of Resource Abundant States. Paris: Paper Prepared for the Annual Bank Conference on Development Economics.
Auty, R. M. (2007): Natural Resources, Capital Accumulation and the Resource Curse. Ecological Economics, 61(4): 627–634.
Bhattacharyya, S. – Hodler, R. (2010): Natural Resources, Democracy and Corruption. European Economic Review, 54(4): 608–621.
Bjorvatn, K. – Farzanegan, M. R. – Schneider, F. (2012): Resource Curse and Power Balance: Evi- dence from Oil-Rich Countries. World Development, 40(7): 1308–1316.
BP Statistical Review of World Energy 2016. http://Www.Bp.Com/En/Global/Corporate/Energy-
Breitung, J. (2000): The Local Power of Some Unit Root Tests for Panel Data. In: Baltagi, B. H.
(ed.): Nonstationary Panels, Panel Cointegration and Dynamic Panels. Amsterdam: Elsevier, pp. 161–177.
Brooks, S. M. – Kurtz, M. J. (2013): Oil And Democracy: Endogenous Natural Resources. http://
Www.Yale.Edu/Leitner/Resources/Papers/Brooks_Kurtz_2013_Oil%20and%20Democracy.
Pdf.
Center for Systematic Peace (2014): http://Www.Systemicpeace.Org/Polityproject.Html
Collier, P. (2010): The Political Economy of Natural Resources. Social Research, 77(4): 1105–
1132.
Collier, P. – Hoeffl er, A. (2009): Testing the Neo-Con Agenda: Democracy in Resource-Rich Socie- ties. European Economic Review, 53: 293–308.
Fasano, U. – Iqbal, Z. (2003): GCC Countries: From Oil Dependence to Diversifi cation. IMF.
Gujarati, D. (2015): Econometrics by Example. 2nd Edition. U.K.: Palgrave.
Gylfason, T. (2001): Natural Resources, Education and Economic Development. European Eco- nomic Review, 45: 847–859.
Haber, S. – Menaldo, V. (2011): Do Natural Resources Fuel Authoritarianism? A Reappraisal of the Resource Curse. American Political Science Review, 105(01): 1–26.
Hartwick, J. M. (1977): Intergenerational Equity and the Investing of Rents from Exhaustible Re- sources. American Economic Review, 67(5): 972–974.
Heritage Foundation (2015): Macroeconomic Data. http://Www.Heritage.Org/Index/
Explore?View=By-Variables
Hilborn, R. – Walters, C. J. – Ludwig, D. (1995): Sustainable Exploitation of Renewable Resources.
Annual Review of Ecology and Systematics, 26: 45–67.
Im, K. S. – Pesaran, M. H. – Shin, Y. (1997): Testing for Unit Roots in Heterogeneous Panels.
Journal of Econometrics, 115: 53–74.
Jensen, N. – Wantchekon, L. (2004): Resource Wealth and Political Regimes in Africa. Compara- tive Political Studies, 37(7): 816–841.
Kao, C. (1999): Spurious Regression and Residual-Based Tests for Co-Integration in Panel Data.
Journal of Econometrics, 90(1): 1–44.
Levin, A. – Lin, C. F. – Chu, C. S. J. (2002): Unit Root Tests in Panel Data: Asymptotic and Finite Sample Properties. Journal of Econometrics, 108: 1–24.
Mehlum, H. – Moene, K. – Torvik, R. (2006): Institutions and the Resource Curse. Economic Jour- nal, 116(508): 1–20.
Morrison, K. M. (2009): Oil, Nontax Revenue, and the Re-Distributional Foundations of Regime Stability. International Organization, 63(01): 107–138.
Ottaway, M. – Carothers, T. (2004): Middle East Democracy. Foreign Policy, 145: 22–29.
Pedroni, P. (1999): Critical Values for Co-Integration Tests in Heterogeneous Panels with Multiple Regressors. Oxford Bulletin of Economics and Statistics, 61(S1): 653–670.
Phillips, P. C. B. – Perron, P. (1988): Testing for a Unit Root in Time Series Regression. Biometrika, 75(2): 335–346.
Przeworski, A. – Limongi, F. (1993): Political Regimes and Economic Growth. Journal of Eco- nomic Perspectives, 7: 51–69.
Sachs, J. D. – Warner, A. M. (2001): The Curse of Natural Resources. European Economic Review, 45: 827-838.
Said, S. E. – Dickey, D. A. (1984): Testing for Unit Roots in Autoregressive-Moving Average Model of Unknown Order. Biometrika, 71: 599–608
Schwarz, R. (2008): The Political Economy of State-Formation in the Arab Middle East: Rentier States, Economic Reform, and Democratization. Review of International Political Economy, 15(4): 599–621.
Swanson, T. M. (1994): The Economics of Extinction Revisited and Revised: A Generalized Frame- work for the Analysis of the Problems of Endangered Species and Biodiversity Losses. Oxford Economic Papers, 46 (Special Issue on Environmental Economics): 800–821.
UNDP (2015): Human Development Report 2015: Sustaining Human Progress: Reducing Vulner- abilities and Building Resilience. Human Development Report Offi ce, United Nations Develop- ment Programme.