On-line observation of the crystal growth in the case of the non- typical spherical crystallization methods of ambroxol hydrochloride
Orsolya Gyulai, Zoltán Aigner
PII: S0032-5910(18)30411-X
DOI: doi:10.1016/j.powtec.2018.05.041
Reference: PTEC 13414
To appear in: Powder Technology
Received date: 20 December 2017
Revised date: 3 May 2018
Accepted date: 21 May 2018
Please cite this article as: Orsolya Gyulai, Zoltán Aigner , On-line observation of the crystal growth in the case of the non-typical spherical crystallization methods of ambroxol hydrochloride. The address for the corresponding author was captured as affiliation for all authors. Please check if appropriate. Ptec(2017), doi:10.1016/j.powtec.2018.05.041
This is a PDF file of an unedited manuscript that has been accepted for publication. As a service to our customers we are providing this early version of the manuscript. The manuscript will undergo copyediting, typesetting, and review of the resulting proof before it is published in its final form. Please note that during the production process errors may be discovered which could affect the content, and all legal disclaimers that apply to the journal pertain.
ACCEPTED MANUSCRIPT
On-line observation of the crystal growth in the case of the non-typical spherical crystallization methods of ambroxol hydrochloride
Orsolya Gyulai*, Zoltán Aigner
University of Szeged, Institute of Pharmaceutical Technology and Regulatory Affairs, 6, Eötvös Street, Szeged, H-6720, Hungary
E-mail: gyosaat@gmail.com; gyulai.orsolya@pharm.u-szeged.hu
University of Szeged, Institute of Pharmaceutical Technology and Regulatory Affairs, 6, Eötvös Street, Szeged, H-6720, Hungary
E-mail: aigner@pharm.u-szeged.hu Suggestive reviewers:
1. Enrico Modena
Reason: Industrial point of view.
enrico.modena@polycrystalline.it PolyCrystalLine S.p.A.
2. Radosław Kamiński
Reason: I met him during a conference and I got interested in his knowledge about crystallization.
rkaminski85@gmail.com University of Warsaw Faculty of Chemistry 3. Joachim Ulrich
Reason: Outstanding expert of the crystallization topic.
joachim.ulrich@iw.uni-halle.de
Martin-Luther-Universitat Halle-Wittenberg
Center of Engineering Sciences
*Corresponding author
ACCEPTED MANUSCRIPT
Abstract
Spherical crystallization can be an important technological step in the production of a solid form active agent. By the production of spherical crystals, direct compression tablet making can be applied to the powder material. This method makes the tableting process quicker, shorter and more economical with reduced amounts of additives and a reduced number of technological steps. This way, the granulation method can be avoided, which is also advantageous for a moisture sensitive drug.
In this paper, we presented Focused Beam Reflectance Measurement (FBRM) studies applied in the case of the non-typical spherical crystallization methods of the active pharmaceutical ingredient ambroxol hydrochloride. Spherical agglomeration and controlled cooling crystallization methods were carried out based on our previous studies regarding these methods and the crystal formation processes were investigated with FBRM probe. Critical agglomeration periods and other mechanisms, such as the breakage of the agglomerates and the precipitation of small particles, were investigated. Chord length values were observed continuously and samples were taken out in certain points of the crystallization. Particle size analysis was carried out in each case to obtain information on the particle size enlargement caused by the crystallization methods. With the application of light microscopic analysis, aspect ratio and roundness values were also determined to obtain pieces of information on the sphericity-changes of the particles throughout the crystallization and large improvements were presented either for these parameters (aspect ratio from ~ 1.7 to ~ 1.3; roundness from ~ 2.4 to ~ 1.5) and the mean particle size (from ~13 µm to 120-400 µm). Among others, it was revealed that after the spherical agglomeration method (SA), mostly crystal agglomerates were formed, while slow cooling crystallization with alternating temperature profile (ATP) yielded larger and probably harder individual crystals.
Keywords: non-typical spherical crystallization; spherical agglomeration; cooling crystallization; alternating temperature profile; focused beam reflectance measurement;
spherical crystals
ACCEPTED MANUSCRIPT
Highlights
Spherical agglomeration (SA) of four products was observed by the focused beam reflectance measurement (FBRM), conclusions, similarities, differences were summarized and the agglomeration mechanism was revealed.
The same was performed in the case of cooling crystallization with an alternating temperature profile (ATP) as well.
Crystallization types were compared in case of using a double-walled glass reactor of 250 ml with a total solvent volume of 80 ml and, as a scale-up, a jacketed reactor of 750 ml with a total solvent volume of 500 ml, while applying different types of agitation.
The effect of the addition of more cycles to the ATP methods was investigated. Light microscopic exposures prove significant differences between the SA and the ATP products.
ACCEPTED MANUSCRIPT
1. Introduction and aims
1.1. Importance of spherical crystallization
Direct compression tablet making is a frequently used method of producing tablets, which requires spherical particles [1-6]. This method is suitable for active pharmaceutical ingredients (APIs) which are moisture sensitive. This way, the amount of the additives can be reduced and smaller tablets can be produced, which increases patient compliance.
Direct compression tablet making is applicable only if the initial materials have ideal crystal morphology, surface and mean particle size [7, 8]. This can be achieved by spherical crystallization methods [1]. Spherical morphology provides suitable powder rheological properties for the API, thus flow time, angle of repose, bulk density, compressibility and compactibility improve, which ensures good tabletability with reduced amounts of additives [9].
1.2. Spherical crystallization types, crystal growth in the system
In our previous experiments, the comparison of different crystallization methods was carried out in the case of the active ingredient ambroxol hydrochloride (AMB HCl) [10]. Among the typical crystallization methods, which usually mean three-solvent systems, the quasi emulsion solvent diffusion technique [11, 12] was investigated. As non-typical methods, spherical agglomeration [13, 14] (as an antisolvent technique with two solvents [15]) and slow cooling crystallization with an alternating temperature profile [16] were applied. It was revealed, that the non-typical methods are well-applicable to our model drug AMB HCl. The mean particle size was increased by more than an order of magnitude, and the aspect ratio and roundness values also improved. After this, non- typical methods were further investigated; in this work we also intend to examine the mechanism of crystal growth and agglomeration as well as to conclude what the critical parts of the crystal growth are and when the process needs the highest level of supervision. The further measurements with the help of the FBRM probe were based on the previous investigation of the metastable zone [10].
ACCEPTED MANUSCRIPT
1.3. Importance of on-line and in-line methods
If we possess facilities for the use of on-line or in-line imaging or particle size observation methods, a real-time observation of nucleation and crystal growth can be achieved. The focused beam reflectance measuring method (FBRM) is a modern and accurate method for in-line or even on-line measurements [17]. Pioneers of this topic - among others - were Sohrab Rohani, Marco Mazotti, Sotiris E. Pratsinis, Brian Glennon and Zoltán Nagy K. Rohani started measurements with the turbidimetry method and was able to indicate approximately the first signs of crystallization and determine the mean particle size either experimentally and based on calculations [18]. Mazotti and his colleagues analyzed in situ microscopic data and worked out a method that can easily be applied in the prediction of experimental data [19]. Later they also used the FBRM for particle size distribution control [20]. Pratsinis and his co-workers have in situ measured the crystal growth and size and of nanoparticles [21]. Brian Glennon and his colleagues investigated the effect of the probe position and orientation on particle size in dilute agitated suspensions. They have also predicted theoretically the normalized chord length distribution values and these correlated well with the results of the FBRM measurements [22]. Zoltán Nagy K. et. al. also used non-invasive particle size observation methods as on-line techniques for crystallization and applied an alternating temperature profile during cooling crystallization, so he could standardize the mean particle size and its distribution [23].
2. Materials and methods
2.1. Materials
AMB HCl (pharm. grade) was kindly provided by TEVA Pharmaceuticals Plc.
Dimethyl sulfoxide (DMSO) was purchased from Scharlau Chemicals. Ethyl acetate, purified water and methanol were supplied by EGIS Pharmaceuticals Plc. All the applied solvents were of analytical grade.
ACCEPTED MANUSCRIPT
2.2. Crystallization methods Spherical agglomeration method (SA)
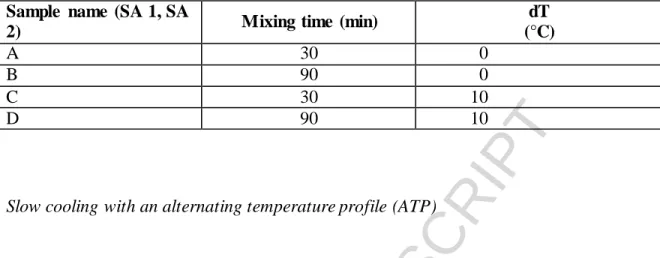
This technique is usually described as a typical method, because bridging liquid can be used in this method. With our API, it was rather a two-solvent system with a solvent and an antisolvent. The technique was described and applied earlier in our previous article [10]. DMSO was chosen as a solvent and ethyl acetate was the antisolvent in their 1:5 ratio. SA 1 experiments were carried out in a rounded-bottomed jacketed reactor (250 ml) in a total volume of 78 ml, while for SA 2 experiments, a Schmizo jacketed glass reactor (750 ml), also with rounded bottom, was applied with a total solvent volume of 500 ml. A horizontal shaker and a marine propeller were applied during SA 1 and SA 2 experiments, respectively. In each case, a nearly-saturated solution of the API was fed in the antisolvent dropwise. Effects of the temperature difference between the solvent and antisolvent (dT) were also investigated, since it can cause morphology changes in the crystals. When the dT is large, there is not enough time for the crystals to organize in a perfect crystal structure, which can cause diverse morphologies. In our previous studies [24] a factorial design was applied to filter out the optimal process parameters for the production of SA agglomerates. The study revealed that out of the 3 applied levels of temperature difference, the lowest and the medium were able to yield spherical crystals.
The applied process parameters are summarized in Table 1.
ACCEPTED MANUSCRIPT
Table 1. The applied parameters during the experiment sets, SA 1 and SA 2. Column dT means the temperature difference between the solvent and the antisolvent.
Slow cooling with an alternating temperature profile (ATP)
The ATP method is a simple controlled slow cooling crystallization method with repetitive cooling-heating cycles around the metastable zone. The theoretical background of this is that during the cooling section, crystals of a certain morphology form, then during the heating, the sharper edges of them start to dissolve resulting a more spherical shape. The smaller particles are going to dissolve perfectly, which helps to keep the particle size distribution more uniform and also to keep the number of particles almost consistent. Therefore, those crystals which are formed during the next cooling section are going to crystallize onto the surface of the more rounded and larger particles and the mechanism goes along the same way until the end of the 13th cycle.
Water/methanol mixture (ratio 1:3) was chosen as a solvent, which was saturated with the API at 65 ºC. ATP 1 experiments were carried out in a jacketed reactor (250 ml) in a total volume of 120 ml, while for ATP 2 experiments, a Schmizo jacketed glass reactor (750 ml) was applied with the total solvent volume of 500 ml. The horizontal shaker was applied for the ATP 1 experiments, while for the ATP 2 experiments the marine propeller was used. In both cases, a controlled, cyclic cooling-heating program was applied with 0.3 ºC/min heating-cooling rate, based on pre-experiments describing the metastable zone [10]. The first cycle started from 75°C to ensure that there were no solid particles in the system. During the cooling, a minimum temperature of 20°C was applied and after reaching it, the heating process was initiated and continued until the maximum temperature, which was 60°C.
Sample name (SA 1, SA
2) Mixing time (min) dT
(°C)
A 30 0
B 90 0
C 30 10
D 90 10
ACCEPTED MANUSCRIPT
General information
The temperature was controlled by a Huber Petite Fleur der kleine Tango thermostat. A Heidolph RZR 2051 stirrer with a marine propeller (150 rpm) and a Heidolph Titramax 101 horizontal shaker (150 rpm) were used for agitation. In the case of the SA methods, a more intense agitation (250 rpm) was used with both of the mixers around the 20th minute to avoid the adhesion of the particles to the glass reactor and also the sedimentation. However, applying 150 rpm in the first section of the agglomeration method is necessary, because this period is the critical agglomeration forming one. Based on our pre-experiments, the application of a more gentle agitation rate in this section is favorable for yielding larger crystal size. The FBRM probe was a Mettler Toledo Lasentec apparatus. Sampling time was 2 seconds or 10 seconds depending on the crystallization type. Average particle size (number length mean particle size, D[1,0]) was determined by a LEICA Q500 MC Image Processing and Analysis System by measuring a minimum of 1000 pieces of individual particles. Aspect ratio values were calculated by dividing the length of the individual particles with their height. The closer this number is to 1.00, the more spherical the particle. Roundness is known as a shape factor giving a minimum value of unity for a sphere. It was calculated by the Leica Software from the ratio of the perimeter squared to the area as follows:
064 . 1 4
2
Area Perimeter Roundness
The adjustment factor of 1.064 corrects the perimeter for the effect of the corners produced by the digitization of the image.
3. Results
3.1. FBRM observation of the non-typical methods
The spherical agglomeration processes of A, B, C, D products were observed by the FBRM. Results were summarized and the time phase of the significant amount of
ACCEPTED MANUSCRIPT
agglomeration was determined. The same was performed in the case of the ATP method and effects of the addition of more heating-cooling cycles to the experiment were revealed. Chord length values were evaluated.
As for the SA 1 method, we can say that the FBRM curves were almost the same in each case, therefore only the experiments with dT = 0 °C are shown in Fig. 1, where the change of the total particle number is presented as a function of experiment time.
Fig. 1. FBRM curves of the formation mechanism of SA 1/A, B, C, D products
We can clearly see the addition of the saturated solution to the antisolvent because the particle number started to increase up to more than 15000 counts (point “a”). A decrease can be observed after 10 minutes of the addition, which was caused by the sedimentation of the larger particles, possibly because the agitation rate 150 rpm was insufficient for this crystallization method, since it was not able to pick up the larger particles from the bottom of the reactor. About 20 minutes after the addition, a more intense agitation (250 rpm) was applied because of the high-level of precipitation at the bottom of the reactor. At this point, the particle number increased slightly up to almost 5000 counts and the chord length values also increased. In Table 2, chord length values that corresponded to the points marked with letters are shown.
Table 2. Average chord length values of the points shown in Fig. 1-2, SA 1 and 2 methods
Point Chord length (mean
square weight, μm) Point Chord length (mean square weight, μm)
a 68 e 162
b 134 f 215
c 141 g 243
d 130 h 195
ACCEPTED MANUSCRIPT
It can be seen from Table 2. that after the agitation rate was increased, the average chord length values increased to a small extent, because the sedentary larger particles could also flow.
SA products (A, B, C, D) were also manufactured in the larger-scale reactor (SA 2).
Since the curves for dT = 0 °C and dT = 10 °C looked almost the same, FBRM curves are shown only in the dT = 0 °C case (Fig. 2.).
Fig. 2. SA 2/A, B, C and D products manufactured in the larger-scale reactor
Chord length values are presented in Table 2, above.
Based on the FBRM data, counts increased (up to point “e”) after the addition of the rich solution to the antisolvent, but then it soon started to decrease until point “f”. At about 20 minutes of agitation with 150 rpm, the agitation rate was increased to 250 rpm in order to let the larger, sedentary particles flow. Then, the number of counts increased again. It is also observable in point “f” that a decrease in the number of counts happened.
That possibly refers to agglomeration because, in parallel, a high level of chord length increment took place. It can be concluded that the first 10 minutes were critical from the aspect of the formation of crystal agglomerates. Point “e” shows lower number of particles compared to the “a” point in the case of the SA 1 method, since here larger volumes were used and investigated with the same probe. It is also remarkable that here we can see almost a constant increase of the average chord length values, which correlates well with our previous studies in connection with the parameter optimization of the SA method. It should be emphasized that in point “h” a chord length decline can be observed due to the intensive and long-term agitation, which can cause the breakage of the particles, especially if they are agglomerations, not individual crystals (that are usually harder and more durable). Agitation by the marine propeller led to smaller, floating pieces in the system, which lowered the average chord length value. The optimization of this parameter is essential.
The ATP method was applied in the small- (ATP 1) and also in the larger-scale (ATP 2) reactor. The evaluation of the FBRM curve of the ATP 1 method can be seen in Fig. 3.
ACCEPTED MANUSCRIPT
Fig. 3. FBRM results of the small-scale ATP 1 method with horizontal shaker
During the first cooling cycle, counts increased as precipitation happened (Table 3).
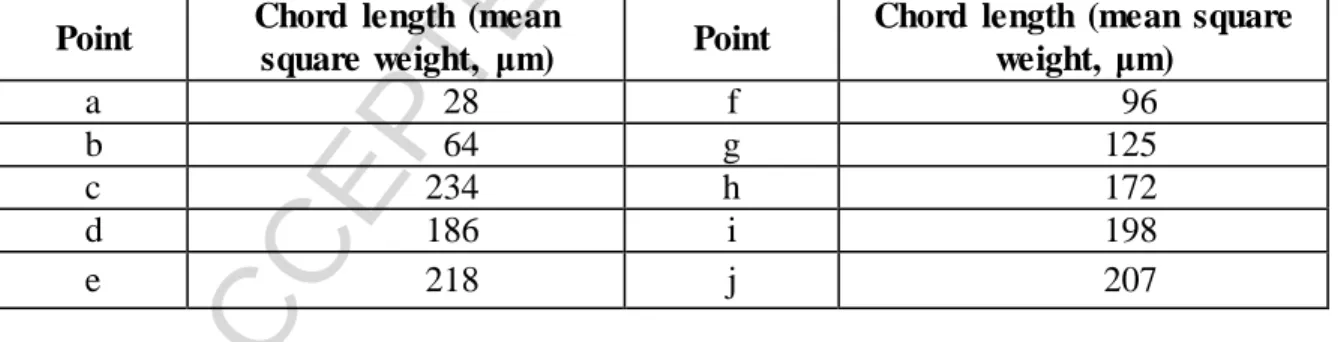
After the second cycle, the mean particle size increased over an order of magnitude. What was not expected was the decrease of the particle size during the third cooling cycle, which is probably due to the sedimentation of the larger particles. It can be seen that number of counts decreased in the case of points “b” and “c”. The theory is that the agglomeration of the particles happened during this second and third cooling cycle because the chord length values increased. In the case of point “c” the chord length value is the highest, therefore it can be stated that the agglomeration is at its highest level here.
After this point a little decrease can be observed in the case of points “d” and “e”. Which may due to breakage or sedimentation. Here, a slight improvement in the roundess values can be seen. It can be said that the agitation rate needs to be more intense for this measuring method because in this case turbulent flow was too low and sedimentation could happen easily, even on the probe itself.
Table 3. Chord length values of the pinned points shown in Fig. 3-4, ATP 1 and 2 methods
Point Chord length (mean
square weight, μm) Point Chord length (mean square weight, μm)
a 28 f 96
b 64 g 125
c 234 h 172
d 186 i 198
e 218 j 207
In the case of the large-scale reactor, FBRM results are shown in Fig. 4. Several heating-cooling cycles were carried out in order to investigate the mechanism of the agglomeration process.
Fig. 4. FBRM results of the large-scale ATP 2 method with marine propeller
ACCEPTED MANUSCRIPT
It can be observed from Table 3. that after the first cooling cycle, in point “f”, we can see that the number of counts increased and the average chord length value is around 96 µm. During the process, constant chord length increment was experienced, which is different from the ATP 1 method, where there was a significant level of sedimentation.
The marine propeller can produce a higher level of turbulent flow, which hinders the particles from the adhesion to the glass wall, the thermometer or the probe. In points “h”
and “i” we could observe a little decline in the number of counts and an increase in the chord length values, which could be assigned to the agglomeration of the particles. In the case of the ATP 1 method, it had already started by the second cooling cycle, but as for the ATP 2 experiment, it started only in the third cycle.
In Figure 3. after point “c” and in Figure 4. after point “i” the counts increased. As the crystallization proceeded, more new particles crystallized and more agglomerates formed of them. This is why number of counts showed a constant increase. At the same time, during a long-term agitation it is always a risk that the agglomerates break because of the mechanical impacts (collision of the particles with each other, with the propeller or with the reactor wall) and this could also lead to the increase of the counts. In an optimal system, number of particles would reach the “equilibrium”, when it is almost constant, since the newly-crystallizing particles would grow onto the surface of an already existing one and only the chord length values would increase in this case.
3.2. Comparison of the SA 1-2 and ATP 1-2 methods
Crystallization types were compared in the case of using a double-walled glass reactor of 250 ml with a total solvent volume of 80 ml and, as a scale-up, a jacketed reactor of 750 ml with a total solvent volume of 500 ml, while applying different types of agitation.
The crystallization type applied first was the SA method. After the small-scale reactor, A, B, C and D products were also prepared in the larger reactor. Particle size differences are shown in Table 4.
ACCEPTED MANUSCRIPT
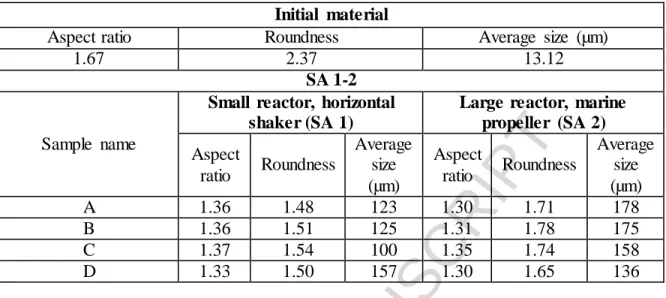
Table 4. Comparison of the particle sizes of the crystals produced under different circumstances of the SA method
Initial material
Aspect ratio Roundness Average size (µm)
1.67 2.37 13.12
SA 1-2
Sample name
Small reactor, horizontal shaker (SA 1)
Large reactor, marine propeller (SA 2) Aspect
ratio Roundness
Average size (µm)
Aspect
ratio Roundness
Average size (µm)
A 1.36 1.48 123 1.30 1.71 178
B 1.36 1.51 125 1.31 1.78 175
C 1.37 1.54 100 1.35 1.74 158
D 1.33 1.50 157 1.30 1.65 136
It can be concluded that a scale-up of one order of magnitude could be achieved, while the aspect ratio values remained nearly the same. The roundness values showed somewhat better values in the case of the SA 1 method due to the rolling effect of the horizontal shaker. The average size values seemed to increase when the marine propeller is used, which can be caused by the turbulent flowing. In this case, individual particles are able to agglomerate with each other from both sides, while the horizontal shaker shapes spherical crystals by rolling them at the bottom or the walls of the reactor, which means that one side is always hampered from cohesion to another particle. Although this effect caused lower particle size values, the horizontal shaker helped to improve the roundness values of the crystals by the constant rolling.
Another important observation was, that in the case of product SA 2 “D” a smaller mean particle size was measured compared to the SA 1 “D” product. It is probably due to the significant level of particle breakage, caused by the marine propeller agitation. During the production of products “B” and “D”, 90 minutes of agitation was applied compared to products “A” and “C” where only 30 minutes was applied. In case of applying the horizontal shaker mean particle size values of “B” and “D” products were always larger than those of products “A” and “C”, while in the case of marine propeller, it was the exact opposite. In the case of the horizontal shaker, particle size increased with the agitation time, especially, when a temperature difference was set between the solution
ACCEPTED MANUSCRIPT
and the antisolvent. Our result obtained with the ATP method, are summarized in Table 5.
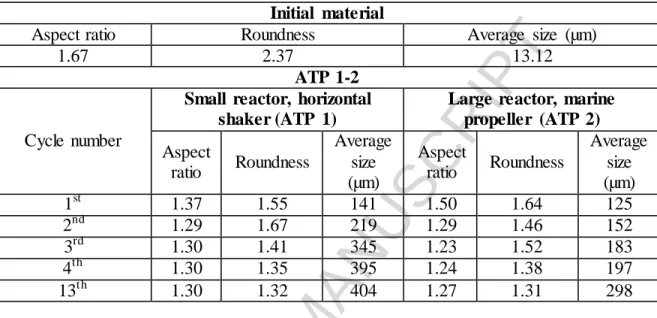
Table 5. Comparison of the particle sizes of the crystals produced under different circumstances of the ATP method
Initial material
Aspect ratio Roundness Average size (µm)
1.67 2.37 13.12
ATP 1-2
Cycle number
Small reactor, horizontal shaker (ATP 1)
Large reactor, marine propeller (ATP 2) Aspect
ratio Roundness
Average size (µm)
Aspect
ratio Roundness
Average size (µm)
1st 1.37 1.55 141 1.50 1.64 125
2nd 1.29 1.67 219 1.29 1.46 152
3rd 1.30 1.41 345 1.23 1.52 183
4th 1.30 1.35 395 1.24 1.38 197
13th 1.30 1.32 404 1.27 1.31 298
In the case of ATP methods, samples were taken out after the 1st, 2nd, 3rd, 4th and 13th cooling cycles to describe the level of the improvements in the particle size, aspect ratio and roundness (Table 5). We can see that in the case of ATP 1, because of the agitation type, the agglomeration of the crystals was remarkable. This is why the mean particle size values are larger than those obtained with the ATP 2 method. This correlates with our previous experience [10]. It can also be concluded that, while the average particle size constantly increased with the number of cycles, roundness seemed to show only a slight improvement and the aspect ratio values stagnated after the 2nd cycle.
3.3. Light microscopic images
The products of the ATP 1 and 2 methods were compared from the aspect of surface smoothness, morphology and size. In Fig. 5, the surface changes can be observed in the case of ATP 1 and ATP 2 methods.
Fig. 5. Surface and size changes after the cooling cycles of the ATP 1 and 2 methods
ACCEPTED MANUSCRIPT
The exposures clearly reveal that a size enlargement happened in both cases. It is also observable that the surface of the particles became smoother after each cooling cycle. It is remarkable how roundness improved during the second cooling cycle of ATP 2. Light microscopic images were taken for investigating the surface and size enlargement of the SA product. The pictures are shown in Fig. 6.
Fig. 6. Surface and size properties of SA 1 and 2 products
It can be observed that the particles are mostly agglomerates in comparison to the ATP 1 and 2 products.
Conclusions
In the course of the current experiments, SA and ATP crystallization methods were applied and the products were evaluated from the aspects of mean particle size, aspect ratio and roundness. Based on the FBRM results, it was revealed that the application of marine propeller was more suitable than the horizontal shaker because in the case of the marine propeller the particles could flow properly, which can enhance crystal growth, since particles were not hindered from either side. At the same time, applying longer mixing times, the breakage of the particles were more remarkable in the case of the marine propeller agitation. Therefore, time of mixing should be optimized to obtain the largest and most spherical particles besides low ratio of broken ones. It was also concluded that with the use of the SA method, the critical agglomeration-forming section of the process is during the first 10 minutes from the addition of the solution to the antisolvent. This could be concluded based on the FBRM data, which showed decreasing chord length and particle number values, due to the sedimentation of the larger agglomerates.
When ATP methods were used, additional cooling cycles caused a constant improvement in the average size of the particles, but after the second cycle, roundness seemed to show non-significant changes, and aspect ratio values stagnated after the additional cycles. Since the differences in roundness and aspect ratio values of ATP 1 and
ACCEPTED MANUSCRIPT
2 methods were not significant, it can be concluded that this method is probably well- scalable and may be applicable in case of industrial production in the course of our further work.
From the light microscopic exposures it can be concluded that the ATP 1 and 2 methods seemed to be more suitable for the production of larger, individual particles, while mostly crystal agglomerates were formed with the SA 1-2 methods.
It can be concluded that compared to the initial AMB HCl properties, in each case a large improvement happened regarding the particle size, roundness and aspect ratio values after the application of either the ATP or the SA method. This means that they would provide better flowing and compressing properties, which would improve tabletability (direct compression tablet making would be adaptable, which method is characterized by lower solvent and additive consumption making the production more economical). These crystallization methods - especially the ATP 2 - methods could be implemented in the industrial production of the crystalline drug compound and this would make the handling, loading and tableting easier to a large extent.
Acknowledgement
This work was financially supported by the Gedeon Richter’s Talentum Foundation (19- 21, Gyömrői Road, 1103 Budapest, Hungary).
We would like to thank EGIS Pharmaceuticals PLC their contribution to the FBRM measurements.
Declatarion of interests
No potential conflict of interest was reported by the authors.
ACCEPTED MANUSCRIPT
Bibliography
[1] F.Z. Ren, Y.R. Zhou, Y. Liu, J.P. Fu, Q.F. Jing, G.B. Ren, A mixed solvent system for preparation of spherically agglomerated crystals of ascorbic acid, Pharm Dev Technol, 22 (2017) 818-826.
[2] S.V. Patil, A.P. Pawar, S.K. Sahoo, Improved compressibility, flowability, dissolution and bioavailability of pioglitazone hydrochloride by emulsion solvent diffusion with additives, Pharmazie, 67 (2012) 215-223.
[3] C.N. Patra, S. Swain, S. Mahanty, K.C. Panigrahi, Design and characterization of aceclofenac and paracetamol spherical crystals and their tableting properties, Powder Technol, 274 (2015) 446-454.
[4] A. Nokhodchi, M. Maghsoodi, D. Hassan-Zadeh, M. Barzegar-Jalali, Preparation of agglomerated crystals for improving flowability and compactibility of poorly flowable and compactible drugs and excipients, Powder Technol, 175 (2007) 73-81.
[5] Y. Kawashima, A. Imai, H. Takeuchi, H. Yamamoto, K. Kamiya, T. Hino, Improved flowability and compactibility of spherically agglomerated crystals of ascorbic acid for direct tableting designed by spherical crystallization process, Powder Technol, 130 (2003) 283-289.
[6] P. Szabo-Revesz, H. Goczo, K. Pintye-Hodi, P. Kasa, I. Eros, M. Hasznos-Nezdei, B.
Farkas, Development of spherical crystal agglomerates of an aspartic acid salt for direct tablet making, Powder Technol, 114 (2001) 118-124.
[7] M. Tezyk, E. Jakubowska, K. Milczewska, B. Milanowski, A. Voelkel, J. Lulek, The influence of direct compression powder blend transfer method from the container to the tablet press on product critical quality attributes: a case study, Drug Dev Ind Pharm, 43 (2017) 911-916.
[8] W.J. Sun, A. Aburub, C.Q.C. Sun, Particle Engineering for Enabling a Formulation Platform Suitable for Manufacturing Low-Dose Tablets by Direct Compression, J Pharm Sci-Us, 106 (2017) 1772-1777.
[9] A.N. Trementozzi, C.Y. Leung, F. Osei-Yeboah, E. Irdam, Y.Q. Lin, J.M. MacPhee, P. Boulas, S.B. Karki, P.N. Zawaneh, Engineered particles demonstrate improved flow properties at elevated drug loadings for direct compression manufacturing, Int J Pharmaceut, 523 (2017) 133-141.
[10] O. Gyulai, P. Szabo-Reyesz, Z. Aigner, Comparison Study of Different Spherical Crystallization Methods of Ambroxol Hydrochloride, Cryst Growth Des, 17 (2017) 5233- 5241.
[11] F. Espitalier, B. Biscans, C. Laguerie, Particle design Part B: batch quasi-emulsion process and mechanism of grain formation of ketoprofen, Chem Eng J, 68 (1997) 103- 114.
[12] A. Jain, A. Jain, A. Jain, A. Jain, Quasi emulsion spherical crystallization technique based environmentally responsive Tulsion (R) (pH dependent) microspheres for colon specific delivery, J Appl Biomed, 14 (2016) 147-155.
[13] Y. Kawashima, F. Cui, H. Takeuchi, T. Niwa, T. Hino, K. Kiuchi, Improved Static Compression Behaviors and Tablettabilities of Spherically Agglomerated Crystals Produced by the Spherical Crystallization Technique with a 2-Solvent System, Pharm Res-Dordr, 12 (1995) 1040-1044.
ACCEPTED MANUSCRIPT
[14] D. Amaro-Gonzalez, B. Biscans, Spherical agglomeration during crystallization of an active pharmaceutical ingredient, Powder Technol, 128 (2002) 188-194.
[15] W. Kaialy, M. Maniruzzaman, S. Shojaee, A. Nokhodchi, Antisolvent precipitation of novel xylitol-additive crystals to engineer tablets with improved pharmaceutical performance, Int J Pharmaceut, 477 (2014) 282-293.
[16] Y. Yang, Z.K. Nagy, Combined Cooling and Antisolvent Crystallization in Continuous Mixed Suspension, Mixed Product Removal Cascade Crystallizers: Steady- State and Startup Optimization, Ind Eng Chem Res, 54 (2015) 5673-5682.
[17] Y. Zhang, Y.B. Jiang, D.K. Zhang, Y. Qian, X.Z. Wang, Metastable zone width, crystal nucleation and growth kinetics measurement in anti-solvent crystallization of beta-artemether in the mixture of ethanol and water, Chem Eng Res Des, 95 (2015) 187- 194.
[18] M. Raphael, S. Rohani, On-line estimation of solids concentrations and mean particle size using a turbidimetry method, Powder Technol, 89 (1996) 157-163.
[19] M. Kempkes, J. Eggers, M. Mazzotti, Measurement of particle size and shape by FBRM and in situ microscopy, Chem Eng Sci, 63 (2008) 4656-4675.
[20] A. Ruf, J. Worlitschek, M. Mazzotti, Modeling and experimental analysis of PSD measurements through FBRM, Part Part Syst Char, 17 (2000) 167-179.
[21] S. Farquharson, S. Charpenay, M.B. DiTaranto, P.A. Rosenthal, W. Zhu, S.E.
Pratsinis, In-situ particle size and shape analysis during flame synthesis of nanosize powders, Acs Sym Ser, 681 (1998) 170-186.
[22] P. Barrett, B. Glennon, In-line FBRM monitoring of particle size in dilute agitated suspensions, Part Part Syst Char, 16 (1999) 207-211.
[23] L.L. Simon, Z.K. Nagy, K. Hungerbuhler, Comparison of external bulk video imaging with focused beam reflectance measurement and ultra-violet visible spectroscopy for metastable zone identification in food and pharmaceutical crystallization processes, Chem Eng Sci, 64 (2009) 3344-3351.
[24] Gyulai, O.; Kovács, A.; Sovány, T.; Csóka, I.; Aigner, Z., Optimization of the Critical Parameters of the Spherical Agglomeration Crystallization Method by the Application of the Quality by Design Approach. Materials 11 (2018) 635.