Examination of rainfall data for 110 years using spectral and wavelet analysis
Csaba Ilyés*, Endre Turai, Péter Szucs˝
MTA-ME Geoengineering Research Group, Institute of Environmental Management, Faculty of Earth Science and Engineering, University of Miskolc, Miskolc, Hungary
Received: July 26, 2017; accepted: December 7, 2017
The aim of our research was to better understand the spectral characteristics of precipitation variability, because through infiltration, this is the most important source of groundwater recharge. To better understand the periodicity of the rainfalls, we used monthly and annual rainfall data. We examined precipitation time records over a 110-year period from two different cities in the Carpathian Basin, obtained from the Hungarian Meteorological Service. With discrete Fourier-transformation (DFT) and wavelet time series analysis, we defined local cycles and developed a forecast for the Debrecen area.
Using DFT, we calculated the time-period distributions (spectra) of monthly and annual rainfall data.
Spectra from the annual rainfall data showed 16 dominant periods in Debrecen and 17 in Pécs. At the two stations, the most dominant cycles were 3.6 and 5 years, respectively; there were several other cycles locally present in the data sets. From the monthly data sets, several other periodic components were calculated locally and countrywide as well.
Using wavelet analysis, the time dependence of the cycles was determined in the 110-year data set for two Hungarian cities, Debrecen and Pécs.
Keywords:Debrecen, hydrology, Pécs, precipitation, spectral analysis, time series, wavelet
*Corresponding author: Csaba Ilyés; MTA-ME Geoengineering Research Group, Institute of Environmental Management, Faculty of Earth Science and Engineering, University of Miskolc, Egyetemváros, Miskolc H-3515, Hungary
E-mail:hgilyes@uni‑miskolc.hu
This is an open-access article distributed under the terms of theCreative Commons Attribution-NonCommercial 4.0 International License, which permits unrestricted use, distribution, and reproduction in any medium for non- commercial purposes, provided the original author and source are credited, a link to the CC License is provided, and changes–if any–are indicated.
DOI: 10.1556/24.61.2018.01 First published online February 13, 2018
Introduction
In climate research, the investigation of long time series is becoming increasingly important, because of the continuously growing data sets of measured parameters.
At present, it is frequently possible to examine the temperature data, which was continuously measured over 200 years, and several other measured climate variables are available as well for a long timescale. In this paper, precipitation records covering 110 years were examined with mathematical methods.
It is also clear that the climate change or the extreme weather conditions can influence the water cycle on a global as well as on a local scale. Water management practice should be able to handle these changes to fulfill the increasing water demands.
Szöllösi-Nagy (2015) argues that the water cycle is accelerating due to extreme weather conditions. More and more water-related hazards are observed all over the world. To solve water-related problems successfully, the cyclic behavior of water cycle components need to be understood.
Long meteorological records can be examined with statistical methods (Valipour 2012b) to look for long-term trends in the time series or with spectral analysis and to study the cyclic variation of the data. The methods can complement to each other.
Spectral and wavelet analyses have been used in such research.
These methods for detecting periods have been used in several studies to investigate the cyclic variables of a time series. In Central America, the monthly mean precipita- tion data of 131 stations were analyzed with these harmonic methods (Hastenrath 1968). Discrete Fourier-transformation (DFT)-based spectral analysis was used to examine the precipitation in the Bükk–Mátra (Kovács and Turai 2014) and the Nyírség regions (Ilyés et al. 2015) in Hungary. Both the studies used shorter periods to identify the cyclic variations of the regions. In the Nyírség region, monthly rainfall data were used, and the dominance of a 1 and 0.5-year cycle was determined with 19–20 more periodic components altogether. In Bükk–Mátra, annual mean and maximum values were used from 38 different meteorological stations and the results showed dominant 3.5-, 4.9-, 28.7- to 29.8-, and 9.5- to 9.9-year cycles in the data.
A Lomb–Scargle periodogram, which is also based on the DFT, was used to examine thefluctuations of shallow groundwater levels in the Tisza region of Hungary (Kovács et al. 2010). In that paper, the existence and dominance of 1-, 11-, and 5-year- long cycles were determined in most of 120 examined wells. The same method was also used in the Danube–Tisza Interfluve region of Hungary, where a 5-year-long cycle was determined in 87% of the examined wells and a 12-year cycle in 60% of the wells (Kovács et al. 2004). There are methods to use the periodogram with unevenly spaced time series as well, solving the criteria of equidistance (Matyasovszky 2015).
Wavelet analysis has previously been used on several climate-related data sets.
Using wavelet analysis, three time series (oak tree rings and precipitation data from Budapest) were analyzed and compared with one another. It was found that all three time series exhibit strong interannual variability at 2- to 4-year timescales (Sen and Kern 2016). According to Sangdan (2004), the spatial pattern of the rainfalls may have
changed since 1945, and the dominant period is about 16 years. Liu et al. (2009) used wavelets to examine the annual rainfall record in the Sanjiang Plain, China, where the dominance of 2- to 4-year-long signals was determined for the period 1978–1996, with 1- to 2-year-long signals mainly occurring from 1959 to 1961, 1968 to 1973, 1974 to 1977, 1982 to 1985, and 1987 to 1993. In Heilongjiang Province, China, precipitation data from 1956 to 2009 were examined using wavelet analysis and it was determined that four main periods seem to exist of about 6, 11, 19, and 31 years (Zheng et al.
2014). Wavelets can also be used to define the absence of a cycle in a time series, as examined in the shallow groundwater wells of the Northern Great Plain of Hungary (Garamhegyi et al. in press).
The number of records required was also examined (Valipour 2012a). With monthly rainfall data, several scenarios were calculated and the correlation was compared. Using 60, 120, and 588 monthly data records, theR2of the models was calculated up to 0.8 or 0.9.
The main aim of this research was to obtain complementary results to the previous studies, to prove the presence of the cycles detected in shallow groundwater levels and in the precipitation data sets as well, to confirm that there are similarities with the records measured in other regions of the earth and data measured in other parts of the hydrological cycle.
Materials and methods
Mathematical basis of spectral analysis
There are several ways to examine long-term time-series data, one of which is the examination for cyclic properties, based on DFT. These long-term precipitation data sets can be considered as equidistantly sampled data or time series; therefore, spectral analysis can be performed (Båth 1974;Bracewell 1978).
The spectral analysis is based on Fourier transformation, where the spectrum can be calculated from the following equations (Panter 1965;Mesk ´o 1984):
YðTÞ= Z∞
t=−∞
yðtÞe−j2Tπtdt,
where t, time, the independent variable of the registration; y(t), the recording, registered signal; j, imaginary unit; T, period, the length of a cycle; and Y(T), spectrum of the registered signal.
YðTÞ=Re½YðTÞ+jIm½YðTÞ,
YðTÞ=AðTÞejΦðTÞ,
where Re[Y(T)], real spectra, first part of the complex spectra; Im[Y(T)], imaginary spectra, second part of the complex spectra;A(T), amplitude of the complex spectra;
andΦ(T), phase angle of the complex spectra.
The amplitude and phase angle can be calculated from the real and imaginary spectra (Candy 1985):
AðTÞ= ffiffiffiffiffiffiffiffiffiffiffiffiffiffiffiffiffiffiffiffiffiffiffiffiffiffiffiffiffiffiffiffiffiffiffiffiffiffiffiffiffiffiffiffiffiffiffiffiffiffi Re½YðTÞ2+Im½YðTÞ2 q
,
ΦðTÞ=arctgIm½YðTÞ Re½YðTÞ:
The relative amplitude spectrum is defined as values of the amplitude spectrum compared with the absolute maximum of the amplitude spectrum.
Mathematical basis of forecasting
When the amplitude spectrum [A(f)] and the phase spectrum [Φ(f)] are known, the original y(t) measured data can be recalculated (Kovács and Turai 2014) with the following equation:
yðtÞ=Y +
Z
+fN0
AðfÞej½2πf t+ΦðfÞdf,
where f=1/T, the frequency of a cycle andfN, Nyquist frequency.
When using only the major and additional minor cycles, a deterministic precipita- tion data set can be calculated, with no stochasticity:
yðtÞdet=Y + 2 treg
X
Ii=1
Aicos 2π
Tiðt −1901Þ+ΦðTiÞ
,
wherey(t)det, data calculated from the deterministic components;Y, expected value, declared static through the examined period;treg, length of the data set;Ti, period of the cyclei;I, number of the deterministic cycles;Φ(Ti), phase angle of the cyclei; andAi, amplitude of the cyclei.
The linear relation between the original measuredy(t) data and the deterministic y(t)detdata can be considered as the error term of the calculated data, which can be calculated with the Pearson’s correlation coefficient (Mosteller and Tukey 1977), can be interpreted as the stochasticity in the time series.
If thetvalue exceeds the year 2010, predictions can be calculated for the future. In this paper, the periodic components of the Debrecen data set were used and a forecast was delivered up to the year 2030.
Mathematical basis of wavelet analysis
Wavelet time series analysis is a well-known method to investigate the time- dependence of a cycle within a time series (Nason and von Sachs 1999). The shape of the cycles searched for in the registered signals can be described with harmonic functions; in the examination, sine wave packet was used. One technique for wavelet analysis is applying convolutionalfiltering (Turai 2005).
Ax(t) wavelet and a registered y(t) time series are defined as follows:
xðtÞ=cos 2π
Tit
,
xðtÞ=sin 2π
Tit
,
where the cosine function is the real wavelet, the sine function is the imaginary wavelet, and the equation of the analysis is the following. By means of the convolution of the wave packets (wavelets) and the registered signal produced, the weight of the given cycle (ywavelet-tr.
) in the signal can be determined at each time of registration:
ywavelet−tr:ðtÞ= Z
+∞
τ=−∞
xðτÞyðt −τÞdτ= Z
+∞
τ=−∞
yðτÞxðt −τÞdτ:
The second way to carry out wavelet analysis is using a cross-correlation function [Rxy(τ)]:
RxyðtÞ= 1 treg
Z
tmax
τ=tmin
xðτÞyðt +τÞdt:
In the examination, a normalized cross-correlation function is used:
RðNÞxy ðtÞ= RxyðtÞ MaxfRxyðtÞg:
Materials
The data were acquired from the Hungarian Meteorological Service’s online database (HMS 2015), which contains large amounts of meteorological data from
several Hungarian cities. Annual and monthly precipitation data sets were downloaded and used for these examinations. Debrecen was chosen because it was defined as a sample area for the calculations and further adaptation of the results, detailed below, whereas the data of Pécs were chosen for its expected difference from Debrecen. For the calculations, a self-made software for DFT was used (Turai 1983).
Results and discussion
Annual precipitation
First, the periodic component of the 110-year-long annual data set was examined.
Using spectral analysis, several cycles were determined from the Debrecen and Pécs data sets.
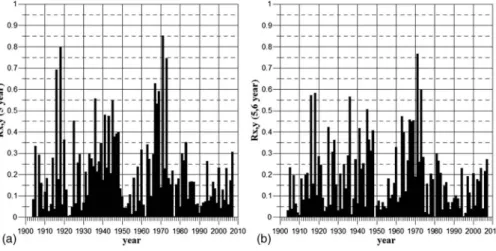
For the annual precipitation data, the registration period is 1901–2010; thus, the length of the registration period istreg=110 years, meaning the number of samples for each city is 110. With this method, the minimal length of period–called the Nyquist period–can be calculated; it is 2 years in this case. The results of the spectral analysis, the cycles, and their relative amplitude are shown in Fig.1.
In Debrecen, 18 cycles were determined, with 10 major cycles and 8 additional ones. In this city, the 3.6-year-long cycle was the most dominant, with 100% relative amplitude, whereas the amplitude spectra of other cycles were between 27% and 77%.
In Pécs, 17 cycles were calculated, almost the same as in Debrecen; but in this case, most of the cycles were defined as major cycles (16 of them) with relative amplitudes between 60% and 100%. This means that the rainfall in Pécs can be mainly described with deterministic dominant cycles, as opposed to Debrecen, where the stochasticity is much more dominant. The 4.5-year cycle was the most dominant, followed by the 5-year and the 3.6-year cycles with over 90% relative amplitude as well.
Fig. 1
Relative amplitude spectra of Debrecen (a) and Pécs (b), according to annual precipitation data
The data set was examined with 1% white noise. In Debrecen, almost the same results are shown, whereas in Pécs, a slightly different spectrum was calculated. This means that the spectrum from Debrecen was accepted to be correct. In Pécs, several cycles were calculated in both cases; the 3.6-, 5-, 5.6-, and 7.7-year-long ones appeared in the original and in the data with added noise. Some of the cycles were calculated to be close to each other, so can be interpreted as the same. The cycle with the highest amplitude is the 3.6-year long, the same as in Debrecen.
Monthly precipitation
The monthly precipitation data sets contain monthly rainfall data from January 1901 to December 2010, so the length of the registration period istreg=1,320 months.
In Debrecen, 43 cycles were detected and in Pécs, 65 (Fig.2). Many similarities can be found between the two stations’ data sets. The 1-year cycle is clearly the most dominant, which is followed by the 0.5-year cycle with 57.46% relative amplitude in Debrecen and 66.53% in Pécs.
Because of the dominance of these two cycles, the other periodic components were determined to be additional cycles but were considered important in the precipitation data set. In Debrecen, the other relatively dominant cycles are 59, 14.7, and 378 months long; most of them have relative amplitude under the 20% limit value, but were considered important. In Pécs, with similar relative amplitudes, the important minor cycles are 5.5-, 54-, 12.2-, and 60-month long (Ilyés et al. 2017).
The cycles, which were calculated locally, show the differences between the two regions. Debrecen is on the eastern side of the Hungarian Great Plain, with a
Fig. 2
Relative amplitude spectra of Debrecen (a) and Pécs (b), according to monthly precipitation data
continental climate, whereas Pécs is closer to the Adriatic, with different climatic conditions, according to the Köppen and Trewartha classification (Péczely 1979).
The results presented in this paper complement those of previous research, examining shallow groundwater (Kovács et al. 2004, 2010). In both cases, the presence of a 5-year and the 11- to 13-year cycles has been determined. Garamhegyi et al. (in press) determined that there are absences of the 1-year-long cycle in many of the shallow groundwater wells of the Northern Great Plain of Hungary, and there is a connection between the absence of the 1-year-long cycle and the Mediterranean cyclones from the Gulf of Genoa on a regional scale.
In addition, the results of the examination of precipitation in other parts of Hungary have been confirmed, as most of the same cycles have been determined (Kovács and Turai 2014;Ilyés et al. 2015) and the calculated cycles are also comparable with the periods defined in Asia (Zheng et al. 2014).
Forecasting
For testing the forecasting method, the sample area of Debrecen was chosen. The cyclic components of the annual and monthly rainfall data for 110 years were analyzed and several scenarios were calculated.
From the cyclic properties of the Debrecen data set, an annual rainfall time series was recalculated. In this examination, the teaching phase was the time period between 1901 and 2010, whereas the validation phase was between 2011 and 2016 (HCSO 2016).
The results of annual precipitation are shown in Fig.3, where the black dots are the measured and the colored dots are the calculated values.
Fig. 3
Calculated annual rainfall data in the Debrecen area from 10 periodic components (a) and 18 periodic components (b)
With the calculated amplitude, period of time and phase angle the deterministic precipitation time series were recalculated and forecasting was carried out up to the year 2030.
In the first case, 10 dominant cycles were used for the calculation, and the correlation coefficient between the measured and the calculated precipitation time series is 0.6893. In the validation phase, the correlation coefficient is 0.7167, which can be interpreted as a moderate correlation. After 2010, no exceptionally large amount of rainfall was expected, and the range is between 400 and 600 mm, with a higher value in the year 2030. With this calculation, the expected value between 1901 and 2010 is 574.8 mm/year, with a standard deviation of 89.7 mm/year and for the predicted period, the average is 546.7 mm/year, with standard deviation of 56.5 mm/year. The decrease from the teaching period is 5%. This could be caused by the method – only the periods with relatively high amplitudes are used, the extremities are wiped out –or the annual rainfall could be in a period where no extreme values are expected.
For the second examination (Fig.3, right-hand side), all the 18 dominant major and minor cycles were used and the correlation coefficient, calculated from the original and the determined data set in the teaching time period, is 0.7339. This can be described as a strong correlation. The forecasting results point to a similar conclusion as in thefirst case, but the values range between a larger interval, 450–650 mm, without any extreme values. The expected value for the teaching phase is 574.4 mm/year, with a standard deviation of 98.7 mm/year, and for the forecasting phase is 559.4 mm/year, with a standard deviation of 66.1 mm/year.
Figure4shows the correlation between the calculated and the measured data of the validation phase. As seen in the graph, with 10 cycles, the correlation becomes relatively high as 0.7167, whereas with 18 cycles, the coefficient drops to 0.5169.
Only in 2016 can a relatively large difference be noticed, where with 10 dominant cycles, the calculated data are closer to the measured records.
For the calculation of the monthly precipitation data set, several cyclic parameters were used. If only 15 of the most dominant cycles are used, the correlation coefficient value is only 0.47, which can be described as a moderate correlation, but the calculated monthly rainfall values will change only over a very small interval, without any extreme values.
In the case of 164 cycles, the correlation coefficient rises above the 0.62 value, which is also a moderate correlation, but the calculation shows more extremely high or small monthly rainfall values, closer to the original measured data.
The results show that with less cycles, a more precise forecasting can be calculated;
thus, the method for choosing the adequate number of cycles can be a direction of future researches.
The lack of extreme precipitation records in the forecast data sets is a deficit of the used method, but this can be corrected using other statistical methods for employing the extreme high or low values, such as the Gumbel distribution (Gumbel 1935).
Wavelet analysis
Wavelet analysis was used to determine the weight distribution of dominant cycles during the registration period. For the analysis, we used the periods from the previous examination from Debrecen and Pécs. All the dominant cycles from the Debrecen annual data set were used, and the cycle with the highest amplitude value was chosen from the Pécs annual rainfall data set.
For the examination, a sine-wave packet with unit amplitude was used, with the periods of time detected previously. In the graphs, the correlation coefficient shows the years, where the cycle presence was dominant or less dominant.
The wavelet of the 4.5-year cycle shows five local maximum values (with a correlation coefficient higher than 0.8) in the years 1956, 1963, 1916, 1945, and 1938.
The wavelet of the 4.3-year cycle from Debrecen shows minimal similarities, with four maximum values, in the years 1918, 1971, 1973, and 1916. The decades of the 1910s and the 1960s–1970s have the more dominant values of cycles in both cases, whereas much less dominance can be noticed after 2000 (Fig.5).
Several similarities can be found when examining the other relevant cycles in the time series. Most of the high correlation values can be found in the same decades, with almost the same value (Fig.6). With the local maxima in the cross-correlation, there is a small number of minima in the data set, at the end of the 1910s, 1940s 1970s, and
Fig. 4
Correlation of the validation phase
1990s. In addition, a much lower dominance of the cycles can be detected in the third millennium.
The analysis of the weight distribution of the 4.3- and 5.6-year cycles is shown in Figs5and7. It shows that both cycles occurred in the 1918 and 1971 environments,
Fig. 6
Wavelet cross-correlation of the 3.6-year cycle in Debrecen Fig. 5
Wavelet cross-correlation of the 4.3-year cycle from Debrecen (a) and the 4.5-year cycle from Pécs (b)
with the highest weight in the 1-year sampling rate; however, the weight of the 4.3-year cycle was more than 10% higher in 1918 as in 1971, whereas the weight of the 5.6-year cycle was the greatest in 1971.
Using wavelet analysis, it is also possible to estimate the weight distribution of the various precipitation cycles in the context of a given year. In this calculation, a period of 2 years was chosen to examine the changes of the dominance in a 40-year scale.
Figure8presents the precipitation data spectra of 1918 and 1958. It is clearly visible
Fig. 7
Cross-correlation values of the 5 (a) and 5.6-year cycles in Debrecen (b)
Fig. 8
Dominance of the different cycles in the year of 1918 (a) and 1958 (b) in Debrecen
that in the time interval around 1918, the 4.3-year cycle was the decisive one in the 1-year sampling rate, but in 1958, the 10- to 13-year cycles were also dominant.
The results of the wavelet analysis show similarities with research carried out in the Far East. The dominance of approximately 4-year cycles in the 1970s has been proven both in China (Liu et al. 2009) and in this research.
Conclusions
In a continuously changing climate, defining deterministic values for the meteoro- logical and hydrogeologic parameters can be a challenge and also a step to a better understanding of the behavior of the climate.
The cause of the cycles can be a direction for future studies, most importantly, finding what the main reason may be behind the dominance of the 5-year period of both precipitation and shallow groundwater levels.
Based on our investigations including two different Hungarian cities, it was proved that the DFT can be applied successfully to reveal the cyclic components of 110-year- long rainfall records. It is equally important to mention that forecasting of rainfall events is also possible until 2030 with the proposed method. We believe that by using this method, several uncertainties of rainfall events can be reduced and thus the method can be applied to any region or any rainfall record. It should also be mentioned that several cycles were found at Pécs and Debrecen, which had been calculated before in Hungary and Asia; therefore, some of the results can be interpreted globally.
Acknowledgements
The research was carried out within the GINOP-2.3.2-15-2016-00031“Innovative solutions for sustainable groundwater resource management”project of the Faculty of Earth Science and Engineering of the University of Miskolc, within the framework of the Széchenyi 2020 Plan, funded by the European Union, co-financed by the European Structural and Investment Funds.
References
Båth, M. 1974: Spectral Analysis in Geophysics.–Elsevier Science, Amsterdam/Oxford/New York, 580 p.
Bracewell, R.N. 1978: The Fourier Transform and Its Applications.–McGraw–Hill Publishing Company, Oxford, 496 p.
Candy, V.J. 1985: Signal Processing–The Model-based Approach.–McGraw–Hill Publishing Company, Oxford, 256 p.
Garamhegyi, T., J. Kovács, R. Pongrácz, P. Tanos, I.G. Hatvani in press: Investigation of the climate-driven periodicity of shallow groundwater levelfluctuations in a Central-Eastern European agricultural region.– Hydrogeology Journal, pp. 1–12.
Gumbel, E.J. 1935: Les valeurs extremes des distributions statistiques [Extreme values of statistical distributions].–Annales de l’Institut Henri Poincaré, 5/2, pp. 115–158. (in French)
Hastenrath, S.L. 1968: Fourier analysis of Central American rainfall.–Archiv für Meteorologie, Geophysik und Bioklimatologie, B/16/1, pp. 81–94.
HCSO 2016: A meteorol ´ogiai megfigyelőállomások főbb adatai, 1985– [Major data of meteorological observatory stations, 1985–].–Hungarian Central Statistical Office StaDat Database. 5.10.4,https://
www.ksh.hu/docs/hun/xstadat/xstadat_eves/i_met002c.html. (in Hungarian)
HMS 2015: Éghajlati adatsorok 1901–2010 [Climate data series 1901–2010].–Hungarian Meteorological Service Online Database, http://www.met.hu/eghajlat/magyarorszag_eghajlata/eghajlati_adatsorok.
(in Hungarian)
Ilyés, C., E. Turai, P. Szucs 2015: A Nyírség csapadék id˝ ősorainak statisztikus és ciklikus jellemzőinek változása [Statistical and spectral analyzation of the precipitation time series of the Nyírség region].–In:
Bodzás, S. (Ed): Muszaki Tudomány az Észak-Kelet Magyarországi Régi´oban 2015. University of˝ Debrecen, Debrecen, pp. 392–397. (in Hungarian)
Ilyés, C., E. Turai, P. Szucs, J. Zsuga 2017: Examination of the cyclic properties of 110-year-long˝ precipitation time series.–Acta Montanistica Slovaca, 22/1, pp. 1–11.
Kovács, F., E. Turai 2014: Variation in the precipitation conditions of the Mátra–Bükkalja region and the development of a prognosis method.–ARPN Journal of Science and Technology, 4/8, pp. 526–540.
Kovács, J., B. Kiszely-Peres, J. Szalai, I. Kovács-Székely 2010: Periodicity in shallow groundwater levelfluctuation time series on the Trans-Tisza region, Hungary.–Acta Geographica ac Geologica et Meteorologica Debrecina, 4–5, pp. 65–70.
Kovács, J., P. Szab´o, J. Szalai 2004: Talajvízállás adatok idősoros vizsgálata a Duna-Tisza közén [Investi- gating the groundwater table time series of the area between the Danube and the Tisza rivers].– Vízügyi Közlemények, 86/3–4, pp. 607–624. (in Hungarian)
Liu, D., Q. Fu, Y. Ma, A. Sun 2009: Annual precipitation series wavelet analysis of well-irrigation area in Sanjiang Plain.–In: Li, D., Z. Chunjiang (Eds): Computer and Computing Technologies in Agriculture.
CCTA 2008. IFIP Advances in Information and Communication Technology, Springer, Boston, MA, II/1, 293, pp. 563–572.
Matyasovszky, I. 2015: Estimating spectra of unevenly spaced climatological time series.–Időjárás, 119/1, pp. 53–68.
Mesk´o, A. 1984: Digital Filtering.–Akadémia Press, Budapest, 635 p.
Mosteller, F., J.W. Tukey 1977: Data Analysis and Regression.–Addison-Wesley Publishing Company, Reading, 588 p.
Nason, G.P., R. von Sachs 1999: Wavelets in time series analysis.–Philosophical Transactions of the Royal Society A, 357, pp. 2511–2526.
Panter, F.P. 1965: Modulation, Noise and Spectral Analysis–Applied to Information Transmission.– McGraw-Hill Book Company, Oxford, 759 p.
Péczely, Gy. 1979: Magyarország éghajlati körzetei [Climate areas in Hungary].–In: Péczely, Gy. (Ed):
Éghajlattan (Climatology). Nemzeti Tankönyvkiad´o, Budapest, pp. 282–284. (in Hungarian) Sangdan, K. 2004: Wavelet analysis of precipitation variability in Northern California, U.S.A.–KSCE
Journal of Civil Engineering, 8/4, pp. 471–477.
Sen, A.K., Z. Kern 2016: Wavelet analysis of low-frequency variability in oak tree-ring chronologies from east Central Europe.–Open Geosciences, 8, pp. 478–483.
Szöllösi-Nagy, A. 2015: Water governance in the OSCE area–Increasing security and stability through co- operation.–Conference lecture, 23rd OSCE Economic and Environmental Forum, First Preparatory Meeting, 26–27 January 2015.
Turai, E. 1983: A Fourier transzformáci ´o egy numerikus m´odszerre és alkalmazása a GP-jelenség rendszerjellemzőfüggvénnyel történőleírásánál [A numerical method of the Fourier-transformation and its application to describe the IP-phenomenon with a system typical function].–Magyar Geofizika, 24/1, pp. 11–19. (in Hungarian)
Turai, E. 2005: Spektrális adat- és informáci´ofeldolgozás [Spectral Data and Information Processing].– University lecture notes, University of Miskolc, Miskolc, pp. 61–87. (in Hungarian)
Valipour, M. 2012a: Number of required observation data for rainfall forecasting according to the climate conditions.–American Journal of Scientific Research, 74, pp. 72–86.
Valipour, M. 2012b: Ability of Box-Jenkins models to estimate of reference potential evapotranspiration [A case study: Mehrabad synoptic station, Tehran, Iran].–IOSR Journal of Agriculture and Veterinary Science, 1/5, pp. 1–11.
Zheng, W., S. Shi, Z. Gong 2014: Evolution of growing season precipitation series in the west region of Heilongjiang Province based on wavelet analysis.–In: Li, D., Y. Chen (Eds): Computer and Computing Technologies in Agriculture VII. CCTA 2013. IFIP Advances in Information and Communication Technology, Springer, Berlin, Heidelberg, 419, pp. 25–31.