COMPARISON OF MULTIPLE FAN SYSTEM ASSEMBLIES USING AN ACOUSTICALLY
TRANSPARENT DUCT
Kristóf TOKAJI, Balázs SZEKER, Csaba HORVÁTH
Department of Fluid Mechanics, Faculty of Mechanical Engineering, Budapest University of Technology and Economics
4-6. Bertalan Lajos Street, Budapest, Hungary, H-1111
SUMMARY
This investigation presents the applicability of an acoustically transparent duct in the phased array microphone measurement of low pressure ducted turbomachinery using a freestanding phased array microphone system. Through the investigation of three simple yet distinctly different turbomachinery test cases, the investigation shows that the acoustically transparent duct can successfully be used for localizing and studying both rotating coherent as well as rotating incoherent noise sources. The three test cases (free-inlet ducted-outlet, inlet-cone ducted-outlet, and ducted-inlet ducted-outlet) are investigated from the pressure side of the ducted system, which is not possible without the help of the acoustically transparent duct.
INTRODUCTION
Fans are widely used for industrial as well as household applications. In many of these cases, for instance air conditioning or ventilation systems, the fans are built into ducted environments. The number of such applications surrounding us in our daily lives has increased with the advancement of technology, and therefore an eye needs to be kept on noise pollution levels, which need to be continuously reduced in order to meet the requirements of strict laws and regulations, as well as the demands of consumers. In order to do so, the noise generation mechanisms of fans need to be investigated, understood, and ultimately eliminated.
Phased array microphones and beamforming technology are often used in order to localize incoherent noise sources and determine the noise generation mechanisms of a multitude of intricate systems [1].
The technology is therefore often applied in the investigation of turbomachinery noise sources [2-8].
Beamforming maps, which are the result of the beamforming processing procedure, depict the
locations of the dominant noise sources, and examining these results one can determine the dominant noise generation mechanisms of the investigated turbomachinery. In this investigation the ROtating Source Identifier (ROSI) beamforming method was applied, which takes into consideration the motion of the turbomachinery elements [9]. Applying ROSI, the investigated blade sections can be looked at in a rotating frame of reference. In this way the noise sources on each individual blade can be investigated separately, providing beamforming maps that are able to separate apart the contribution of each blade/blade section to the noise field by accounting for moving sources.
In the case of ducted fans, such as the one investigated herein, acoustic investigations should be carried out in a ducted environment in order to guarantee the same flow conditions experienced under normal operation. The literature provides suggestions for using microphone arrays in the investigation of ducted systems [4, 10-13]. One approach could be to mount microphones on the wall of the duct [10, 12]. Such measurements run with many complications, including the disturbing effects of duct modes and flow induced microphone self-noise. While the flow induced microphone self-noise can be dealt with to some extent with the use of an appropriate surface treatment [14], the acoustic duct modes resulting from the ducted environment [15] greatly influence the results of the beamforming investigation, making it difficult to separate the various components of the noise in the measured microphone signals and trace them back to their source regions using conventional beamforming methods, even for the broadband noise sources [10, 16, 17]. Another approach would be to place the array of microphones outside of the flow, upstream or downstream of the duct, as in [4, 13]. While such methods can be applied for certain configurations, in order to gain direct access to the noise radiating from a ducted source, and in order to eliminate the effect of duct modes, one needs to use an Acoustically Transparent Duct (ATD) [7, 8]. An ATD is a hydrodynamically impenetrable duct section that can be used for transporting fluids, and which is designed to be acoustically transparent.
Such an ATD was designed and built by our research team, and has been shown to sufficiently allow through acoustic signals, making possible the beamforming investigation of ducted low speed fans for a wide frequency range, while providing a hydrodynamically impenetrable duct surface for the flow [7, 8]. In our design, which is more detailed in [8] for widespread application, a perforated duct section provides the ducts shape, while a layer of stretch film, characterized by low acoustic impedance, provides hydrodynamic impenetrability sufficient for use with low pressure fan systems.
In this investigation a few commonly occurring configurations, which can be built from a fan, the ATD, an inlet cone, and spiral wound duct sections (e.g. free-inlet ducted-outlet, inlet-cone ducted- outlet, and ducted-inlet ducted-outlet) are looked at. The various components of the configurations have differing effects on the flow, and therefore also on the acoustic characteristics. The examination and comparison of the various cases helps to define the effect of each component on the noise generation mechanisms of the fan. Prior to the use of an ATD, only those configurations could be investigated with freestanding microphone arrays which were open to the surroundings, making it possible to look at the rotor from upstream or downstream locations [2, 3, 18]. In this, the first investigation of a fan system using the ATD, the focus is on showing some basic differences between a free-inlet system, one equipped with an inlet-cone, and one which has a ducted-inlet. In doing this, it is shown that the ATD can be applied in freestanding phased array microphone investigations of ducted turbomachinery systems.
MEASUREMENTS
As stated in the introduction, the goal of the measurement process presented here is to determine the effect of various duct system components, such as an inlet-cone, free-inlet or a ducted-inlet on the noise generation of a fan. The fan under investigation is an industrial axial flow fan, which can be characterized by a relatively small pressure rise and pressure fluctuations. It is a rotor-only configuration, having five forward-skewed blades, built into a short duct with the help of a single strut which spans the diameter of the duct. The fan has a diameter of 300 mm, a hub-to-tip ratio of
0.30, a tip clearance (relative to the span) of 0.066, and can be rotated with a maximum rotational speed of 1430 rpm, resulting in a global flow coefficient (annulus area-averaged axial velocity normalized by blade tip velocity) of 0.316. As this fan has been the subject of multiple case studies, its geometrical, aerodynamic, as well as acoustic properties are well documented [3, 5, 6]. In order to better understand the differences in noise generation between the three investigated test cases, microphone array measurements were carried out with the help of the ATD. During the measurements an OptiNav Array 24 phased array microphone system was used, which consist of 24 microphones built into a planar array that has an aperture of 0.7 m [19], and is available at the department. This array was used, since one of the goals of this investigation was to develop a method for use with the existing array. On the other hand, the authors would like to bring to the reader’s attention, that other array geometries, such as a cylindrical distribution, might be more advantageous.
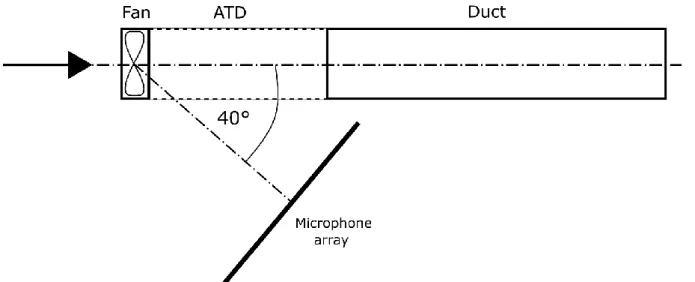
Earlier studies of the fan under investigation here applied a viewing angle of 0°, which means that the axis of the microphone array was parallel with the axis of the fan. These investigations concentrated on the noise of an inlet-cone free-outlet fan system [2]. This viewing angle setting cannot be applied when measuring the case of a fan with a ducted system due to geometric constraints, and therefore a larger viewing angle had to be used here. According to earlier investigations carried out on the ATD, which evaluated the applicability of the ATD in phased array microphone investigations of ducted flow systems, a viewing angle of 40° was found to be appropriate for the investigation of basic noise sources located within the duct [7, 8]. Multiple test configurations were investigated here, consistently placing the microphone array 1 m from the fan at an angle of 40°, looking at the fan through the ATD. The measurements were carried out in a non-anechoic environment, taking advantage of the properties of beamforming technology, which filters out the disturbing effects of the background noise and reflections, making possible the investigation of the noise sources in an investigation plane. In our case this plane was chosen to be the plane which is perpendicular to the axis of the fan and hence passing through all the fan blades. In the beamforming map results presented below, this plane is looked at from the downstream direction. In order to investigate a wide frequency range, a sampling rate of 44 kHz was used for 20 seconds. During the processing of the data, a correction for the moving medium was not included in the calculations, since the flow velocity was relatively small, and therefore the effect on the results was minimal, but the reader should be aware that for higher flow velocities, these corrections should be included.
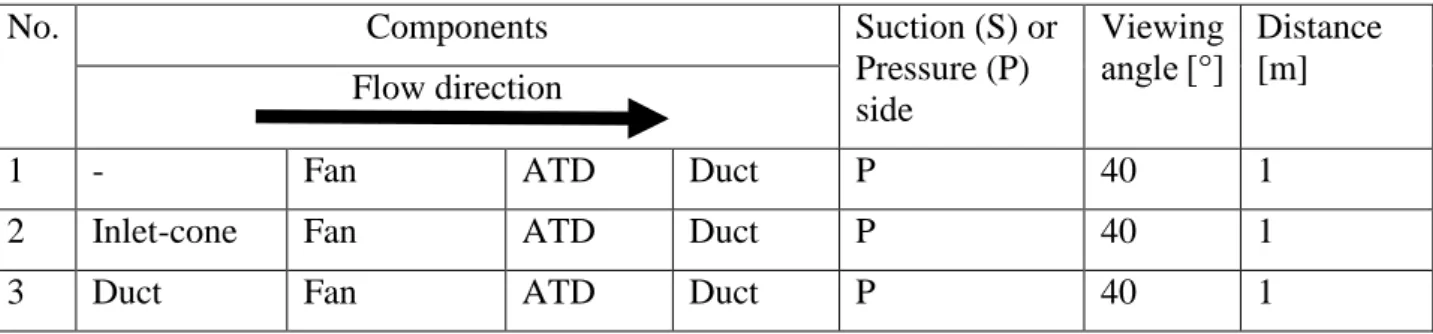
Table 1. The investigated configurations
No. Components Suction (S) or
Pressure (P) side
Viewing angle [°]
Distance Flow direction [m]
1 - Fan ATD Duct P 40 1
2 Inlet-cone Fan ATD Duct P 40 1
3 Duct Fan ATD Duct P 40 1
Table 1. summarizes the test configurations investigated here. The system consist of the following components: two spiral wound duct sections having a diameter of 0.4 m and a length of 3 m, the ATD which has a diameter of 0.4 m and a length of 1 m, an inlet-cone, and the investigated fan. The measurements were carried out for multiple rotational speeds between 560 and 1400 rpm, but only the results of the investigations carried out at a rotational speed of 1400 rpm are presented and evaluated here.
The following figures present the test configurations that were looked at. Figure 1. presents the free- inlet ducted-outlet configuration and Figure 2. presents the inlet-cone ducted-outlet configurations as they were looked at from the pressure side. It can be seen that the investigation of these two cases does not necessitate the use of the ATD if one were to conduct the investigations from the suction
side. The third test case presented in Figure 3., on the other hand, shows the ducted-inlet ducted-outlet configuration, which can only be investigated with the help of the ATD. These three configurations will be compared for measurements conducted on the pressure side. As can be seen in the figures, the ATD has made it possible to compare the noise generation mechanisms on the pressure side of a ducted fan for multiple inlet configurations (free-inlet, inlet-cone, and ducted-inlet).
Figure 1. Measurement setup of the free-inlet ducted-outlet configuration, as investigated from the pressure side.
Figure 2. Measurement setup of the inlet-cone ducted-outlet configuration, as investigated from the pressure side.
Figure 3. Measurement setup of the ducted-inlet ducted-outlet configuration, as investigated from the pressure side.
RESULTS
In this investigation the pressure side of a fan was investigated, which connects to a ducted system via the ATD, as seen in Figures 1-3. The ROSI beamforming algorithm was used to generate beamforming maps and spectra were created from the BeamForming peak (BFpeak) values, the levels of the largest noise sources located in each frequency bin.
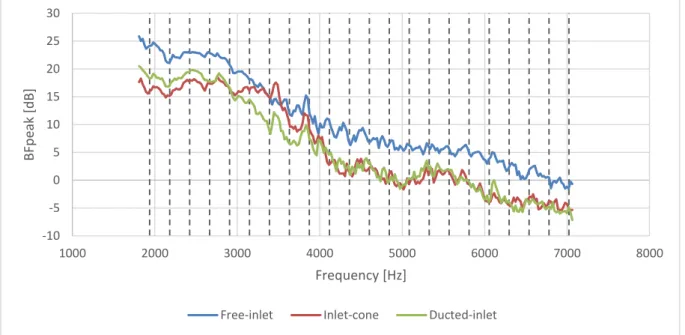
In general, beamforming methods have a difficulty localizing coherent noise sources, and hence also rotating coherent noise sources, which are common in turbomachinery applications. Rotating coherent noise sources are not localized to their true locations, but rather to their Mach radii, as described in the literature [20, 21]. Mach radius refers to the radial position at which the lobes of the investigated azimuthal modes spin around the axis at the speed of sound. For axial modes, which have zero azimuthal lobes and hence a Mach radius of 0, the noise sources will be localized to the axis, as seen in [21]. Taking this into consideration, and combining it with order analysis, frequency values can be determined for which the rotating coherent noise sources expected on the beamforming maps will be localized to the axis of the fan. The frequencies at which the beamforming maps are affected by these rotating coherent noise sources are shown in Figure 4. using dashed lines. The rotating coherent noise sources are not dealt with in greater detail in this paper, but the presence of the noise sources localized to their Mach radii at these frequencies suggests that the noise field which has passed through the ATD is quite similar to the noise field expected for the free field flow environment, which is the main goal of the ATD design.
Figure 4. The BFpeak spectra of the three test cases, marking the frequency values for which the rotating coherent noise sources are localized to their Mach radii, which in this case is on the axis of the fan
Leaving out of consideration those frequency bins in which rotating coherent noise sources are localized to the Mach radius on the axis, the rest of the frequency bins were investigated and separated into intervals according to trends seen in the BFpeak spectra and the beamforming maps. As described above, all three of the configurations investigated here are measured from the pressure side of the system with the help of the ATD. Therefore, any differences experienced between the three cases are associated with discrepancies in the inlet flow fields resulting from differing inlet geometries.
Sketches of the velocity profiles for the three inlet geometries are provided in Figure 5. For the free- inlet geometry, the flow near the inlet cross-section will be separated from the wall, as the pressure difference driving the flow sucks air into the pipe from all directions without anything to guide the flow. As the operating point of the fan is the same for all three test configurations examined here, the volume flow rate passing through the system will be approximately the same in all three cases. The
-10 -5 0 5 10 15 20 25 30
1000 2000 3000 4000 5000 6000 7000 8000
BFpeak [dB]
Frequency [Hz]
Free-inlet Inlet-cone Ducted-inlet
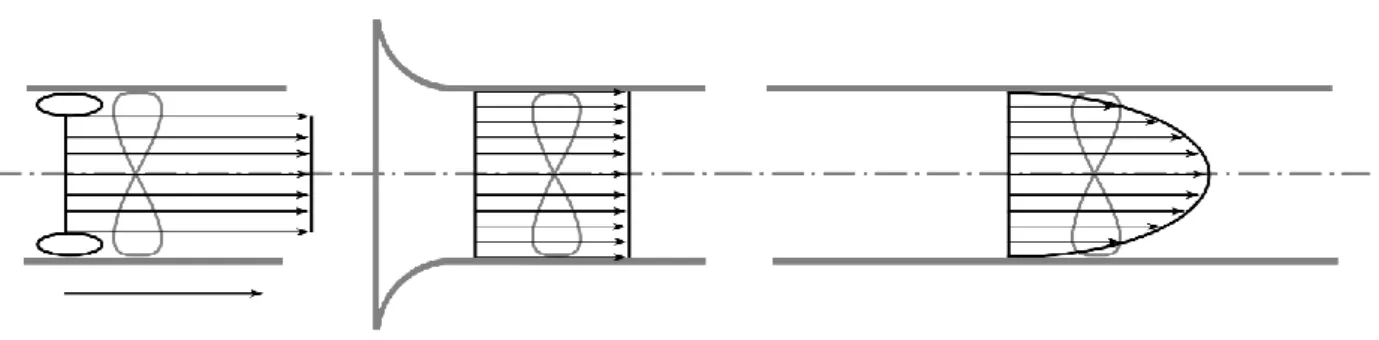
velocity profile experienced for the free-inlet case will therefore have a near zero value in the vicinity of the wall (separation zone) and a very large value across a smaller diameter (mass flow rate is constant). The inlet-cone used in the second test configuration guides the fluid into the duct, providing a smooth transition, and hence avoiding the development of separation zones. The flow will therefore fill the entire cross-section and the boundary layer will not have time to fully develop before reaching the fan (will be very thin). The flow field can therefore be approximated by a top-hat velocity distribution. Farther downstream the boundary layer effect will be evident as a fully developed velocity profile will be experienced in the duct. This is the case for the ducted-inlet configuration, for which the flow approaching the fan can be characterized by a laminar or turbulent velocity profile.
Comparing the magnitudes of the velocities experienced in the three cases, the maximum velocity of the free-inlet case will be the largest. As compared to this, assuming the same mass flow rate, the maximum velocity magnitude for the inlet-cone case will be significantly smaller, but will have the largest near wall velocity magnitude from among the three cases. The ducted-inlet case will have a maximum velocity somewhere between that of the other two cases along the axis, and will have moderate velocities closer to the wall.
Figure 5. Velocity profiles expected for the three inlet geometries: free-inlet (left side), inlet-cone (middle), and ducted- inlet (right side).
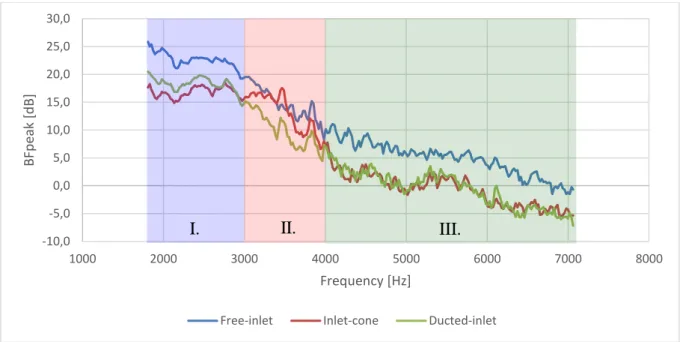
Investigating the effects of the inlet geometries on the rotating incoherent noise sources (in most cases broadband noise sources) of the fan with the help of the beamforming maps and the BFpeak spectra, the frequency range under investigation has initially been split into three larger intervals. These intervals can be seen in the Figure 6., which provides the BFpeak spectra of all three test cases in one diagram, marking the three intervals with roman numerals I-III. In first of all drawing general conclusions from the three spectra, it can be stated that the highest BFpeak values are characteristically associated with the free-inlet test case, which runs approximately parallel to the other two cases, but has a level which is approximately 7 dB higher. In this case, there are no guide vanes on the inlet side for directing the flow and preventing the appearance of separation bubbles and turbulent structures. The turbulence generated at the inlet and the locally increased flow velocities result in louder noise sources along the entire frequency range under investigation.
Examining interval I. in Figure 6., below approximately 3000 Hz, the case with the free-inlet has the largest BFpeak values and the case with the inlet-cone has the smallest BFpeak values, while the one with the ducted-inlet sits between the other two. Though different in magnitude, it can be seen that the three spectra run approximately parallel to one another. This suggests that though the levels are different for the three cases, the noise generation mechanism is the same for all three cases.
Interval II. is located between approximately 3000 and 4000 Hz. In this interval, the three curves differ from one another. There are smaller sections along which certain pairs of curves appear to be similar, but in general it can be stated that the three curves differ. The character of the case with the inlet-cone is most distinctly different from the other two. It is therefore expected that the noise sources of the case with the inlet-cone will differ significantly from the other two.
In interval III., above 4 kHz, the two graphs of the case with the inlet-cone and the case with the ducted-inlet are once again quite similar in character. The two curves are overlapping along a
relatively large frequency range. The graph of the case with the free-inlet has significantly higher levels than the other two cases.
Figure 6. BFpeak spectra of the three test cases, showing the three intervals investigated separately herein
In order to understand the differences seen in the spectra of the BFpeak, one must also investigate the beamforming maps, as they provide a significant amount of information regarding the noise generation mechanism, as they localize the dominant noise sources of the investigated frequency range to areas along the blade surface. Beamforming maps show the BeamForming Levels (BFL) for a few decibels down from the peak level for the investigated frequency bin of the investigated test case. Keep in mind that these are not sound pressure levels or sound power levels, and should therefore only be compared qualitatively in order to investigate differences between the various test configurations. In the following figures, typical narrowband (bandwidth of 21.5 Hz) beamforming maps are shown for the three intervals. Though the beamforming maps are typical for the investigated intervals, they might not always show all 5 blades very clearly, but the reader should rest assured that there were frequency bins in which the other blades were better seen and vice versa. Third-octave band results from the investigation are not presented as representative for a larger frequency range, since the Mach radius noise sources localized to the axis dominate the figures and therefore provide a false impression for the reader. This is also avoided since the three intervals under investigation do not fall in distinct third-octave bands, and therefore typical noise sources from multiple zones will appear in a single third-octave band, distorting the results.
-10,0 -5,0 0,0 5,0 10,0 15,0 20,0 25,0 30,0
1000 2000 3000 4000 5000 6000 7000 8000
BFpeak [dB]
Frequency [Hz]
Free-inlet Inlet-cone Ducted-inlet
I. II. III.
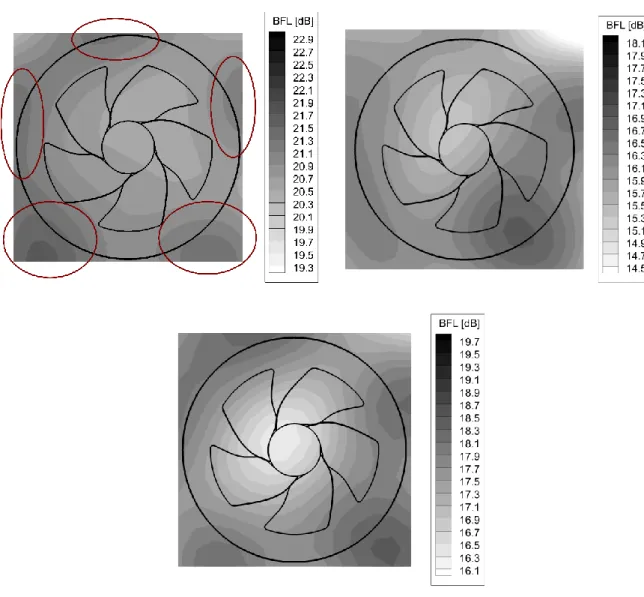
Figure 7. The beamforming maps of the investigated cases at the center frequency of 2476.3 Hz, and a bandwidth of 21.5Hz (top left: free-inlet, top right: inlet-cone, bottom: ducted-inlet
Figure 7. shows typical beamforming maps for the three investigated cases for interval I. for the frequency band having a center frequency of 2476.3 Hz. As described above, the three beamforming peak spectra seem to run parallel, and therefore the noise generation mechanism is expected to be similar in all three cases. The beamforming maps show us that the dominant noise sources are localized to the blade tip region in all three cases. The periodically repeating dominant noise source is marked on each blade for the free-inlet case. These same noise sources can be found on the other two beamforming maps as well, but with different amplitudes. It can be seen that the noise sources appear to be even farther out than the blade tip. Keep in mind that the investigation was carried out from a viewing angle, but presented as seen from downstream. The noise source is therefore localized to the blade tip gap area in the near vicinity of the wall. Here many things influence the results. First of all, the combination of the viewing angle and the presence of the wall, which reflects the noise, distort the noise source location. The noise source is also of a relatively small frequency, the noise sources of which will be relatively large, and here only the peak of those noise sources are highlighted on the beamforming maps (the delta between the levels is very small in order to highlight the five noise sources associated with the five blades). The beamforming maps are very similar, only differing in amplitude. Without investigating the blade tip region aerodynamics and the resulting differences in flow in greater detail, it can be concluded that the inflow turbulence resulting from the free-inlet geometry results in larger amplitude low frequency noise sources in the blade tip region as compared to the other two cases.
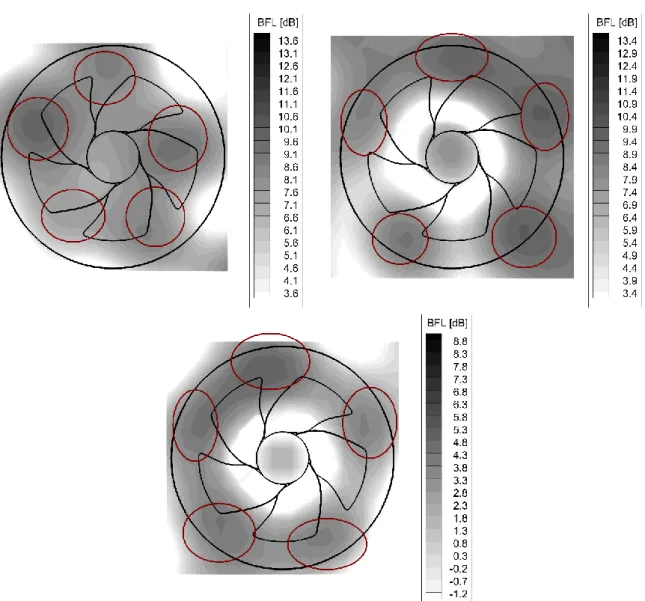
Figure 8. The beamforming maps of the investigated cases at the frequency of 3531.4 Hz, and a bandwidth of 21.5Hz (top left: free-inlet, top right: inlet-cone, bottom: ducted-inlet
In Figure 8., the beamforming maps for a center frequency of 3531.4 Hz are shown, which is presented as representative of interval II. As discussed above, the three BFpeak curves are all distinct, indicating that the noise generation mechanisms are most likely distinct in the three cases. According to Figure 8. the most dominant noise sources of the case with the inlet-cone and the case with the ducted-inlet are localized to the blade tip region (marked on the figures), similar to that seen for interval I. The main difference between the two cases is that the levels for the case with the inlet-cone are much larger than the case with the ducted-inlet. Comparing the velocity profiles of the two cases, the velocity amplitude of the case with the inlet-cone will be larger in the blade tip region, being larger than that for the case of the free-inlet as well. Investigating the dominant noise sources of the free-inlet case, it can be seen that the dominant noise sources are located at a lower radial position (marked in the figure). Examining the velocity profile of this case, it can be seen that it can be characterized by large velocity amplitudes at small radial positions. In summarizing what has been found, the noise sources in interval II. are strongly influenced by the velocity profile approaching the fan. When the velocity profile is similar to that expected for a fully developed pipe flow, then the noise sources will have their smallest amplitudes, with the blade tip noise sources having the largest values, as seen for interval I. When the inlet-cone is used for measuring the fan which was designed for ducted flow, the large velocities near the blade tip will result in larger noise sources in the blade tip region. When the velocity components at lower radial positions are large, the same will happen at lower radial positions, ergo large noise sources will appear at lower radial positions for the case of the free-inlet configuration.
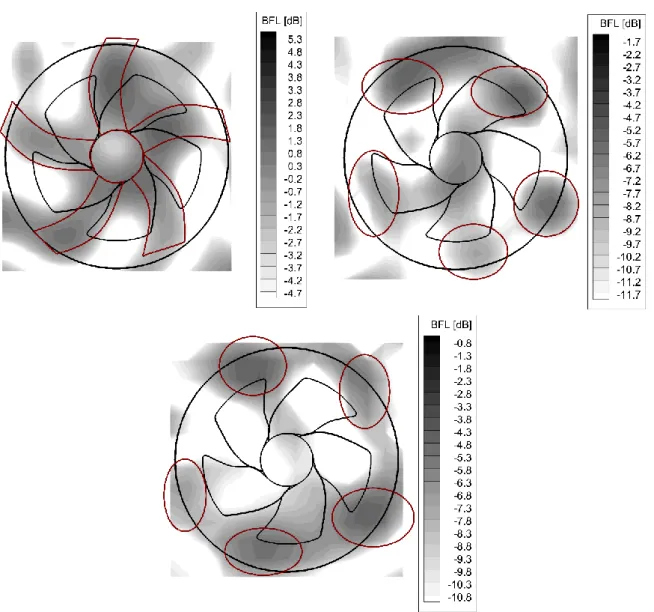
The typical beamforming maps for interval III. are presented in Figure 9. for a center frequency of 5017.2 Hz. In this frequency interval the effect of the upstream turbulence is dominant. Therefore, the amplitudes of the cases with the inlet-cone and ducted-inlet are similar, while the case with the free-inlet results in larger amplitudes. This was seen in the investigation of the BFpeak spectra, where the spectra of the case with the inlet-cone and the case with the ducted-inlet lie on top of one another.
The third case, the one with the free-inlet, on the other hand can be characterized by larger amplitudes.
Investigating the beamforming maps for the three cases, this can be confirmed. The noise sources of the cases for the inlet-cone and the ducted-inlet are very similar. The noise sources are concentrated to the blade tip regions as in interval I. (marked in the Figure 9.). The noise sources of the case with the free-inlet on the other hand are typically concentrated all along the span of the blades.
Figure 9. The beamforming maps of the investigated cases at the frequency of 5017.2 Hz, and a bandwidth of 21.5Hz (top left: free-inlet, top right: inlet-cone, bottom: ducted-inlet
CONCLUSION
The noise generation of a ducted low pressure axial fan was investigated from the pressure side for three test configuration using an ATD. The effects of a free-inlet, an inlet-cone, and a ducted-inlet were investigated. The results of the microphone array measurements were processed using the ROtating Source Identifier beamforming method. According to the BFpeak results and beamforming maps, the investigated frequency range was split into three intervals. The dominant noise sources were compared and localized accordingly. It was found that the differences between the velocity profiles result in deviations in the beamforming maps and their levels. The goal of this investigation and therefore the most significant outcome which can be concluded from the results is that the investigation of ducted turbomachinery noise sources using a freestanding microphone array and an ATD is possible. The results show that even relatively small differences in the noise generation mechanisms can be determined with this measurement setup. Future investigations will focus on understanding the noise sources of ducted turbomachinery in greater detail and on further developing the ATD for the investigation of high pressure systems.
ACKNOWLEDGEMENTS
The present investigation was supported by the Hungarian National Research, Development and Innovation Center under contract Nos. K 119943 and the János Bolyai Research Scholarship of the Hungarian Academy of Sciences, and the Körös Campus Foundation. The work relates to the scientific programs “Development of quality-oriented and harmonized R+D+I strategy and the functional model at BME” (Project ID: TÁMOP-4.2.1/B-09/1/KMR-2010-0002) and “Talent care and cultivation in the scientific workshops of BME” (Project ID: TÁMOP-4.2.2/B-10/1-2010-0009).
BIBLIOGRAPHY
[1] T. J. Mueller, Aeroacoustic Measurements, Berlin: Springer–Verlag, pp. 62–97, 2002
[2] T. Benedek, J. Vad – An industrial onsite methodology for combined acoustic-aerodynamic diagnostics of axial fans, involving the phased array microphone technique. International Journal of Aeroacoustics, 15(1-2): 81-102, 2016
[3] T. Benedek, J. Vad – Study on the effect of inlet geometry on the noise of an axial fan, with involvement of the phased array microphone technique, In: Proceedings of ASME Turbo Expo, Seul, South Korea, paper no. GT2016-57772, June 2016
[4] B. Tóth and J. Vad – Challenges in evaluating beamforming measurements on an industrial jet fan, In Proceedings of Conference on Modelling Fluid Flow, 186, 2015
[5] T. Benedek, J. Vad – Concerted aerodynamic and acoustic diagnostics of an axial flow industrial fan, involving the phased array microphone technique. ASME Turbo Expo, Düsseldorf, Germany, paper no. GT2014-25916, June 2014
[6] T. Benedek, J. Vad – Spatially resolved acoustic and aerodynamic studies upstream and down- stream of an industrial axial fan with involvement of the phased array microphone technique. In:
Proceedings of 11th European conference on turbomachinery fluid dynamics and thermodynamics, Madrid, Spain, paper no. 128, 2015
[7] K. Tokaji, Cs. Horváth – Acoustically transparent duct. Presentation on 21st Workshop of the Aeroacoustics Specialists Committee of the CEAS, 13-15 September 2017
[8] K. Tokaji, Cs. Horváth – Acoustically transparent duct. International Journal of Aeroacoustics, 2018, Accepted for publication
[9] P Sijtsma, S. Oerlemans, H. Holthusen – Location of rotating sources by phased array measurements. In: Proceedings of the 7th AIAA/CEAS Aeroacoustics Conference, Maastricht, Netherlands, paper no. AIAA 2001-2167, May 2001
[10] R. P. Dougherty, B. E. Walker, D. L. Sutliff – Locating and Quantifying Broadband Fan Sources Using In-Duct Microphones, In 16th AIAA/CEAS Aeroacoustics Conference, Stockholm, Sweden, paper no. AIAA–2010–3736, June 2010
[11] D. L. Sutliff. Turbofan duct mode measurements using a continuously rotating microphone rake.
International Journal of Aeroacoustics, 6(2): 147-170, 2007
[12] Y-H. Heo, J-G. Ih, H. Bodén – In-duct identification of a rotating sound source with high spatial resolution, Journal of Sound and Vibration, 357: 51-73, 2015
[13] G. G. Podboy, Cs. Horváth – Phased Array Noise Source Localization Measurements made on a Williams International FJ44 Engine, In 15th AIAA/CEAS Aeroacoustics Conference (30th AIAA Aeroacoustics Conference), Miami, Florida, paper no. AIAA 2009-3183, May 2009 [14] S. M. Jaeger, W. C. Horne, C. S. Allen – Effect of Surface Treatment on Array Microphone Self-
Noise, In AIAA/CEAS Aeroacoustics Conference, paper no. AIAA-2000-1937, June 2000 [15] J. M. Tyler, T. G. Sofrin – Axial Flow Compressor Noise, SAE Rechnical Paper, doi:
10.4271/620532, 1962
[16] T. Benedek, P. Tóth – Beamforming measurements of an axial fan in an industrial environment.
Periodica Polytechnica Mechanical Engineering, 57(2): 37-46, 2013
[17] C. R. Lowis, P. F. Joseph – Determining the strength of rotating broadband sources in ducts by inverse methods. Journal of Sound and Vibration, 295(3-5): 614-632, 2006
[18] G. G. Podboy, Cs. Horváth – Phased Array Noise Source Localization Measurements made on a Williams International FJ44 Engine. In 15th AIAA/CEAS Aeroacoustics Conference (30th AIAA Aeroacoustics Conference), Miami, Florida, paper no. AIAA 2009-3183, May 2009 [19] Optinav Inc., Phased Array 24, http://www.optinav.info/Array-24.htm.
[20] Cs. Horváth, E. Envia, G. G. Podboy – Limitations of Phased Array Beamforming in Open Rotor Noise Source Imaging. AIAA Journal 52(8) 1810-1817, 2014
[21] Cs. Horváth, B. Tóth, P. Tóth, T. Benedek, J. Vad – Reevaluating Noise Sources Appearing on the Axis for Beamforming Maps of Rotating Sources. Proceedings of the Fan Conference, Lyon, France, 15–17 April 2015