Conference on Modelling Fluid Flow (CMFF’18) The 17th International Conference on Fluid Flow Technologies Budapest, Hungary, September 4-7, 2018
I NVESTIGATION OF THE NOISE SOURCES OF A PYLON
Kristóf TOKAJI
1, Bence FENYVESI
2, Bálint KOCSIS
3, Csaba HORVÁTH
41 Corresponding Author. Department of Fluid Mechanics, Faculty of Mechanical Engineering, Budapest University of Technology and Economics. Bertalan Lajos u. 4 – 6, H-1111 Budapest, Hungary. Tel.: +36 1 463 2546, Fax: +36 1 463 3464, E-mail: tokaji@ara.bme.hu
2 Department of Fluid Mechanics, Faculty of Mechanical Engineering, Budapest University of Technology and Economics. E-mail:
fenyvesi@ara.bme.hu
3 Department of Fluid Mechanics, Faculty of Mechanical Engineering, Budapest University of Technology and Economics. E-mail:
balint.kocsis@gmail.com
4 Department of Fluid Mechanics, Faculty of Mechanical Engineering, Budapest University of Technology and Economics. E-mail:
horvath@ara.bme.hu
ABSTRACT
Counter-Rotating Open Rotors (CROR) are an attractive alternative to turbofans, due to their advantageous propulsive efficiencies. However, prior to their widespread application their noise levels need to be decreased in order to meet the requirements of strict laws and regulations.
Mounting methods – a streamlined pylon, for instance – could have significant effects on the noise generation mechanisms. Earlier research has shown that a pylon can have a large effect on the noise of CROR at blade passing frequencies, as a result of the wake of the pylon interacting with the rotating blade sets. However, these studies were focused only on the noise generation mechanisms of the rotors in the presence of a pylon, and not the noise of the pylon itself. In the research presented herein a phased array microphone system combined with beamforming technology has been used to investigate the noise associated with the pylon itself. The blades of the front and the aft rotors were therefore removed during the investigation. Beamforming maps were created in order to localize the dominant noise sources of the setup and were investigated together with the spectral results. In future beamforming investigations, the method presented herein can be used to separate the contribution of the pylon self- noise from the total noise of an installed CROR.
Keywords: beamforming, counter rotating open rotor, noise source localization, phased array microphone, pylon
NOMENCLATURE
𝑒 [-] phase correction vector
𝑃 [Pa] Fourier transformed acoustic pressure signal
𝑅 [-] cross spectral density matrix
𝑆 [-] beamforming level matrix 𝑊 [-] amplitude correction matrix X, Y [-] harmonic indices
𝜔 [rad/s] angular frequency Subscripts and Superscripts
∗ complex conjugate A aft rotor
BFL BeamForming Level BFpeak BeamForming Peak BPF Blade Passing Frequency CROR Counter Rotating Open Rotor CSM Cross Spectral Matrix F forward rotor
FDBF Frequency Domain BeamForming ℋ conjugate transpose of a vector 𝑚 number of the microphones PSD Power Spectral Density ROI Region Of Interest
1. INTRODUCTION
During the oil crisis of the 1970s, increased fuel prices motivated the aircraft industry to develop engine systems which would be more efficient, resulting in the launch of numerous research programs [1-3]. Some of these programs worked on Counter Rotating Open Rotors (CROR), which showed potential in reducing fuel consumption [1-3].
After the end of the crisis, the interest in funding CROR research programs diminished, and many of the difficulties associated with the technology remained unresolved. Nowadays, competition between manufacturers, aiming to cut back expenses, moreover, a commitment to sustainable development and environmental protection have led to a renewed interest in increasing propulsive efficiency. As a result, research programs focusing on CROR technology have been reinitiated since 2000.
As mentioned above, CROR aircraft engines have issues associated with them, which must be resolved prior to their widespread application. One of these issues is their excessive noise emission, since airline companies have to meet the requirements of stringent noise pollution laws and regulations, which can be a challenging task, since the two unducted rotors have no acoustic shielding around them.
In order to lower the noise emission of the engine, the noise generation mechanisms need to be localized and studied. By using microphone array measurements together with beamforming technology, the noise sources of a CROR can be localized. Using this technology, beamforming maps are created which provide information regarding the amplitudes and the locations of the dominant noise sources of the investigated phenomena. By thoroughly examining these beamforming maps, the noise generation mechanisms can be identified and methods for reducing or eliminating the effects of these noise sources can be studied.
An important aspect regarding the practical application of CROR systems is the dependence of their noise levels on the method by which the engines are mounted on an aircraft. A common installation method is to attach the engines to the wings or the body of the aircraft with the help of pylons. While the aerodynamic design of such supporting structures is already a challenge [4-6], the pylon also influences the noise levels of a CROR during operation. In the literature, studies investigating the effects of the pylon on the noise generation of a CROR have been presented in [2, 7-13]. However, the self-noise generation mechanisms of such a supporting structure were not examined separately. In this paper, CROR data sets from a measurement campaign are examined in order to gain insight into the self-noise of a pylon. Therefore, the measurement setup examined here is comprised of the pylon and the centrebody of the CROR configuration without the rotating blades.
1.1. Noise source localization using beamforming technology
A phased array microphone system consists of numerous microphones which simultaneously record acoustic signals. By processing the data with the help of beamforming technology, the dominant noise sources of an investigated test case can be localized on a given plane or in space. As compared to a reference microphone position, the microphones of the array are located at various distances from any investigated potential source position. Therefore, the acoustic waves generated in that particular investigation point would have to travel various distances in order to reach each microphone, resulting in differing amplitude reductions and time delays for each recorded microphone signal. As the geometry of the measurement equipment is known,
the locations of the measurement points are also known, and these differences in amplitude and time can be corrected for, and the signals recorded on the various channels can be compared to see whether they are the same or not. If the signals agree, then the noise source is truly located in the investigated point.
The method for carrying out these corrections and comparisons is known as beamforming.
In this article Frequency Domain BeamForming (FDBF) [14] was used for processing the data. This method can determine the level of the generated noise in the investigated point from the corrected signals. This method operates in the frequency domain and thus requires the Fourier transforms of the recorded signals as input. Beamforming is individually carried out for each investigated point and frequency bin. Applying FDBF, the investigation points with real noise sources in a given frequency bin will have large BeamForming Levels (BFL), while points without noise sources will have small BFL. Eq. (1) shows the most essential formula of the process. 𝑃(𝜔) is the Fourier transform of the sound pressure signal, which is a function of the angular frequency 𝜔, 𝑊 is the amplitude correction, and 𝑒(𝜔) is the phase correction. 𝑆(𝜔) marks the BFL value of the investigated grid points of the investigation plane. The index ∗ refers to the complex conjugate and ℋ to the conjugate transpose.
𝑆(𝜔) = 𝑒ℋ(𝜔)𝑊 𝑃ℋ(𝜔)𝑃(𝜔) 𝑊ℋ𝑒(𝜔) (1)
The Cross Spectral Matrix (CSM) of the measured signal can be created by multiplying the Fourier transformed signal of the microphones by the conjugate transpose (see Eq. (2)), hence the formula of Eq. (1) can be rewritten in the form shown in Eq.
(3).
𝑅 = 𝑃ℋ(𝜔)𝑃(𝜔) (2) 𝑆(𝜔) = 𝑒ℋ𝑊 𝑅 𝑊ℋ𝑒 (3)
Calculating the BFL of each grid point, the one having the largest value on each beamforming map can be localized. This will be referred to as the BeamForming peak (BFpeak). The BFpeak provides the location of the most dominant noise source on the investigation plane, which is of help in identifying the noise generation mechanisms of the sources for the investigated frequency bins.
1.2. Noise of a CROR with an installed pylon
The noise sources of CROR consist of coherent and incoherent noise sources. Coherent noise sources are characterized by a time invariant phase relationship and most often appear in narrow
frequency bands at frequencies which are related to the Blade Passing Frequencies (BPF).
In the case of a CROR with an installed pylon, coherent noise sources can be divided into two subgroups, rotating and stationary. Rotating coherent noise sources are localized to apparent noise source locations instead of their true noise source positions.
These apparent noise source locations are at special radial distances from the rotor axis, called Mach radii. The Mach radius concept is discussed in detail in [10, 15-16]. A subset of rotating coherent noise sources are interaction tones, which are generated by the interaction of the Forward (F) and the Aft (A) rotors. Their specific frequencies result from combinations of the BPF of the forward and aft blade rows, and can be calculated as XBPFF + YBPFA, where X and Y are positive integers. Another subset of rotating coherent noise sources are BPF tones, which appear at XBPFF or YBPFA frequency values.
The second subgroup of coherent noise sources are stationary coherent noise sources, which in this case are generated as a result of the interaction between the wake of the pylon and the rotating blades. This category will be referred to as blade- wake interaction tones. These noise sources appear in the same frequency bins as BPF tones, but are localized to the blade surfaces which are directly in the wake of the installed pylon.
Incoherent noise sources can also be divided into rotating and stationary subgroups. Rotating incoherent CROR noise sources are for the most part generated by two noise generation mechanisms. The first is associated with the blade-to-blade inconsistencies of a given blade row. The noise sources in this subset will be referred to as shaft order noise sources. These noise sources are associated with rotating broadband noise generation mechanisms located on select blades, but since the observer is not able to move together with the blades, these noise sources only appear within the viewing angle of the observer for short durations of time, repeating with every revolution and are therefore associated with narrowband peaks in the spectrum at multiples of the once-per-revolution frequency [12].
Within the subgroup of rotating incoherent noise sources can be found a second group consisting of rotating broadband noise sources. These differ from shaft order noise sources in that they appear on all the blades in a given blade row and not just on select blades. As a result of this difference, these noise sources are characterized by a much broader frequency range.
The other subgroup of incoherent noise sources is that of stationary broadband noise sources, which also appear along a wide frequency range of the spectrum. Typical stationary broadband noise sources can be localized to the surfaces of stationary objects in the flow, such as the self-noise of the pylon, as will be seen later on. In Figure 1 a summary
of the typical noise source categories of an installed CROR with a pylon can be seen.
Figure 1. Investigated CROR noise source categories
Figure 2. The BFpeak PSD of an installed CROR with a pylon
Blade-wake interaction tones were introduced above in the category of stationary coherent noise sources. Earlier investigations have shown that these are significant noise sources in the case of installed CROR with a pylon [12]. Figure 2 shows results from the investigation in [12], where the noise sources were sorted into the categories described above. The Power Spectral Density (PSD) spectrum of the BFpeak values is provided herein. In the figure the frequency values are divided by the BPFA
frequency in order to provide the diagram in dimensionless form. It can be seen that many of the largest peaks are associated with the blade-wake interaction tones. Since the noise sources in the frequency bins of the BPF usually have smaller amplitudes for test cases without a pylon as compared to the installed case, and the amplitudes of BPF tones resulting from rotating coherent noise sources drop off very quickly with increasing frequency, it can be stated that the pylon has a large effect on the noise generation mechanisms of CROR [12]. On the other hand, no information is provided
20 40 60 80 100
0 2 4 6 8
Frequency / BPFA[ - ] Blade-wake interaction tones Rotating coherent noise sources Shaft order tones
Rotating broadband noise source BFpeak PSD
[ dB / Hz ]
in Fig. 2 or [12] regarding the contribution of the pylon self-noise to the BFpeak PSD spectrum. The noise sources localized to the pylon can contribute to the noise levels of an installed CROR system since the pylon can be considered as a stationary streamlined blade in the flow, which can generate broadband self-noise. Therefore, this type of noise source needs to be examined in order to determine its contribution to the noise levels and in order to have a comprehensive understanding of the noise generation mechanisms of an installed CROR with a pylon. It should not be forgotten though that in the case of an installed CROR with an angle-of-attack of zero degrees the noise sources localized to the pylon surface are most likely insignificant as compared to the other noise sources.
2. MEASUREMENT SETUP
Acoustic measurements were carried out in the NASA Glenn Research Center 9 × 15 ft Low-Speed Wind Tunnel, mounting the investigated rotors on the Open Rotor Propulsion Rig in order to investigate the noise of CROR configurations [15, 16]. The blades under investigation are the F31/A31 historical baseline blade set [17]. The forward blade row of the design consists of 12 blades with a diameter of 0.652 m and a blade angle of 33.5°, while the aft rotor has 10 blades with a diameter of 0.630 m and a blade angle of 35.7°. The Mach number of the flow was Ma=0.2, while the angle-of-attack of the flow with regard to the test rig was 0°. Further details of the test set-up and the test matrix can be found in [15-17].
An OptiNav Array 48 phased array system [18]
was used to carry out the acoustic measurements.
The signals from the 48 microphones were simultaneously recorded at a sampling rate of 96 kHz and then processed using FDBF beamforming technology [14] using the OptiNav Beamform Interactive software [18]. This processing method – as mentioned above – takes advantage of the time delays (or in other words phase differences) experienced between the various microphones in order to investigate possible source locations in given investigation points [14]. The cross-spectral matrices used during the processing of the data were created using a transform length of 4096, and 6 dB were subtracted from the results in order to account for the pressure doubling on the surface of the array.
In order to remove the microphones from the flow, the array was installed in a cavity along the sidewall of the wind tunnel, and a Kevlar® sheet was tightly stretched over the opening of the cavity, leaving a gap between the fabric and the phased array. This technique has been developed and tested by others in [19] and [20], which demonstrated the ability of the technology to improve the signal-to- noise ratio. The signal-to-noise ratio was further improved by using a long time series (45 s) and removing the diagonal of the CSM. During the measurements, the microphone array was located at
a distance of 1.6 m from the centre plane of the test rig, the plane under investigation, which can be considered to be in the acoustic far-field according to simulation results of Horváth et al. [15, 16]. The measurement setup is shown on the bottom of Figure 3, with the Kevlar® window being located on the right hand side of the test rig in the figure.
Figure 3. The Array48 system and its installation in the wall of the wind tunnel [15]
3. SPECTRAL RESULTS
The influence of the pylon self-noise on the total noise level of an installed CROR was investigated with the help of the PSD spectra of the BFpeak values and the beamforming maps for various setups.
The generated noise was investigated over a wide frequency range, from 500 Hz to 14 kHz, using narrowband frequency bins having a bandwidth of 19.2 Hz. In order to isolate the self-noise of the pylon, two configurations had to be analysed. The blade sets are not mounted for either of the two test cases. The first configuration is that of the test rig with a pylon, while the second contains only the test rig, hence no blades or pylon. In order to minimize the effect of the noise of the other areas of the setup and the equipment on the beamforming results, the size of the investigation area was decreased. A Region of Interest (ROI) window was used as a
spatial confinement of the investigated domain. The location of the ROI is shown in Figure 4.
Figure 4. The Region of Interest window applied during the investigation
In beamforming investigations, the background noise can be removed from the results by subtracting the CSM of a background noise measurement from that of the test case measurement under investigation. This method is normally applied in order to remove the noise of the wind tunnel and obtain only the “clean” signal of the investigated noise sources. In this case the test case containing only the test rig of the CROR can be considered as the background noise test case, and therefore the noise generation of the pylon can be examined by subtracting this CSM from the one pertaining to the configuration with the pylon. As stated above, the only difference between the two test cases is the presence of the pylon. The spectrum shown in Figure 5 was created as a result of this subtraction.
For the test case with a pylon, a whistle was mounted on the test rig in order to validate the beamforming maps. The frequency bins which were dominated by the sound of the whistle can be found in the range of 2.9…3.25 kHz, 6…6.15 kHz and 9.2…9.3 kHz. This whistle was not mounted for the test case without the pylon. Taking into consideration that the tonal noise sources described above and seen in Fig. 5 are associated with the whistle, it can be stated that the pylon noise sources are broadband self-noise noise sources for the frequency range under investigation.
Figure 5. The self-noise spectrum of a pylon (ROI and CSM subtraction applied)
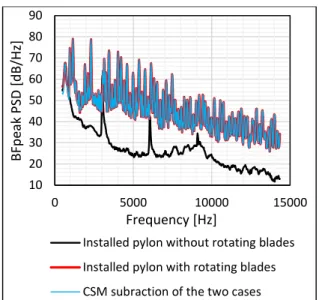
In Figure 6 the BFpeak PSD spectrum pertaining to the test rig with the pylon but no blades can be seen in one diagram with the spectrum of the test rig with blades and a pylon. In this comparison the ROI window was not applied, so that all the noise sources, including the blade rows would be included in the comparison. The peaks pertaining to the noise of the whistle can once again be seen in the spectra. This figure helps show that the installed CROR with the pylon but without rotating blades generates considerably less noise as compared to the configuration with the pylon and the blade sets. The amplitude difference is approximately 20 dB across the entire frequency range under consideration. In Figure 6 the results of the CSM subtraction of these two cases is also shown with a blue continuous line.
This third spectrum in essence gives the noise of only the rotors. The difference between the spectrum of the test rig with rotating blades and this third spectrum (rotors only) is negligible. This can also be seen in Figure 7, where the difference between the two spectra is plotted. The biggest difference appears at low frequencies (below 1kHz), where the spectra of the installed pylon with rotating blades and the case of the CSM subtraction (rotors only) are almost the same (see Fig. 6). At higher frequencies, where the amplitude differences between the two spectra differ the most, the influence of the self-noise of the pylon is less than 1 dB (see Fig. 7). The small peaks in Fig. 7 belong to the whistle, which generates high peaks in the spectra of the case with blades as well as in the one without blades.
0 10 20 30 40 50 60
0 5000 10000 15000
BFpeak PSD [dB/Hz]
Frequency [Hz]
Self noise of the pylon (CSM subtraction)
Figure 6. Determination of the influence of the pylon self-noise on the noise of the installed CROR with a pylon and blades
Considering the spectral results, it can be stated, that the self-noise generation of the pylon has hardly any effect on the noise of the installed CROR configuration and can be neglected during the investigation process of the noise of a CROR for zero angle-of-attack.
Figure 7. The difference between the spectrum of the installed CROR with a pylon and blades and the spectrum of the CSM subtracted case (blades only)
4. BEAMFORMING MAPS
As mentioned above, beamforming maps make it possible to localize the noise sources for a chosen investigation plane. Besides examining the spectra of the generated noise for the different configurations, the locations of the dominant noise sources have to be determined in order to understand the noise generation mechanisms.
In order to reduce the effect of other noise sources during the investigation of the self-noise of the pylon, the aforementioned ROI window was applied (see Figure 4), and hence the size of the
investigated domain was decreased. Therefore, the dominant noise sources located outside of this ROI were not examined. The investigated beamforming maps belong to the pylon self-noise (pertaining to the spectrum of the CSM subtraction presented in Fig.
5), in other words the noise of the pylon without the noise of the other components.
Figure 8. Typical trailing edge noise source of the pylon
Figure 9. Typical boundary layer noise source of the pylon
According to Brooks et al., trailing edge noise sources are typical self-noise noise sources of airfoils [21]. In accordance with the literature, Figure 8 shows a typical trailing edge noise source for the pylon under investigation. Other than sources localized to the trailing edge, other typical beamforming map results for the pylon under investigation present noise sources which can be 10
20 30 40 50 60 70 80 90
0 5000 10000 15000
BFpeak PSD [dB/Hz]
Frequency [Hz]
Installed pylon without rotating blades Installed pylon with rotating blades CSM subraction of the two cases
-1 0 1 2 3 4
0 5000 10000 15000
Effect of the CSM subtraction [dB]
Frequency [Hz]
associated with the noise of the boundary layer of the pylon. The literature also discusses the boundary layer as a typical source of airfoil self-noise [21]. A typical example of boundary layer self-noise can be seen in Figure 9.
To summarize the results of the investigation of the beamforming maps, the typical noise sources of the pylon under investigation were identified.
However, as a result of the relatively low amplitude values, as well as the properties of the FDBF technology applied herein, the beamforming maps pertaining to frequency bins above 5 kHz could not be investigated in detail as they contain a large amount of sidelobes, which makes the examination of the maps rather difficult.
5. CONCLUSION
Counter-rotating open rotors can provide an energy efficient alternative to jet engines, but their noise emission has to be reduced before their widespread application. Therefore, their noise generation mechanisms have to be examined, understood, and eliminated. In this article the self- noise of a pylon was investigated, which is a commonly used support structure for mounting aircraft engines. A CROR pylon has a potentially large effect on the noise generation of a CROR setup, since the interaction between the wake of the pylon and the rotating blades generates large tonal peaks in the spectrum. However, it is also important to determine the self-noise of the pylon itself, and hence a configuration comprised of the CROR test rig with a pylon and without blades was investigated. The setup was placed in the flow and phased array microphone measurements were carried out. Using beamforming technology, the dominant noise sources were localized for the investigated frequency bins. Considering the measurement results of the test rig without the pylon as the background noise measurement made it possible to investigate only the self-noise generation mechanisms of the pylon.
According to the spectral results and the beamforming maps, the self-noise of the pylon does not play a significant role in the generated noise for the case of zero angle-of-attack, since the self-noise of the pylon results in much smaller amplitudes in the spectrum. Some typical noise sources of the pylon, which can appear at low frequencies, were determined to be trailing edge noise and boundary layer noise. Above 5 kHz, the self-noise of the pylon could not be separated from the sidelobes utilizing the current methods. Summing up the conclusions, the noise generation mechanisms of an installed CROR with a pylon can be investigated while neglecting the self-noise generation of the pylon for zero angle-of-attack. If investigating installed CROR with a pylon at angle-of-attack values other than zero, which is often the case during actual flight conditions, then the contribution of the pylon self- noise needs to be evaluated, as it could be more
significant than what was seen here. This can be done by applying the method presented herein for other test cases which have been measured at other angle- of-attack settings.
ACKNOWLEDGEMENTS
The testing of the CROR was funded by the Environmentally Responsible Aviation Project of the NASA Integrated Systems Research Program and the Fixed Wing Project of the NASA Fundamental Aeronautics Program. The present investigation was supported by the Hungarian National Research, Development and Innovation Center under contract No. K 119943, the János Bolyai Research Scholarship of the Hungarian Academy of Sciences, the Higher Education Excellence Program of the Ministry of Human Capacities in the frame of the Water science & Disaster Prevention research area of the Budapest University of Technology and Economics (BME FIKP-VÍZ), as well as the TeMa Talent Management Foundation.
REFERENCES
[1] Bowles, M. D., 2010, “Apollo” of Aeroacoustics: NASA’s Aircraft Energy Efficiency Program 1973-1987”, NASA HQ., Washington, D.C., USA, 113-140.
[2] Woodward, R. P., 1988, “Noise of a Model High Speed Counterrotation Propeller at Simulated Takeoff/Approach Conditions (F7/A7)”, Technical report NASA TM-100206.
[3] Peake, N., and Parry, A. B., 2012, “Modern Challenges Facing Turbomachinery Aeroacoustics”, Annual Review of Fluid Mechanics, vol. 44(1), pp 227-248.
[4] DePriest, J., 2000, “Aircraft Engine Attachment and Vibration Control”, SAE Technical Paper, SAE General Aviation Technology Conference and Exposition, Wichita, KS, USA, paper no. 2000-01-1708.
[5] Remouchamps, A., Bruyneel, M., Fleury, C., Grihon, S., 2011, “Application of a bi-level scheme including topology optimization to the design of an aircraft pylon”, Structural and Multidisciplinary Optimization, vol. 44(6), pp .739-750.
[6] Jing, L., Zhenghong, G., Jiangtao, H., Ke, Z., 2013, “Aerodynamic design optimization of nacelle/pylon position on an aircraft”, Chinese Journal of Aeronautics, vol. 26(4), pp. 850- 857.
[7] Woodward, R. P., Hughes, C. E., 1989, “Noise of a Model Counterrotation Propeller with Simulated Fuselage and Support Pylon at Takeoff/Approach Conditions”, AIAA 12th Aeroacoustics Conference, San Antonio, TX, USA, paper no. AIAA-89-1143.
[8] Parry, A. B., Crighton, D. G., 1989, “Prediction of Counter-Rotation Propeller Noise”, AIAA
12th Aeroacoustics Conference, San Antonio, TX, USA, paper no. AIAA-89-1141.
[9] Eret, P., Kennedy, J., Amoroso, F., Castellini, P., and Bennett, G.J., 2016, “Experimental observations of an installed-on-pylon contra- rotating open rotor with equal blade number in pusher and tractor configuration”, International Journal of Aeroacoustics, vol. 15(1-2), pp. 228- 249.
[10] Horváth, Cs., 2015, “Investigation of Counter- Rotating Open Rotors Using Phased Array Beamforming Technology”, PhD. Thesis, Budapest University of Technology and Economics, Hungary.
[11] Kennedy, J., Eret, P., Bennett, G., Sopranzetti, F., Chiariotti, P., Castellini, P., Finez, A., and Picard, C., 2013, “The Application of Advanced Beamforming Techniques for the Noise Characterization of Installed Counter Rotating Open Rotors”, 19th AIAA/CEAS Aeroacoustics Conference, Berlin, Germany, paper no. AIAA 2013-2093.
[12] Fenyvesi, B., Tokaji, K., Horváth, Cs., 2018,
“Investigation of a pylons effect on the character of counter-rotating open rotor noise using beamforming technology”, Acta Acoustica united with Acoustica. (Under Review)
[13] Bennett, G.J., Kennedy, J., Eret, P., Cappadona, F., Bianco, A., Letizia, R., Danise, D., Lamotte, L., Picard, C., Finez, A., Castellini, P., Chiariotti, P., Sopranzetti, F., Tsahalis, D., Tsahalis, H., Moussas, V., Paonessa, A., Amoroso, F., and Di Giulio, M., 2013,
“WENEMOR: Wind Tunnel Tests for the Evaluation of the Installation Effects of Noise Emissions of an Open Rotor Advanced Regional Aircraft”, 19th AIAA/CEAS Aeroacoustics Conference, Berlin, Germany, paper no. AIAA 2013-2092.
[14] Mueller, T. J., 2002, “Aeroacoustic Measurements”, Springer-Verlag, Berlin, Germany.
[15] Horváth, Cs., Envia, E., Podboy, G. G., 2014,
“Limitations of Phased Array Beamforming in Open Rotor Noise Source Imaging” AIAA Journal, vol. 52(8), pp. 1810-1817.
[16] Horváth, Cs., 2015, “Beamforming Investigation of Dominant Counter-Rotating Open Rotor Tonal and Broadband Noise Sources”, AIAA Journal, vol. 53(6), pp. 1602- 1611.
[17] Van Zante, D. E., Gazzaniga, J. A., Elliott, D.
M., et al., 2011, “An Open Rotor Test Case:
F31/A31 Historical Baseline Blade Set”, 20th International Symposium on Airbreathing Engines, Gothenburg, Sweden, paper no.
ISABE 2011-1310.
[18] OptiNav Inc., Array 48,
http://www.optinav.info/Array48.pdf, 2017.
[19] Jaeger, S. M., Horne, W. C., Allen, C. S., 2000,
“Effect of Surface Treatment on Array Microphone Self-Noise” 6th AIAA/CEAS Aeroacoustics Conference and Exhibit, Lahaina, Hawaii, USA, paper no. AIAA 2000- 1937.
[20] Fleury, V., Coste, L., Davy, R., 2012,
“Optimization of Microphone Array Wall Mountings in Closed-Section Wind Tunnels”
AIAA Journal, vol. 50(11), pp. 2325-2335.
[21] Brooks, T. F., Pope, D. S., Marcolini, M. A.
1989, “Airfoil self-noise and prediction”, Technical report NASA RP-1218.

![Figure 3. The Array48 system and its installation in the wall of the wind tunnel [15]](https://thumb-eu.123doks.com/thumbv2/9dokorg/1429465.121484/4.892.471.786.244.757/figure-array-installation-wall-wind-tunnel.webp)