Lenz-Majewski mutations in PTDSS1 affect phosphatidylinositol 4-phosphate metabolism at ER-PM and ER-Golgi junctions
Mira Sohn
a, Pavlina Ivanova
b, H. Alex Brown
b, Daniel J. Toth
a, Peter Varnai
c, Yeun Ju Kim
a, and Tamas Balla
a,1aSection on Molecular Signal Transduction, Program for Developmental Neuroscience, Eunice Kennedy Shriver National Institute of Child Health and Human Development, National Institutes of Health, Bethesda, MD 20892;bDepartment of Pharmacology and Biochemistry, Vanderbilt-Ingram Cancer Center, The Vanderbilt Institute of Chemical Biology, Vanderbilt University School of Medicine, Nashville, TN 37232; andcDepartment of Physiology, Semmelweis University School of Medicine, Budapest, Hungary, H-1094
Edited by Pietro De Camilli, Yale University and Howard Hughes Medical Institute, New Haven, CT, and approved March 7, 2016 (received for review December 30, 2015)
Lenz-Majewski syndrome (LMS) is a rare disease characterized by complex craniofacial, dental, cutaneous, and limb abnormalities combined with intellectual disability. Mutations in the PTDSS1 gene coding one of the phosphatidylserine (PS) synthase enzymes, PSS1, were described as causative in LMS patients. Such mutations render PSS1 insensitive to feedback inhibition by PS levels. Here we show that expression of mutant PSS1 enzymes decreased phosphatidylinositol 4-phosphate (PI4P) levels both in the Golgi and the plasma membrane (PM) by activating the Sac1 phospha- tase and altered PI4P cycling at the PM. Conversely, inhibitors of PI4KA, the enzyme that makes PI4P in the PM, blocked PS synthesis and reduced PS levels by 50% in normal cells. However, mutant PSS1 enzymes alleviated the PI4P dependence of PS synthesis.
Oxysterol-binding protein–related protein 8, which was recently identified as a PI4P-PS exchanger between the ER and PM, showed PI4P-dependent membrane association that was significantly de- creased by expression of PSS1 mutant enzymes. Our studies reveal that PS synthesis is tightly coupled to PI4P-dependent PS transport from the ER. Consequently, PSS1 mutations not only affect cellular PS levels and distribution but also lead to a more complex imbal- ance in lipid homeostasis by disturbing PI4P metabolism.
phosphatidylserine
|
phosphatidylinositol|
PI 4-kinase|
ER-PM junctions|
lipid transfer
M aintenance of the unique lipid composition of different eukaryotic cell membranes requires a concerted regulation of lipid synthesis and transport via vesicular trafficking and non- vesicular lipid transfer (1–3). Most lipids in the cell are synthesized in the endoplasmic reticulum (ER) or taken up from the outside for degradation and reutilization via the endo-lysosomal system.
Lipid synthesis is often under strict feedback control, and there- fore transport of lipids away from the site of synthesis is a key regulator of lipid synthesis. The importance of such feedback control is highlighted by the disease Lenz-Majewski syndrome (LMS) (4). LMS is characterized by multiple skeletal dysplasia- dysostosis, with characteristic craniofacial and limb abnormalities combined with intellectual disabilities (5). Recent studies have identified mutations in the PTDSS1 gene in LMS patients and showed that these mutations render the enzyme PSS1 resistant to feedback inhibition by phosphatidylserine (PS) (6).
Recent studies have shown that directional PS transport be- tween the ER and plasma membrane (PM) can be driven by the PI4P gradient formed between the two membranes (7, 8). This gradient is set up by the actions of PI4KA, one of four phos- phatidylinositol 4-kinases (PI4Ks), which functions in the PM (9) and the PI4P phosphatase, Sac1, located in the ER and the Golgi (10). While studying the role of phosphoinositides in the control of lipid metabolism, we found that uncontrolled PS production had an impact on lipid homeostasis by affecting phosphatidyl- inositol 4-phosphate (PI4P) cycling between the PM and the ER.
Results and Discussion
PI4KA Inhibitors Inhibit PS Synthesis.
These studies were initiated to test our hypothesis that a PI4P gradient between the PM and the ER may be involved in the transport of specific lipids out of the ER (11) (Fig. 1F). To determine whether PM PI4P pro- duction has any bearing on the level of any of the phospholipid classes, we performed lipidomic analysis of HEK293 cells treated for 30 h with the PI4KA specific inhibitor A1 (12). We found that the cellular level of PS was consistently decreased by about 50% in cells treated with A1 compared with controls (Fig. 1A).
This effect was specific in that inhibition of PI4KB, another PI4K that works primarily at the Golgi, had no effect on the levels of the major phospholipids (Fig. 1A). The reduction in PS mass by A1 and other PI4KA inhibitors was caused by decreased syn- thesis as shown by a reduced [
3H]serine incorporation into PS in intact HEK293 cells (Fig. 1 B and C). The effectiveness of inhibitors on PS synthesis showed good correlation with their in- hibitory potencies against PI4KA (Fig. 1C). Importantly, A1 did not affect [
3H]serine uptake (Fig. 1D) so the inhibitory effect was truly on PS synthesis.
Effect of PI4KA Inhibitors on PS Synthesis Is Indirect.
It has been shown previously that PS synthesis is under strong product in- hibition (13). Therefore, we reasoned that interfering with PI4KA function might have affected PS synthesis indirectly by blocking the transport of PS from the ER. PS is synthesized by two enzymes, PSS1 and PSS2, by head-group exchange from phosphatidylcholine (PC) and phosphatidylethanolamine (PE), respectively (Fig. 1E). If inhibition of PS synthesis by PI4KA inhibition were related to a transport defect, one would expect that PSS1 enzymatic activity in membrane preparations would
Significance
Phosphatidylserine (PS) is synthesized in the endoplasmic reticulum by PS synthase enzymes, but most of the PS is found in the inner leaflet of the plasma membrane. The importance of the present findings is that they uncover a critical connection between PI4P turnover and PS transport and demonstrate that uncontrolled PS synthesis as seen in Lenz-Majewski syndrome patients has deleterious consequences to cells affecting other lipids and not just PS.
Author contributions: M.S. and T.B. designed research; M.S., P.I., Y.J.K., and T.B.
performed research; D.J.T. and P.V. contributed new reagents/analytic tools; M.S., P.I., H.A.B., Y.J.K., and T.B. analyzed data; and T.B. wrote the paper.
The authors declare no conflict of interest.
This article is a PNAS Direct Submission.
1To whom correspondence should be addressed. Email: ballat@mail.nih.gov.
This article contains supporting information online atwww.pnas.org/lookup/suppl/doi:10.
1073/pnas.1525719113/-/DCSupplemental.
not be sensitive to PI4K inhibition. Fig. 1J shows that A1 was indeed without effect on PS synthase activity of membrane preparations obtained from cells expressing the PSS1 enzyme. It is important to emphasize that the PI4KA inhibitor A1 inhibited PS synthesis only in intact cells and not the PSS1 enzyme itself.
Next we tested the effects of A1 in cells expressing mutant PSS1 enzymes described in LMS (6) that are insensitive to PS-mediated negative feedback. If the A1 effect were indeed due to ER re- tention of PS, such mutant enzymes should be resistant to PI4KA inhibition even in the intact cells. As shown in Fig. 1H, expression of mutant PSS1 enzymes (L265P, P269S, and Q353R) elicited a very robust increase in PS synthesis in intact cells, significantly higher than the wild-type protein. Importantly, A1 treatment only slightly decreased PS synthesis in such cells (Fig. 1I); the small effect was attributed to inhibition of the endogenous enzyme.
Notably, expression of PSS2 enzyme increased the synthesis of a faster running PS species, which was also less inhibited by the PI4K inhibitor (Fig. 1 H and I).
PS Accumulates in the ER in Cells Expressing PSS1 Mutant Enzymes.
Next we examined the effects of the PSS1 mutations on the distribution of PS using the LacC2 PS reporter (14) (Fig. 2A). It has been well documented that PS is found mostly in the PM and some endosomes as visualized by the LacC2 reporter (14) de- spite the fact that PS is synthesized in the ER. As shown in Fig.
2B, even when we overexpressed PSS1 or -2, there was no sign that PS was present in the ER. In contrast, overexpression of the PSS1 mutant enzymes has profoundly changed PS distribution, which now shows clearly detectable ER localization (Fig. 2 C–E).
Some mutants, namely P269S, also generated large vesicles positive for PS (Fig. 2D). These results suggested that PS is very efficiently transported out of the ER but appears in the ER when the PSS1 enzyme loses its product inhibition. These results also supported the notion that PS synthesis is very tightly coupled to PS transport out of the ER. If PI4KA-Sac1–mediated cycling is important for PS transport between the ER and the PM as shown recently (7, 8), then inhibition of PI4KA is expected to impact PS levels in the PM. To test if this was indeed the case, we used a
PS
A1 (nM) 0 1 3 10 30 100 10 9 8 7 6
40 60 80 100
3 H-PS ( % of control)
0 10 20 30
0 50 100
3 H-serine (% of 30 min)
PIK93 DMSOA1
Time (min) -log [M]
0 10 20
30 control
PI4KB inh A1
PC PE PI PS
Lipids (mol%)
*
A B C D
E F
PC PE
PS
PSS1 PSS2
serine serine
choline ethanolamine
PS PE
PSD
PS
mito PM
ER
membrane
PS synthase activity (cpm x 10-3) C1 F1 A1
DMSO A1 5
0 10 15
20 PSS1wt
vector PI4P
PI4P PI
PI PI4KA
Sac1
PS PSS1
PC PS
GFP L265P P269SQ353RPSS2
0 1 2 3 4 5 6
A1 (30 nM) - + - + - + - + 3 H-PS ( fold over control)
GFP PSS1
L265P PSS1
wt
PSS2 wt [3H]PS
L265P
P269S Q353R
N
C
PSS1
G
H
cytosol ER-lumen
I J
A1
ER PM
[3H]PS
Fig. 1. Plasma membrane PI4P production is critical for PS synthesis. (A) Lipidomic analysis of HEK293-AT1 cells treated with PI4K inhibitors for 30 h. Note the significant reduction in PS levels by the PI4KA inhibitor A1 (100 nM) but not by the PI4KB inhibitor PIK93 (300 nM). Means±SEM from three independent experiments performed in duplicates (*P<0.05 by pairedttest). (B) Representative TLC plate showing incorporation ofL-[3H]serine into PS by HEK293-AT1 cells in 3 h in the presence and absence of the PI4KA inhibitor A1. The arrows indicate a faster and slower migrating PS species. (C) Quantitation of PS labeling in the presence of various inhibitors (A1, F1, C1, and PIK93 are inhibitors of PI4KA and PI4KB, respectively). TLC spots were scraped and measured by scin- tillation spectrometry. Values were normalized to DMSO-treated controls. Average values of two experiments are shown. The range (<10%) has been omitted for clarity. (D)L-[3H]serine uptake is not affected by A1 treatment. Cell-associated radioactivity was measured at the indicated times in two experiments (means±range). (E) Schematics of the enzymology and sites of PS synthesis. (F) Cartoon depicting the ER-PM PI4P cycling and its relationship to PS transport.
(G) Cartoon showing the location of the LMS mutations in PSS1 enzyme. (H) Effect of PSS1-GFP wild-type or mutant proteins onL-[3H]serine incorporation into PS shown in a representative TLC. The migration difference is due to the uneven run on this particular TLC. (I) The effects of A1 onL-[3H]serine incorporation in cells expressing the wild-type or various mutant PSS1 enzymes fused to GFP. (Upper) A representative TLC plate. (Lower) The quantification from two ex- periments with the range of the two determinations. Values were normalized to GFP-transfected controls. (J) PSS1 activity measurements in membranes prepared from COS-7 cells transfected with vector or PSS1-GFP wild-type enzyme. Note the lack of effect of the PI4KA inhibitor A1 (100 nM) in these membrane assays (means±SEM from three membrane preparations assayed in duplicate).
BIOCHEMISTRY
recently developed bioluminescence resonance energy transfer (BRET) approach to monitor the level of PS in the PM using the LacC2 reporter (15) (Fig. 3A). A1 treatment induced a small but reproducible decrease in PM PS levels (Fig. 3B) consistent with a decreased transport from the ER (note that the BRET signal increases with time in DMSO-treated controls). Given the high level of PS in the membrane, it may require a longer time to achieve a more substantial decrease.
PS Overproduction Increases Sac1 Activity and Reduces PI4P Levels.
Having established the mechanism by which PI4KA controls PS synthesis, we wanted to know how PS overproduction affects PI4P metabolism. It has been described that PS stimulates the enzymatic activity of recombinant Sac1, the enzyme that de- phosphorylates PI4P in the ER (16). Similarly, yeast strains defective in PS synthesis show decreased Sac1 activity (16).
Therefore, we measured Sac1 activity in crude membranes pre- pared from cells overexpressing PSS1 mutant enzymes and compared them to vector-transfected controls. Fig. 3C shows that expression of PSS1-P269S has significantly increased the Sac1 activity of membranes. We then measured PI4P levels specifically in various compartments using immunostaining techniques (17) in HEK293 cells expressing the mutant PSS1- P269S enzyme. Quantification of the immunostained images showed significantly reduced levels of PI4P both in the Golgi and the PM in cells expressing the mutant PSS1-GFP relative to
those expressing GFP only (Fig. 3 D–G). This was consistent with the increased Sac1 activity reducing the levels of PI4P in mem- branes from where PI4P is either delivered to the ER or where Sac1 can directly access PI4P.
The PS-Transport Protein ORP8 Is Affected by PM PI4P and ER PS Production.
Recent studies identified the oxysterol-binding pro- tein-related proteins ORP8 and ORP5 (and OSH6 in yeast) as capable of transporting PS from the ER to the PM in exchange for PI4P moving in the other direction (7, 8). Therefore, we in- vestigated the effects of overproduction of PS by PSS1-P269S on this lipid exchange process. First, we examined whether knocking down these ORP proteins affected PI4P in the PM (PI4P
pm). If these ORP proteins deliver PI4P from the PM to the Sac1 phos- phatase in the ER, their depletion may affect the rate of PI4P disappearance from the PM after inhibition of PI4KA. We fol- lowed the kinetics of PI4P
pmchanges after inhibition of PI4KA using the BRET approach (15) (Fig. 4 A and B). As expected, A1 treatment led to a steady decline of PI4P
pm. Knockdown of ORP5 had only a minor effect on either the resting BRET signal or the kinetics of decline after A1 treatment. In contrast, ORP8 knock- down increased the basal BRET signal and slowed down the PI4P
pmdecrease. Combined knockdown of both ORP proteins had the largest effect, increasing the resting BRET signal and slowing the decay (Fig. 4C). These results were consistent with the recent data of Chung et al. (7) and suggested a redundant and
0 20 40 60
0 5 10 15 20 25
0 1 2 3
0 10 20 30 40 50 0
1 2 3 4
0 20 40 60
r = 0.814 r = 0.035
r = 0.930 r = 0.547
0 1 2 3
0 1 2 3 4 mCherry-LacC2 PSS1-GFP
wild-type
L256P
P269S
Q353R
distance (µm)
Average pixel intensity x 10-3
L265PP269S Q353R cytosol
ER-lumen
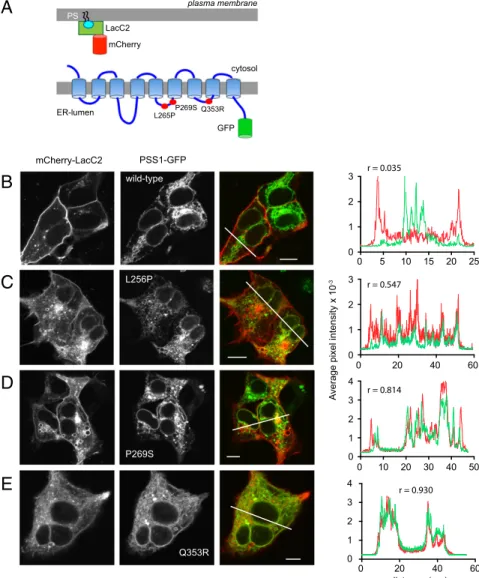
plasma membrane PS
LacC2 mCherry
GFP
A
B
C
D
E
Fig. 2. Cellular distribution of PS and the PSS1 en- zyme in HEK293-AT1 cells. (A) PS distribution was assessed by the PS-binding C2 domain of lactadherin fused to mCherry, and the PSS1 enzyme was tagged with GFP at its C terminus. (B) Wild-type PSS1-GFP overexpression does not affect the localization of PS, which is detected primarily in the PM and in endo- somal compartments by confocal microscopy of live cells. There is no colocalization between the two sig- nals except in a small pericentriolar area as indicated by the line intensity histogram shown on theRight.
(C–E) Expression of LMS mutant PSS1 enzymes causes accumulation of PS in the ER. The line-intensity histo- grams show a good correlation between the localiza- tions of the PS and PSS1 mutant enzymes. Although many cells shown here are multinucleated, the frac- tion of multinucleated cells was not notably changed by expression of PSS1 mutant enzymes.
complementary role of these ORP5 and ORP8 proteins in de- livering PI4P to the ER for the Sac1 phosphatase. However, these data also suggested that PI4P is removed from the PM by addi- tional mechanism(s) either by other PI4P transfer proteins or by the resting phospholipase C activity of the PM.
Overexpression of PSS1-P269S decreased the basal BRET signal and significantly slowed down the rate of PI4P
pmdecrease (Fig. 4D). PSS1 wild-type overexpression did not have a similar effect: in fact, it slightly elevated the BRET signal and, accord- ingly, delayed the PI4P
pmdecline (Fig. 4D). As expected, Sac1 overexpression increased PI4P
pmdecline after PI4KA inhibition, suggesting that it is the Sac1 activity and not the access to PI4P, which limits the PI4P clearing process. These data suggested that the PI4P transfer process was reduced in cells overproducing PS and that it was not a simple consequence of Sac1 activation. To determine if PS overproduction down-regulated ORP5 or ORP8, we measured the levels of both ORP5 and ORP8 mRNAs by qPCR in cells expressing wild-type or mutant PSS1 enzymes.
This analysis showed no significant reductions in the mRNA level (Fig. 4E). However, the number of contact sites between the PM and ORP8 was significantly reduced in cells expressing the mutant PSS1 enzyme relative to the wild type (Fig. 4F).
ORP8 and ORP5 contacts the PM via their PH domains through interaction with PI4P (7). In agreement with those findings, acute A1 treatment eliminated the ER-PM contacts of ORP8 as judged by total internal reflection fluorescence (TIRF) micros- copy (Fig. 4G). Therefore, the reduced level of PI4P in the PM observed after PSS1-P269S overexpression could explain the reduced number of ORP8 PM contacts. These findings together strongly suggested that cells have implemented a protective mech- anism to spare PI4P in the PM against a massively overproduced PS
by limiting the delivery of PI4P from the PM to the ER for the Sac1-phosphatase.
In summary, the present studies have revealed a tight re- lationship between PS metabolism and PI4P turnover at ER-PM contact sites. Critical elements of this regulatory loop are the product inhibition of the PSS1 enzyme by PS, the activation of Sac1 by PS, and the PI4P-dependent transport of PS from the ER. Mutations that render the PSS1 enzyme resistant to product inhibition derail this process, putting a strain on PI4P turnover at the ER-PM junctions. The LMS causing mutations are located in the predicted ER luminal side of the PSS1 enzyme, suggesting that PS exerts its inhibitory effect on the luminal side. However, PS clearly accumulates on the cytoplasmic surface of the ER when mutant PSS1 enzymes are expressed and that is where it can activate the Sac1 enzyme. This raises the question of the role of PS flippases in connecting these metabolic control steps (18).
Although overproduced PS activates the Sac1 enzyme, it nega- tively affects ORP8/5-mediated PI4P delivery to the ER, which likely serves as a protective mechanism to spare the PM phos- phoinositide pools. Because Sac1 also controls PI4P levels in the Golgi, PS overproduction also affects Golgi PI4P pools and hence is expected to impact the transport of cholesterol (19, 20), ceramide (21), and complex sphingolipids (22). A tight re- lationship between Sac1-mediated PI4P cycle and PS synthesis has been described in yeast (23). These studies suggest evolu- tionary conservation of the tight relationship between PS and PI4P metabolism. Our studies highlight the complexity of lipid changes that are caused by a single mutation that renders the PSS1 enzyme resistant to product inhibition, offering deeper insight into the complex pathology of the LMS disease.
PI4P GFP
PSS1(P269S)-GFP gm130
PI4P gm130
0.00 0.25 0.50 0.75 1.00
normalized PI4P PM intensity
PSS1 (P269S)-GFP
GFP A1
0.00 0.25 0.50 0.75 1.00 1.25
nt GFP PSS1
(P269S)-GFP
normalized PI4P Golgi intensity
nt
0.0 1.0 1.5 2.0 2.5
vector PSS1 (P269S)-GFP
GFP-Sac1
A
B
PI4P GFP
phalloidin
PSS1(P269S)-GFP
phalloidin PI4P
normalized Sac1-activity
membranes
C
D E
F G
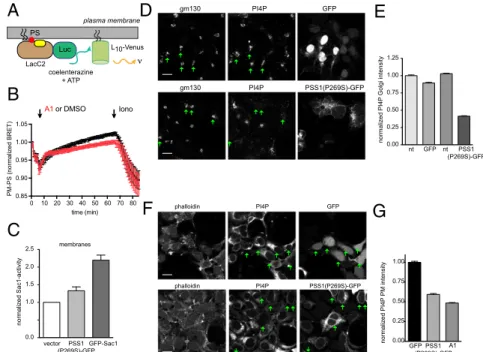
LacC2
Luc L10-Venus
plasma membrane PS
coelenterazine + ATP
PM-PS (normalized BRET)
A1or DMSO Iono
0 10 20 30 40 50 60 70 80 0.85
0.90 0.95 1.00 1.05
time (min)
Fig. 3. PI4KA inhibition reduces PM PS levels, and PS overproduction affects PI4P levels. (A) Sche- matics of the principles of quantification of PM- localized PS by BRET analysis. The PS-binding LacC2 domain fused to S-luciferase excites the PM-tar- geted Venus in a proximity-dependent manner in the presence of coelenterazine. Reduced PS levels would release some of the LacC2 from the mem- brane, decreasing the energy transfer to Venus.
See SI Materials and Methods for more details.
(B) Fractional BRET signal changes as a function of time in cells treated with A1 (30 nM) (red) or DMSO (black). The rapid dip in the signal is an artifact due to the removal of the plate at the beginning of the recording when the inhibitors are added.
Ionomycin (10μM) was added at the end of the incubations to induce PS externalization that decreases the level of PS in the cytoplasmic leaflet of the PM.
A1 treatment caused a slow decrease in the BRET signal relative to the DMSO-treated control. Grand means±SEM are shown from three independent experiments performed in triplicates and normal- ized to the initial BRET value of control cells. (C) Overexpression of LMS mutant PSS1(P269S)-GFP increases the Sac1 activity of isolated crude mem- branes. Overexpression of GFP-Sac1 was used as a positive control. Means±SEM are shown from five
independent membrane preparations. Differences were statistically significant between control and PSS1(P269S) (P<0.05) and between control and Sac1 (P<0.001) using a pairedttest. (D) Golgi PI4P levels are decreased in cells expressing PSS1(P269S)-GFP as assessed by immunostaining for PI4P. The Golgi area was identified by gm130 staining, and this mask was used to determine PI4P-staining intensity. Green arrows point to cells that express either GFP (Upperrows) or PSS1(P269S)-GFP (Lowerrows). (E) Quantitation of a large number of cells (69–123) recorded in several microscopy fields in two separate experiments are shown. Average pixel intensities were measured in individual cells over the gm130 mask and normalized to the values obtained in cells that showed no GFP signal in the GFP-transfected sample. Significant difference (P<0.0001, unpairedttest) was found between the control and PSS1(P269S)-GFP–expressing cells but not between control and GFP-expressing cells (P=0.1094). (F) PM PI4P levels are decreased in cells expressing PSS1(P269S)-GFP or treated with A1 (1 h, 100 nM) as assessed by immunostaining for PI4P in the PM. Green arrows point to cells that express either GFP (Upperrows) or PSS1(P269S)-GFP (Lowerrows). (G) Quantitation of a large number of cells (68–84) recorded in several microscopy fields in two separate experiments. Average pixel intensities were measured in individual cells over the phalloidin mask and normalized to the cells expressing GFP only. The difference between control and PSS1(P269S)-GFP–expressing or A1-treated cells was statistically significant (P<0.0001 in both cases, unpairedttest).
BIOCHEMISTRY
Materials and Methods
Materials and DNA Constructs.All materials and DNA constructs are listed inSI Materials and Methods. Primers used for cloning of DNA constructs are listed inTable S1.
Cell Culture and Transfection.The HEK293-AT1 cells, a line that stably ex- presses the rat AT1a angiotensin receptor, have been described previously (24). HEK293-AT1 and COS-7 cells were grown in Dulbecco’s Modified Eagle Medium (DMEM-high glucose) containing 10% (vol/vol) FBS and 1% peni- cillin–streptomycin. For the metabolic labeling experiments, cells were seeded in 12-well plates (300,000 cells/well) and transfected with 0.3μg DNA/well with Effectene Transfection Reagent (Qiagen). For live-cell imag- ing, cells were plated on glass coverslips, which were precoated with poly-L- lysine solution (Sigma P8920) in six-well plates (500,000 cells/well). A total of 0.2μg of DNA/well was used for six-well transfection with Effectene Trans- fection Reagent. For the Sac1 phosphatase activity assay, COS-7 cells were plated in 10-cm tissue culture dishes (1,000,000 cells/well) and transfected with 2μg DNA/dish using the Effectene Transfection Reagent.
Lipidomic Analysis.Glycerophospholipids from pellets of HEK293-AT1 cells treated with different inhibitors were extracted using a modified Bligh and Dyer procedure (25). Briefly, each pellet was homogenized in 800μL of ice- cold 0.1 N HCl:CH3OH(1:1) and extracted and analyzed as detailed in SI Materials and Methods.
Analysis ofL-[3H]Serine–Labeled Lipids.HEK293-AT1 cells were preincubated for 50 min with a modified Krebs–Ringer buffer (120 mM NaCl, 4.7 mM KCl, 1.2 mM CaCl2, 0.7 mM MgSO4, 10 mM glucose, and 10 mM Na–Hepes, pH 7.4). Cells were treated with the indicated concentrations of PI4K inhibitors for 10 min followed by labeling withL-[3H]serine (10μCi/mL) for 3 h at 37 °C.
Labeling was terminated by adding ice-cold perchloric acid [5% (vol/vol) final].
Cells were kept on ice for 30 min, scraped by pipette tips, collected in poly- propylene tubes, and centrifuged. The pellets were subjected to lipid extrac- tion and lipids were analyzed by TLC essentially as described previously (26).
TLC plates were sprayed with EN3HANCE Spray (Perkin-Elmer) for autoradi- ography. For the quantitative analysis spots were scraped from the TLC plates, and the radioactivity was quantified by scintillation counter. In a few experi- ments extracted lipids were directly subjected to scintillation spectrometry as the major radioactive species was PS. For measurement of serine uptake, cells
were seeded and treated with inhibitors as described above and labeled withL-[3H]serine (2μCi/mL) for 30 min in 0.5 mL/well of modified Krebs–Ringer buffer. Labeling was terminated by adding 250 mML-Ser–containing Krebs–Ringer buffer (0.1 mL) on ice. Cells were washed with 50 mML-Ser–containing Krebs– Ringer buffer (3×1 mL). Cells were then lysed with RIPA buffer [1% Nonidet P-40 (vol/vol), 0.5% Na–deoxycholate (wt/vol), 0.1% SDS (wt/vol), 150 mM NaCl, 50 mM Tris·HCl, pH 7.5] in 0.2 mL/well and subjected to scintillation spectrometry.
Where cells were transfected, these procedures were performed 48 h after transfection.
Immunocytochemistry.For immunostaining, cells were plated on glass cov- erslips and transfected with the indicated DNAs for 48 h. For A1 treatment (100 nM, 1 h) cells were treated in serum-free DMEM before the staining procedure. Cells were washed with PBS and subjected to the fixation and staining protocol described for optimal PI4P staining in PM or Golgi as de- scribed by Hammond et al. (17) with slight modifications as detailed SI Materials and Methods.
Sac1 Phosphatase Assay.COS-7 cells were seeded on 10-cm culture dishes and transfected with plasmid DNAs encoding GFP, PSS1(P269S)-GFP, or GFP-Sac1.
After 48 h, cells were washed with the modified Krebs–Ringer buffer and lysed with 2 mL of reaction buffer (200 mM sodium acetate, 50 mM Pipes, pH 6.8, and 20μg/mL porcine gelatin) and broken up by passing through a 25-gauge syringe needle 10 times. After centrifugation at 1,000×gat 4 °C for 10 min, the supernatant was subjected to ultracentrifugation at 100,000×g at 4 °C for 1 h. The pellet was resuspended in a 200-μL reaction buffer, and the protein concentration was measured by BCA assay. Lysates (6–16μg) were mixed with a reaction buffer of 20μL final volume for the dephosphorylation reaction.
PI4P dissolved in reaction buffer was added as substrate to a final concentration of 100μM. Reactions were run at RT for 30 min and terminated by 20μL of 100 mMN-ethylmaleimide. Samples were centrifuged at 14,000×gat 4 °C for 15 min in a microcentrifuge and the phosphate content of the supernatant was analyzed by a malachite green assay kit (Echelon). The free phosphate amount was calculated based on a standard curve after absorbance measurement at 620 nm.
PSS1 Base-Exchange Assay.Control vector or PSS1-GFP construct was trans- fected into COS-7 cells using Lipofectamine 2000. After 1 d of transfection, cells in six-well dishes were washed and scraped into 0.2 mL of 50 mM Hepes (pH 7.5) and 5 mM CaCl2and ruptured by freezing and thawing three times.
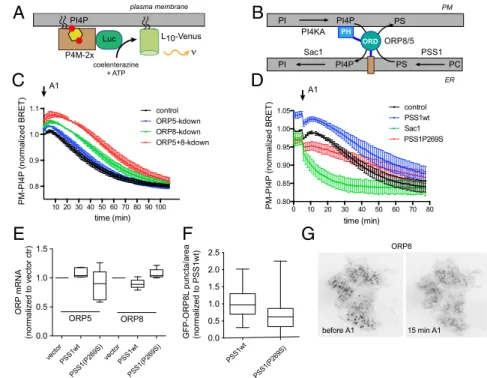
P4M-2x
Luc L10-Venus
plasma membrane
PI4P
PI4P PI
PI PI4P
PI4KA Sac1
ORP8/5 PS
60 0 10 20 30 40 50 60 70 80 0.80
0.85 0.90 0.95 1.00 1.05
time (min) control PSS1wt Sac1 PSS1P269S
PSS1 PC PS
10 20 30 40 50 60 70 80 90 100 0.8
0.9 1.0 1.1
time (min)
control ORP5-kdown ORP8-kdown ORP5+8-kdown
PM-PI4P (normalized BRET) PM-PI4P (normalized BRET)
coelenterazine + ATP
GFP-ORP8L puncta/area (normalized to PSS1wt) A1 A1
15 min A1 before A1
PSS1wt PSS1(P269S) 0.0
0.5 1.0 1.5 2.0 2.5
vectorPSS1wt PSS1(P269S) 0.0
0.5 1.0 1.5
vectorPSS1wt PSS1(P269S) ORP mRNA (normalized to vector ctr)
ORP5 ORP8
ORP8 PM
ER PH
ORD
B A
D C
F
E G
Fig. 4. Control of PI4P transfer between the PM and the ER by ORP5 and ORP8 proteins and by PS over- production. (A) Schematics of BRET analysis of PM PI4P. Here a tandem P4M domain of Legionella pneumophila(P4M-2x) was fused to the Luciferase to monitor PM PI4P levels. (B) Cartoon depicting the model of the PI4P-PS exchange process between the PM and the ER by the ORP5 and ORP8 proteins.
The PH domain of these proteins binds PI4P at the PM, and their C-terminal transmembrane domains anchor the protein to the ER (7). (C) BRET analysis of PM PI4P changes after A1 (30 nM) treatment in HEK293-AT1 cells treated with siRNAs for ORP5, ORP8, or both.
Grand means±SEM is shown from three independent experiments performed in triplicates and normalized to the first point after addition of the inhibitor in control siRNA-treated cells. (D) Similar experiment shown for changes in PM PI4P in cells overexpressing mCherry-tagged versions of PSS1 wild type, P269S mutant, or Sac1. Grand means±SEM is shown from three independent experiments performed in tripli- cates and normalized to the first point before addition of the inhibitor in the control cells. The rapid drop in the BRET signal is an artifact caused by the removal of the plate for stimulation. (E) Quantitative PCR of ORP5 and ORP8 proteins in cells expressing wild-type or P269S mutant PSS1-GFP. Means and whiskers are shown from five independent knockdown experi- ments (ORP5: PSS1wt vs. vectorP=0.051; PSS1P269S
vs. vectorP=0.309; ORP8: PSS1wt vs. vectorP=0.023; PSS1P269S vs. vectorP=0.089, unpairedttest) (F) Quantification of the number of GFP-ORP8 puncta per foot-print area in TIRF analysis. Means and whiskers are shown from 67 and 133 cells expressing the wild-type or mutant PSS1-mCherry enzyme, respectively.
Values were normalized to the average of the group expressing the wild-type enzyme (P<0.0001, unpairedttest). (G) Representative TIRF image of a cell expressing GFP-ORP8 before and after treatment with 100 nM A1. Note the disappearance of the ORP8 puncta after A1 treatment.
The crude membranes were centrifuged in a bench-top centrifuge at 13,000×g for 10 min. The assay was performed essentially as described (27). Briefly, the reaction mixture contained 50 mM Hepes (pH 7.5), 5 mM CaCl2, 0.1%
Triton X-100, 0.4 mM phosphatidylcholine (Avanti Polar lipids), 0.01 mM
L-Ser (Sigma), 20μCiL-[3H]serine, and an aliquot of the crude membrane, all in a total volume of 0.1 mL. After 10 min of incubation at 37 °C, the reaction was stopped by adding of 0.35 mL of acidic methanol (0.1 N HCl), followed by 0.5 mL of chloroform and 0.5 mL of 1 M MgCl2. After vortexing, two phases were separated by centrifugation at 2,000×gfor 5 min. The lower phase containing the chloroform fraction was transferred to scintillation vials, dried, and counted for radioactivity to determine the incorpo- ration ofL-[3H]serine into PS.
Live-Cell Imaging.After 24–48 h of transfection, cells on glass coverslips were subjected to washing with modified Krebs–Ringer buffer (see above), and the coverslips were mounted to a metal chamber (Atto, Invitrogen). The cells were observed at room temperature in 1 mL of Krebs–Ringer solution. Confocal images were obtained with a Zeiss laser confocal microscope (LSM 510, 710, or 780, Carl Zeiss MicroImaging). For TIRF microscopy, the Nikon Ti-E inverted microscope, equipped with a spinning disk and TIRF acquisition, was used.
BRET Measurement.HEK293-AT1 cells were seeded and transfected as de- scribed inSI Materials and Methods. Twenty-four hours after transfection, cells were washed once with modified Krebs–Ringer buffer and incubated
with Krebs–Ringer buffer (50μL/well) at 37 °C for 30 min before measuring at room temperature. Coelenterazine h, a luciferase substrate, was then added in a 40-μL volume (final concentration 5μM), and the plates were subjected to base-line measurement for 4 min (1 min/cycle, four cycles). After base-line measurement, cells were treated with A1 (final concentration 30 nM) added in 10μL of Krebs–Ringers buffer, and the measurement was continued for 60 min (1 min/cycle, 60 cycles) in a Tristar2 LB 942 Multimode Microplate Reader (Berthold Technologies). Emission filters (540/40 nm and 475/20 nm) were used for Luciferase and Venus fluorescence, respectively.
Quantitative Real-Time PCR Analysis.HEK293-AT1 cells were seeded onto poly- lysine–coated 12-well tissue culture plates and transfected with GFP, PSS1 (WT)-GFP, or PSS1(P269S)-GFP plasmid DNA. After 2 d, total RNA was extracted with an RNeasy mini kit (Qiagen). Following cDNA synthesis, the analysis was performed as described inSI Materials and Methods.
ACKNOWLEDGMENTS.This work was supported in part by the intramural research program of the Eunice Kennedy Shriver National Institute of Child Health and Human Development at the National Institutes of Health. The work from the H.A.B. laboratory was supported partly by the Bixler Johnson Mayes Endowed Chair and the Vanderbilt Institute of Chemical Biology. P.V.
was supported by the National Research, Development, and Innovation Fund (Grant NKFI K105006).
1. Stefan CJ, Manford AG, Emr SD (2013) ER-PM connections: Sites of information transfer and inter-organelle communication.Curr Opin Cell Biol25(4):434–442.
2. Lahiri S, Toulmay A, Prinz WA (2015) Membrane contact sites, gateways for lipid homeostasis.Curr Opin Cell Biol33:82–87.
3. Lev S (2010) Non-vesicular lipid transport by lipid-transfer proteins and beyond.Nat Rev Mol Cell Biol11(10):739–750.
4. Lenz WD, Majewski F (1974) A generalized disorders of the connective tissues with progeria, choanal atresia, symphalangism, hypoplasia of dentine and craniodiaphy- seal hypostosis.Birth Defects Orig Artic Ser10(12):133–136.
5. Robinow M, Johanson AJ, Smith TH (1977) The Lenz-Majewski hyperostotic dwarfism.
A syndrome of multiple congenital anomalies, mental retardation, and progressive skeletal sclerosis.J Pediatr91(3):417–421.
6. Sousa SB, et al. (2014) Gain-of-function mutations in the phosphatidylserine synthase 1 (PTDSS1) gene cause Lenz-Majewski syndrome.Nat Genet46(1):70–76.
7. Chung J, et al. (2015) INTRACELLULAR TRANSPORT. PI4P/phosphatidylserine coun- tertransport at ORP5- and ORP8-mediated ER-plasma membrane contacts.Science 349(6246):428–432.
8. Moser von Filseck J, et al. (2015) INTRACELLULAR TRANSPORT. Phosphatidylserine transport by ORP/Osh proteins is driven by phosphatidylinositol 4-phosphate.Science 349(6246):432–436.
9. Balla T (2013) Phosphoinositides: Tiny lipids with giant impact on cell regulation.
Physiol Rev93(3):1019–1137.
10. Blagoveshchenskaya A, et al. (2008) Integration of Golgi trafficking and growth factor signaling by the lipid phosphatase SAC1.J Cell Biol180(4):803–812.
11. Kim YJ, Hernandez ML, Balla T (2013) Inositol lipid regulation of lipid transfer in specialized membrane domains.Trends Cell Biol23(6):270–278.
12. Bojjireddy N, et al. (2014) Pharmacological and genetic targeting of the PI4KA en- zyme reveals its important role in maintaining plasma membrane phosphatidylino- sitol 4-phosphate and phosphatidylinositol 4,5-bisphosphate levels.J Biol Chem 289(9):6120–6132.
13. Kuge O, Hasegawa K, Saito K, Nishijima M (1998) Control of phosphatidylserine biosynthesis through phosphatidylserine-mediated inhibition of phosphatidylserine synthase I in Chinese hamster ovary cells.Proc Natl Acad Sci USA95(8):4199–4203.
14. Kay JG, Koivusalo M, Ma X, Wohland T, Grinstein S (2012) Phosphatidylserine dy- namics in cellular membranes.Mol Biol Cell23(11):2198–2212.
15. Tóth JT, et al. (2016) BRET-monitoring of the dynamic changes of inositol lipid pools in living cells reveals a PKC-dependent PtdIns4P increase upon EGF and M3 receptor activation.Biochim Biophys Acta1861(3):177–187.
16. Zhong S, et al. (2012) Allosteric activation of the phosphoinositide phosphatase Sac1 by anionic phospholipids.Biochemistry51(15):3170–3177.
17. Hammond GR, Schiavo G, Irvine RF (2009) Immunocytochemical techniques reveal multiple, distinct cellular pools of PtdIns4P and PtdIns(4,5)P(2).Biochem J422(1):
23–35.
18. Hankins HM, Baldridge RD, Xu P, Graham TR (2015) Role of flippases, scramblases and transfer proteins in phosphatidylserine subcellular distribution.Traffic16(1):35–47.
19. de Saint-Jean M, et al. (2011) Osh4p exchanges sterols for phosphatidylinositol 4-phosphate between lipid bilayers.J Cell Biol195(6):965–978.
20. Mesmin B, et al. (2013) A four-step cycle driven by PI(4)P hydrolysis directs sterol/PI(4)P exchange by the ER-Golgi tether OSBP.Cell155(4):830–843.
21. Hanada K, et al. (2003) Molecular machinery for non-vesicular trafficking of ceramide.
Nature426(6968):803–809.
22. D’Angelo G, et al. (2007) Glycosphingolipid synthesis requires FAPP2 transfer of glucosylceramide.Nature449(7158):62–67.
23. Tani M, Kuge O (2014) Involvement of Sac1 phosphoinositide phosphatase in the metabolism of phosphatidylserine in the yeast Saccharomyces cerevisiae.Yeast31(4):
145–158.
24. Balla A, et al. (2008) Design of drug-resistant alleles of type-III phosphatidylinositol 4-kinases using mutagenesis and molecular modeling.Biochemistry47(6):1599–1607.
25. Bligh EG, Dyer WJ (1959) A rapid method of total lipid extraction and purification.
Can J Biochem Physiol37(8):911–917.
26. Nakanishi S, Catt KJ, Balla T (1995) A wortmannin-sensitive phosphatidylinositol 4-kinase that regulates hormone-sensitive pools of inositolphospholipids.Proc Natl Acad Sci USA92(12):5317–5321.
27. Nishijima M, Kuge O, Maeda M, Nakano A, Akamatsu Y (1984) Regulation of phos- phatidylcholine metabolism in mammalian cells. Isolation and characterization of a Chinese hamster ovary cell pleiotropic mutant defective in both choline kinase and choline-exchange reaction activities.J Biol Chem259(11):7101–7108.
28. Yeung T, et al. (2008) Membrane phosphatidylserine regulates surface charge and protein localization.Science319(5860):210–213.
29. Hammond GR, Machner MP, Balla T (2014) A novel probe for phosphatidylinositol 4-phosphate reveals multiple pools beyond the Golgi.J Cell Biol205(1):113–126.
30. Ivanova PT, Milne SB, Byrne MO, Xiang Y, Brown HA (2007) Glycerophospholipid identification and quantitation by electrospray ionization mass spectrometry.
Methods Enzymol432:21–57.
31. Myers DS, Ivanova PT, Milne SB, Brown HA (2011) Quantitative analysis of glycer- ophospholipids by LC-MS: Acquisition, data handling, and interpretation.Biochim Biophys Acta1811(11):748–757.
BIOCHEMISTRY