Methodological and physiological aspects of exhaled breath analysis
PhD thesis
András Bikov
Doctoral School of Clinical Medicine Semmelweis University
Supervisor: Dr. Ildikó Horváth, professor, D.Sc.
Official reviewers:
Dr. Zoltán Novák, associate professor, Ph.D.
Dr. Gábor Pavlik, professor, D.Sc.
Head of the Final Examination Committee:
Dr. Endre Cserháti, professor, D.Sc.
Members of the Final Examination Committee:
Dr. Györgyi Mezei, assistant professor, Ph.D Dr. Andor Hirschberg, chief physician, Ph.D
Budapest, 2013
1
Table of Contents
1. List of Abbreviations ... 5
2. Introduction ... 7
2.1. The potential of exhaled breath analysis in medicine ... 7
2.2. Composition of human breath and its clinical relevance ... 8
2.3. Exhaled breath condensate (EBC) ... 9
2.3.1. EBC pH ... 10
2.4. Exhaled volatile compounds ... 12
2.4.1. Measurement of exhaled breath volatile compound patterns ... 13
2.4.1.1. The use of E-noses in medicine ... 15
2.4.1.2. Cyranose 320 in breath research ... 15
2.4.1.3. The current status of exhaled breath analysis using Cyranose 320 electronic nose ………...……….……….……..………. 20
2.4.2. Effect of physical exercise on exhaled volatile compounds ………..…. 24
2.4.3. Effect of pregnancy on exhaled volatile compounds………... 25
3. Objectives ... 26
3.1. The effect of respiratory droplet dilution on EBC pH ... 26
3.2. Reproducibility of Cyranose 320 measurements ... 26
3.3. EBC pH and exhaled volatile compound pattern during physical exercise ... 26
3.4. Effect of physiological pregnancy on exhaled breath volatile compounds ... 26
4. Methods ... 28
4.1. The effect of respiratory droplet dilution on exhaled breath condensate pH ... 28
4.1.1. Study design ... 28
4.1.2. Study subjects ... 28
4.1.3. Exhaled breath condensate pH measurements... 29
2
4.1.4. Exhaled breath condensate dilution factor measurements ... 29
4.1.5. Statistical analysis ... 29
4.2. Reproducibility of Cyranose 320 measurements ... 30
4.2.1. Study design and subjects ... 30
4.2.2. Exhaled breath collection and measurements ... 30
4.2.3. Statistical analysis ... 31
4.3. EBC pH and exhaled volatile compound pattern during physical exercise ... 32
4.3.1. Study design ... 32
4.3.2. Study subjects ... 32
4.3.3. Exhaled breath volatile compounds collection and analysis ... 32
4.3.4. Exhaled breath condensate collection and pH analysis ... 33
4.3.5. Lung function ... 33
4.3.6. Statistical analysis ... 33
4.4. Exhaled breath volatile compound pattern (“breathprint”) during pregnancy. 33 4.4.1. Study design ... 33
4.4.2. Study subjects ... 34
4.4.3. Exhaled breath collection and analysis ... 35
4.4.4. Statistical analysis ... 35
5. Results ... 36
5.1. Effect of respiratory droplet dilution on EBC pH ... 36
5.1.1. The effect of vacuum evaporation on NH4OH and EBC conductivity... 36
5.1.2. EBC pH ... 36
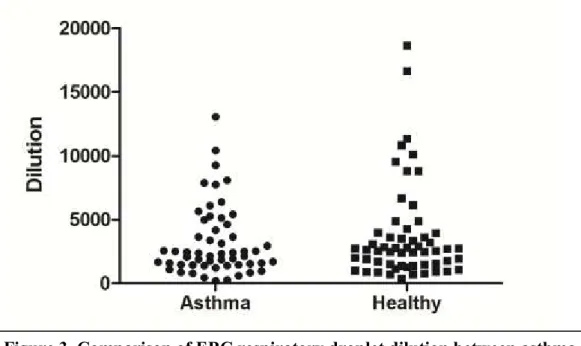
5.1.3. Respiratory droplet dilution ... 37
5.1.4. Relationship between EBC pH and respiratory droplet dilution ... 37
5.1.5. Relationship between EBC pH and clinical variables ... 38
5.2. Reproducibility of Cyranose 320 measurements ... 38
3
5.2.1. Short-term variability of Cyranose 320 measurements ... 38
5.2.2. Long-term variability of Cyranose 320 measurements ... 40
5.3. EBC pH and exhaled volatile compound pattern during physical exercise ... 41
5.3.1. Effect of physical exercise on volatile compound pattern ... 41
5.3.2. Effect of exercise on EBC pH ... 42
5.3.3. Relationship between exhaled breath volatile compounds and EBC pH . 42 5.4. Exhaled breath volatile compound pattern during pregnancy ... 43
5.4.1. Comparison of breathprints in pregnant and non-pregnant subjects ... 43
5.4.2. The relationships between the breathprint and gestational age or the day and phase of menstrual cycle ... 44
5.4.3. Validation part ... 45
6. Discussion ... 47
6.1. The effect of respiratory droplet dilution on exhaled breath condensate pH ... 47
6.2. Reproducibility of Cyranose 320 measurements ... 48
6.3. EBC pH and exhaled volatile compound pattern during physical exercise ... 49
6.4. Exhaled breath volatile compound pattern during pregnancy ... 51
7. Conclusions ... 55
7.1. The effect of respiratory droplet dilution on exhaled breath condensate pH ... 55
7.2. Reproducibility of Cyranose 320 measurements ... 55
7.3. EBC pH and exhaled volatile compound pattern during physical exercise ... 55
7.4. Exhaled breath volatile compound pattern during pregnancy ... 55
8. Summary ... 56
9. Összefoglalás ... 57
10. Bibliography ... 58
11. The bibliography of the candidate’s publications ... 77
11.1. Publications related to the theme of the PhD thesis ... 77
4
11.2. Other publications ... 77 12. Acknowledgements ... 80
5
1. List of Abbreviations
ALF airway lining fluid
ANOVA analysis of variance
CF cystic fibrosis
cmH2O centimetre of water
CO carbon monoxide
CO2 carbon dioxide
COPD chronic obstructive pulmonary disease
EBC exhaled breath condensate
EIB exercise-induced bronchoconstriction
E-nose electronic nose
FENO fractional exhaled nitric oxide
FEV1 forced expiratory volume in 1 second
FVC forced vital capacity
GC-MS gas-chromatography mass-spectrometry
GINA global initiative for asthma
ICS inhaled corticosteroid
ILD interstitial lung disease
HLA human leukocyte antigen
H2O2 hydrogen peroxide
H2S hydrogen sulphide
kPa kilopascal
L/min litre/minute
Mbar millibar
MHC major histocompatibility complex
mL/sec millilitre/second
µL microlitre
mM millimole/Litre
µM micromole/Litre
µS/cm micro Siemens/centimetre
N2 nitrogen
6
NH3 ammonia
NH4+ ammonium ion
NH4OH ammonium hydroxide
O2 oxygen
OSA obstructive sleep apnoea
PC principal component
Ppb particles per billion
Ppm particles per million
Ppt particles per trillion
PTR-MS proton-transfer-reaction mass-spectrometry
SD standard deviation
SEM standard error of the mean
VOC volatile organic compound
7
2. Introduction
2.1. The potential of exhaled breath analysis in medicine
Acute and chronic disorders of human body represent huge financial burden on governmental budgets. Primary, secondary and tertiary prevention are suggested to reduce the risks, the occurrence and complications of disorders. For this purpose, the identification of biomarkers which are robust and could be easily measured is warranted. In addition, for screening purposes the measurements must be cheap, preferably non-invasive or exert limited side effects. Exhaled breath analysis has a unique advantage that it is completely non-invasive therefore carry no risks for side effects.
The examination of diseases by smelling the breath has been widely used in general medicine since ancient times, as it is well known that certain disorders such as uncontrolled diabetes, liver and renal failure, lung abscess, and diseases of the oral cavity are accompanied with an unpleasant breath.
The sensitive olfaction of animals has been long exploited in various walks of life including medicine. It is widely known, that dogs are able to identify individuals or track drugs and explosive chemicals by their scent [1], while honeybees can detect land mines using their smell [2]. Dogs could distinguish breath samples of patients with lung cancer with a sensitivity and specificity of 99 and 99 percents, respectively [3].
Interestingly, in the same experiment canine smell could discriminate breast cancer with 88% sensitivity and 98% specificity [3]. In another study, dogs could identify colorectal cancer in breath samples with a sensitivity of 97% and 99% [4]. However, in a larger cohort of subjects (N=220) dogs were able to discriminate lung cancer breath samples from healthy individuals and patients with chronic obstructive pulmonary disease (COPD), but the sensitivity and specificity (71% and 93%, respectively) were moderate [5]. Although the use of animals in early cancer detection would be desirable because of the promising results, one possible limitation of animals is that their olfaction depends on their behaviour, species and exhaustion [6]. The inter-assay variability of animals is also poorer than that of machines, but the most considerable peril is that animals cannot provide a quantitative measure.
8
The principles of the modern machine-based human breath analysis were established by Linus Pauling et al. who identified numerous volatile substances in exhaled breath and suggested that the analysis of volatile compounds may have a diagnostic value in identifying disorders [7].
Breath analysis has an advantage over liquid biological matrices such as blood, sputum, urine or sweat that the liberation of volatile particles is not necessary and the time consuming preparations can be avoided. It is not invasive, hence has no side effects and the sampling does not influence the levels of body mediators per se.
However, the number of available breath measurements in clinical practice is limited.
One possible explanation for this can be that the biological role and function of exhaled particles are not fully known. This is essential if we want to consider them as surrogate markers for a specific condition. A further reason for the limited use of breath tests is the lack of methodological studies including the assessment of physiological and methodological factors which can influence breath composition.
2.2. Composition of human breath and its clinical relevance
Human breath consists of thousands of molecules with various origins. Some of them are inhaled from the environment and exhaled immediately or are taken up by the body and expired later after diffusion through the alveolar membrane. Other compounds which are produced and metabolised in the body may be excreted through the alveoli.
Breath biomolecules are also generated in the airway tract. Their production is associated with local cell metabolism and oxidative stress in addition to the airway inflammation.
The most prominent molecule in exhaled breath is the inert nitrogen (N2) gas. In atmospheric ambient pressures it does not diffuse through the alveolar membrane, and the assessment of its levels in exhaled breath can be used to estimate dead-space and ventilation heterogeneity in the airway tract [8, 9].
The simultaneous measurement of oxygen (O2) with parallel of carbon dioxide (CO2) might reveal the metabolic state of the human body and provide an important estimate about exercise capacity [10].
Exhaled breath also contains a high but variable amount of water. The scientific importance of this fact became evident when Sidorenko successfully condensed exhaled vapour and measured non-volatile, but water-soluble substances in exhaled breath
9
condensate (EBC) [11]. The measurement of molecules in EBC was proven to be very promising in the assessment of the airways pathology [12].
Exhaled ammonia [13], acetone [14], and sulphur-containing compounds [15], such as hydrogen sulphide (H2S) are measured in lower levels (ppm-particles per million) and related to the function of kidneys, pancreas and liver. Furthermore, exhaled H2
measurements have been applied for the diagnosis of carbohydrate malabsorption [16], and 13/14C-urea breath test is widely used for detection of Helicobacter pylori infections in the gut [17].
Exhaled carbon monoxide (CO) is found in around 1-10 ppm concentrations and it increases with upregulation of the heme oxygenase expression in the airways [18], therefore its breath levels are elevated in smokers and patients with airways disease [19].
The concentration of exhaled nitric oxide is measured in ppb (particles per billion) and it is elevated in atopic diseases, including asthma and allergic rhinitis [19]. It took nearly two decades following introduction that fractional exhaled nitric oxide (FENO) measurement became the part of asthma guidelines. The role of FENO is established in asthma management as it is a non-invasive marker for eosinophilic airway inflammation and it is related to treatment responsiveness.
Exhaled breath further contains thousands of molecules which are found mainly in the ppb-ppt (particles per trillion) range. These organic molecules, called volatile organic compounds (VOCs) became of particular interest in the last three decades, as their quality and quantity change in several systemic and respiratory disorders, and VOC measurements might aid the early detection of respiratory disorders such as lung cancer [20].
Other modalities of exhaled breath can be also investigated. For instance, exhaled breath temperature is suggested as a surrogate marker for bronchial blood flow [21], and was found altered in airway disease [22, 23].
Two modalities of breath analysis, EBC and measurements of VOCs, which were applied in the presented Ph.D work, are further detailed in the forthcoming sections.
2.3. Exhaled breath condensate (EBC)
A possible approach to measure non-volatile compounds of the airway lining fluid (ALF) is to condense the moisture of exhaled breath. During 5-10 minutes of tidal
10
breathing, small droplets arise from the ALF and condense while directed through a cooled chamber [12]. During this process, water-soluble molecules dissolve into the forming condensate fluid. However, exhaled breath condensate (EBC) contains not only non-volatile molecules released from the ALF. Other, volatile molecules, such as ammonia may also dissolve into EBC depending on their water-solubility. Although, unfortunately, the upper airway origin of some molecules cannot be completely excluded, it was shown that EBC samples usually do not contain amylase, which suggests that salivary droplets are not mixed with condensate fluid [24]. In addition, as the ratio of water vapour diluting the ALF droplets is unpredictable, a dilution indicator has also to be estimated to predict the ALF concentration of a certain molecule from its EBC levels [25].
Nevertheless, EBC can give an idea of airway inflammatory processes, and various biomarkers have been analysed successfully in EBC previously, including its pH [26- 28], ammonia [26], lipid mediators [29], adenosine triphosphate [24, 30], hydrogen peroxide [31], proteins [32, 33], etc. However, due to some methodological pitfalls, this technique is not ready for the daily clinical use, yet [12].
2.3.1. EBC pH
Impaired regulation of airway acid-base status plays an important role in the pathophysiology of airway diseases. Low airway pH was associated with bronchoconstriction [34], impaired ciliary function [35] and enhanced airway inflammation [36]. Therefore, it is not surprising that one of the most studied biomarker in EBC is pH. Acidity is relatively easy to estimate by the means of indicator dyes, pH- probes or blood-gas analyser. Furthermore, contrarily to other analytical methods for other markers where applicability in EBC is restricted by limited assay sensitivity, condensate pH is reliably measured with current methods. Indeed, pioneer studies found low EBC pH associated with various respiratory disorders, including asthma, COPD and cystic fibrosis (CF) [37]. Therefore, the assessment of airway pH using a non- invasive method became of interest.
EBC pH might be a non-invasive marker for airway acidification; however it is influenced by numerous physiological factors. Firstly, as EBC is a very dilute liquid, its pH is strongly affected by the end-tidal CO2 concentration. As the latter may vary between collections depending on systemic metabolic (exercise, digestion) or
11
pathological (respiratory failure) factors, neat EBC pH may not fully represent the intrathoracic airway pH. In addition, room CO2 can modify EBC pH very rapidly, which tends to increase in untreated samples as the post collection EBC CO2 (5%) starts to equilibrate with the atmospheric CO2 (approximately 0.03 %). The effect of CO2 can be reduced by two main methods; CO2 can be flushed away by purging with an inert gas (argon or nitrogen) [26] or EBC can be loaded with CO2 gas, thus titrating the sample.
The latter, CO2-loading method is more accurate; however its use is limited by the availability of special blood-gas analysers capable to measure in the range of 5.5-7.5 pH [28].
Secondly, EBC pH may be influenced by volatile acids and bases which dissolve into the generated condensate fluid throughout the respiratory tract, including the oral cavity.
The importance of one particular volatile base, the ammonia was highlighted by Effros et al. The authors suggested that as ammonia is the main anion in EBC and it is predominantly produced orally, EBC pH cannot represent airway pH [25]. On response, Wells et al. showed that high EBC ammonia is not necessary for high EBC pH [26].
The importance of volatile acids and bases and their effect on EBC pH are still controversial.
A third, previously not investigated factor is the influence of respiratory droplet dilution on EBC pH. It is well known, that the amount of airway water diluting respiratory particles is variable and the adjustment to respiratory droplet dilution may more precisely estimate mediator concentrations in the airways from the EBC levels [25]. For this a dilution indicator is needed, which is measurable in condensate fluid and has a known concentration in the airways. As the airway lining fluid is theoretically isotonic and the diluting water contains no ions, the measurement of non-volatile individual ions or net conductivity may provide the dilution of liberated AFL droplets in EBC. Our workgroup has previously developed and validated a method to estimate dilution factor based on the conductivity measurements of vacuum-treated samples [24, 30]. Although the airway levels of some specific, non-volatile molecules can easily be calculated from EBC concentrations, the utility of such a method to derive airway pH from EBC pH is ambiguous. There are three main reasons for this; firstly, EBC pH is not only determined by the pH of ALF droplets but also by volatile acids and bases. Secondly, contrarily to other metabolites, pH is expressed on a logarithmic scale, therefore
12
calculations involving dilution factor may be more complicated. Thirdly, in proximal gastric reflux, gastric particles with low pH may mix with EBC droplets in the pharynx and oral cavity, increasing its acidity. However, it would be still important to study the potential influence of dilution factor on EBC pH.
2.4. Exhaled volatile compounds
Apart from non-volatile molecules, exhaled breath contains thousands of volatile particles. It is known that some of them are not only inactive derivates of systemic and airway processes but also have an active biological role. For instance, nitric oxide and carbon monoxide, markers of airway inflammation and oxidative stress, act on airway smooth muscles [19]. Breath H2S levels have been associated with oral and hepatic malodour for a long time [15]. Recently, this molecule has become of certain interest as a biological transmitter and it is suggested to play a role in neutrophil involvement in the airways [38]. However, the biological function of most volatile compounds is still unclear. They may be active or inactive metabolites of inflammatory and oxidative stress-related processes. Therefore, the analysis of those molecules may be even more promising as their levels are associated with accelerated systemic and airway metabolism and oxidative stress. It is not surprising that altered compositions of volatile compounds were found in various systemic (diabetes, liver and renal failure) and respiratory (asthma, COPD, lung cancer) disorders. The analytical approaches to measure volatile compounds developed in two main ways. On one hand, a possible technique is to measure only one particular molecule, thus increasing the specificity of the measurement. The measurement of exhaled monoxides, such as carbon monoxide or nitric oxide is now routinely used in respiratory medicine [19, 39]. Exhaled breath ethane was related to airways oxidative stress, and elevated levels of exhaled ethane were found in asthma [40], COPD [41], CF [42], and interstitial lung diseases (ILDs) [43]. In non-respiratory medicine, exhaled ethanol is utilised as a surrogate marker for high blood alcohol [44], and the analysis of exhaled acetone might be useful for the assessment of uncontrolled diabetes [14].
On the other hand, complex systemic processes modify several different pathophysiological pathways, hence they cannot be analysed completely at the levels of single molecules. In addition, small changes during physiological processes can be hidden because of analytical or statistical factors, while analysing the pattern of
13
molecules together using powerful bioinformatics might reveal miniscule, but still important alterations. Finally, multivariate statistical approaches might also identify casual relationships between molecules contrarily to univariate methods which can only describe associations. The idea of “omics” technology in breath (breathomics) originates from Pauling et al. who suggested that the pattern of exhaled metabolites (metabolomics) can be specifically related to a disorder [7]. Pattern analysis of molecules in exhaled breath is frequently performed in medical research and the wide spectrum of analytical techniques covers highly sophisticated methods.
2.4.1. Measurement of exhaled breath volatile compound patterns
There are various methods available to analyse the volatile substance composition of exhaled breath. The coupling of gas chromatography (GC) with mass spectrometry (MS) is the gold-standard approach. However, this technique is expensive and requires special analytical knowledge; therefore these devices are settled in special laboratories.
The main advantage of GC-MS is that it identifies and quantifies molecules with high selectivity. Contrarily, its main disadvantage is that it is applicable in static or very slowly changing gas mixtures. Mass spectrometers use electric impact ionisation;
however without coupling with GC they have lower specificity for molecules compared to GC-MS. Still, they are cheaper, require less space and their use is relatively easier than GC-MS. Proton-transfer-reaction mass-spectrometers (PTR-MS) are more specific approaches compared to MS. Instead of electric ionisation, PTR-MS uses chemical ionisation with H3O+. H3O+ ions reacts only with molecules which have larger proton affinities than H2O, thus primary molecules of exhaled breath (O2, N2, CO2) do not produce signal. In addition, the technique allows rapid measurement, therefore applicable for on-line breath analysis [45].
The electronic nose (E-nose) is a composite of sensor arrays which mimics the discrimination of the mammalian olfactory system [6]. It is known that the mammalian olfactory organ consists of an array of cross-reactive receptors, in which each odorant molecule induces a response; hence each receptor reacts to a mixture of molecules [46, 47]. Similarly to mammalian noses, E-noses also use cross-reactive sensors in addition to a pattern recognition method [47]. It should be noted that E-noses cannot quantify or qualify the molecules of the analysed gas mixtures but able to distinguish two gas composites based on the pattern of substances. The main advantages of E-nose
14
technology over more sophisticated techniques, such as GC-MS, that it is relatively cheap, hand-held and easy-to-use. The application field of these devices is not limited to the medical research, but they can be found also in military, security, food processing approaches [6].
Although the method is theoretically similar to the human nose, there are some differences between the two. Firstly, it is known that the electronic nose is less specific for odorant substances, as a highest specificity demands irreversible interaction between the receptor and the molecule. Human nasal receptors; therefore have a lifetime of a few weeks [48]. Secondly, the selectivity of electronic nose for volatile molecules from human nose is different, as the latter is known to be insensitive for some molecules which are found in high concentrations in the ambient air, such as carbon dioxide or water vapour [6]. This represent a considerable challenge for the technique, as electronic noses may have difficulties to differentiate the signal molecules from the background noise. The selectivity of E-noses for volatile compounds is determined by the material of the in-built sensors.
Numerous E-noses with different working principles are currently available. The idea for the E-nose approach was first introduced by Dodd and Persaud who used three different metal oxide sensors to identify volatile substances [49]. In another setup, optical sensor systems are based on the modulation of light properties such as the absorbance of the target gas [50]. Ion mobility spectrometry separates the molecules based on the principles of their ion mobilites [51]. Infrared spectroscopy applies molecular vibrations and the absorption of them is characteristic for different molecules [52]. Conducting polymer sensor arrays are based on electrical resistance changes from steady-state induced by the volatile particle attachment to the sensor [47]. Thermal and gravimetric sensor arrays are also known [53]. It is also possible to combine these techniques with each other or with GC-MS. Although this increases the sensitivity and selectivity of volatile compounds measurements, the methods would become more complicated and expensive, while the main advantage of the E-nose principle is its easy usability.
Still, the most criticized point of the E-nose use in breath research is that the equipments provide an unspecific signal. Without the definite knowledge of which volatile compounds are related to the signal pattern, the differences in E-nose results between
15
health and disease may be false. For instance, marked alterations in exhaled breath of lung cancer patients might be associated not with the disease itself, but with behavioural (cigarette smoking), environmental (passive smoking) or methodological (different breathing technique) issues.
While the E-nose studies carried out on exhaled breath samples seem promising, unfortunately less is known about certain methodological and physiological factors which may influence the results.
2.4.1.1. The use of E-noses in medicine
E-noses were used in the identification of infections, such as ulcers [54], bacterial vaginosis [55-57], urinary tract infections [58, 59], upper airway infections [60, 61], pulmonary tuberculosis [62, 63]. Altered exhaled breath volatile compound profiles (“breathprints”) were associated with diabetes [64], renal [65], hepatic [66] and heart [67] diseases, during heart rejection [68] and breast cancer [69]. In respiratory medicine E-noses were able to discriminate breath samples of lung cancer [70-72], malignant mesothelioma [73, 74], asthma [75-77], COPD [76], sarcoidosis [78], Alpha 1- antitrypsin deficient [79] patients or those with pulmonary embolism [80] from healthy subjects.
2.4.1.2. Cyranose 320 in breath research
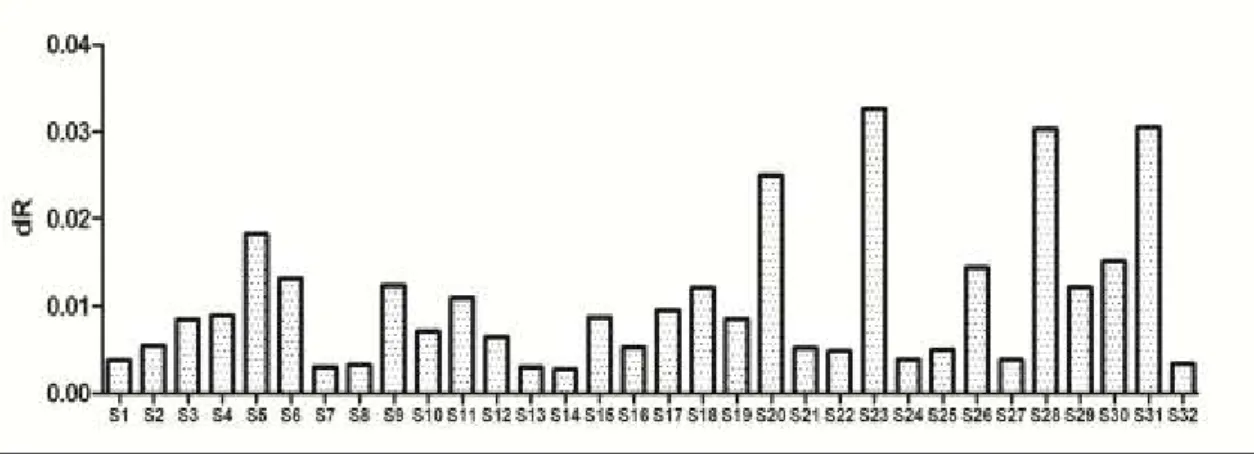
The Cyranose 320 is a conducting polymer sensor array containing 32 carbon black sensors. During the measurement, an in-built pump is sucking the sample, and volatile molecules of the specimen attach to the surface of the polymer and induce swelling of the polymer film. The swelling increases the electrical resistance of the composite which generates an electrical signal. Different molecules produce specific responses based on their chemical features including molecular shape, size, volume, dipole moment and hydrogen bonding capacity [47]. It was shown that the sensor responses are linearly related to the concentration of the volatile substance [81] and independent from the background [82]. An example for a Cyranose 320 reading on a breath sample is shown on Figure 1.
16
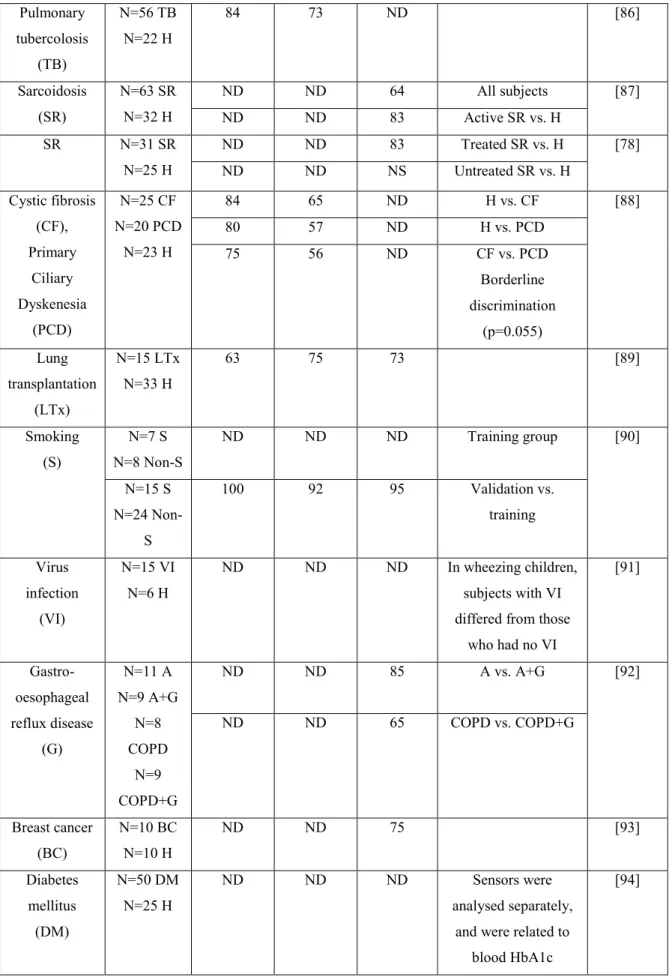
Cyranose 320 is the most widely used E-nose in respiratory medicine. Most notably, Cyranose 320 was chosen among the analytical techniques which are used in an ongoing European Union Innovative Medicine Initiative cohort, the U-BIOPRED which aims to identify biomarkers for severe asthma [83]. The results of studies using this equipment in breath research are summarised in Table 1.
Disease Number of subjects
Sensitivity (%)
Specificity (%)
Cross- validation value (%)
Remarks Reference
Lung Cancer (LC)
N=62 LC N=14 no
LC
71 92 ND LC patients had more
severe smoking history compared to
controls
[70]
LC N=10 LC
N=10 COPD N=10 H
ND ND 85 LC vs. COPD [71]
80 LC vs. H
Malignant mesothelioma
(MM)
N=13 MM N=13 asbestosis
N=13 H
92 86 81 MM vs. asbestosis [73]
92 69 85 MM vs. H
Figure 1. An example for a signal pattern obtained with Cyranose 320 in a breath sample of a healthy volunteer (own data)
Exhaled breath volatile substances induce responses (changes in resistance, dR) in each sensor (S 1-32). The signal is calculated by using the following formula: dR=
(Rs-R)/R, where Rs is the response to the sampled gas and R is the response to the background gas (baseline reading).
17
MM N=20 MM
N=42 H
90 91 90 The discrimination
was less accurate when patients with
asbestosis (N=20) were included
[74]
Asthma (A)
N=20 A N=20 H
ND ND 100 N=10 mild A vs.
N=10 young H
[75]
ND ND NS N=10 severe A
vs. N=10 old H Asthma,
COPD, Smoker (S)
N=20 A N=30 COPD N=20 non-
S N=20 S
ND ND 96 A vs. COPD [76]
ND ND 95 A vs. non-S
ND ND 93 A vs. S
ND ND 66 COPD vs. S
ND ND NS COPD vs. non-S
Asthma, COPD
N=60 A N=40 COPD
85 90 88 COPD vs.
fixed A (N=21)
[84]
91 90 83 COPD vs. reversible
A (N=39) Alpha 1-
antitripsin deficiency (AAT)
N=10 COPD with AAT
N=23 COPD without AAT N=10 H
ND ND 82 AAT vs. non-AAT [79]
ND ND 81 non-AAT vs. H
ND ND 60 AAT vs. H
Pulmonary embolism
(PE)
N=20 PE N=20 non-
PE
ND ND NS Patients with
comorbidities
[80]
ND ND 85 Patients without
comorbidities Obstructive
sleep apnoea (OSA)
N=28 OSA N=10 H
93 70 80 [85]
18
Pulmonary tubercolosis
(TB)
N=56 TB N=22 H
84 73 ND [86]
Sarcoidosis (SR)
N=63 SR N=32 H
ND ND 64 All subjects [87]
ND ND 83 Active SR vs. H
SR N=31 SR
N=25 H
ND ND 83 Treated SR vs. H [78]
ND ND NS Untreated SR vs. H
Cystic fibrosis (CF), Primary
Ciliary Dyskenesia
(PCD)
N=25 CF N=20 PCD
N=23 H
84 65 ND H vs. CF [88]
80 57 ND H vs. PCD
75 56 ND CF vs. PCD
Borderline discrimination
(p=0.055) Lung
transplantation (LTx)
N=15 LTx N=33 H
63 75 73 [89]
Smoking (S)
N=7 S N=8 Non-S
ND ND ND Training group [90]
N=15 S N=24 Non-
S
100 92 95 Validation vs.
training
Virus infection
(VI)
N=15 VI N=6 H
ND ND ND In wheezing children, subjects with VI differed from those
who had no VI
[91]
Gastro- oesophageal reflux disease
(G)
N=11 A N=9 A+G
N=8 COPD
N=9 COPD+G
ND ND 85 A vs. A+G [92]
ND ND 65 COPD vs. COPD+G
Breast cancer (BC)
N=10 BC N=10 H
ND ND 75 [93]
Diabetes mellitus (DM)
N=50 DM N=25 H
ND ND ND Sensors were
analysed separately, and were related to
blood HbA1c
[94]
Table 1. Clinical studies conducted on human breath samples using Cyranose 320.
19
A-asthma, AAT- Alpha 1-antitripsin deficiency, BC-breast cancer, CF-cystic fibrosis, COPD-chronic obstructive pulmonary disease, DM-diabetes mellitus, G-gastro- oesophageal reflux disease, H-healthy, LC-lung cancer, LTx-Lung transplantation, MM- malignant mesothelioma, ND-not determined, NS-not significant, OSA-obstructive sleep apnoea, PCD-primary ciliary dyskenesia, PE-pulmonary embolism, S-smoker, SR-sarcoidosis, VI-virus infection
In line with the E-nose technology, Cyranose 320 applies an unspecific approach for volatile substance measurement and compares volatile compound patterns (“breathprints”) rather than individual molecules. Still, it would be important to know what molecules are measured during E-nose analysis. This depends on the quantities and qualitative characteristics of volatile substances.
A moderately sensitive lower detection limit of the carbon black polymers (0.1-100 ppm depending on the water vapour content of the specimen was previously estimated for various volatile substances such as organic acids (including n-propanoic acid, n- butanoic acid, n-pentanoic acid, n-hexanoic acid, n-heptanoic acid, isobutanoic acid, isopentanoic acid and isohexanoic acid), alcohols (including ethanol, 1-propanol, 1- butanol, 1-pentanol, 1-hexanol, 1-heptanol, 1-octanol, 2-pentanol and 3-pentanol), esters (including isopentyl acetate, isopentyl propionate, isopentyl butanoate, isopentyl pentanoate, isopentyl hexanoate, ethyl acetate, n-propyl acetate, n-butyl acetate, n- pentyl acetate, n-hexyl acetate, n-octyl acetate, n-decyl acetate, isopropyl acetate and isobutyl acetate) and alkanes (including n-pentane, n-hexane, n-heptane, n-octane and n- nonane) [95, 96]. Very similar detection limits were found recently for ethanol (0.1 ppm), ethyl acetate (0.26 ppm) and hexane (0.25 ppm) [97]. Using their in house produced carbon black sensors similar to those in Cyranose 320, Kang et al. found similar lower detection limits for some typical breath VOCs, including acetic acid (0.1 ppm), toluene (1.2 ppm), ethanol (0.6 ppm), acetone (5 ppm), pentane (20 ppm) and isoprene (11 ppm) [98]. Furthermore, Cyranose 320 could distinguish gaseous samples based on their volatile sulphur compound levels [99] and it is also sensitive for ammonia in above 1 ppm concentration [100] with the most selective sensors being 6 and 23. In addition, Cyranose 320 was able to detect NO2 and Cl2 gas, however in that experiment the lowest concentration of those gases was 5 ppm [101]. In conclusion,
20
Cyranose 320 can detect volatile substances between approximately 100 ppb and 100 ppm. Based on the qualitative and quantitative characteristics of human breath VOCs, one can assume certain VOCs responsible for Cyranose 320 results.
In a previous study, quantifying breath VOCs with GC-MS, Barker et al. found only a limited number of volatiles (methanol, ethanol, acetone and isoprene) in the 100 ppb- 100 ppm range [102]. Another study using solid phase microextraction revealed that pentane, xylene and acetonitrile may also be found in a concentration above 100 ppb in breath samples of some healthy subjects [103]. Unfortunately, that study did not analyse the healthy smoker subjects separately, but higher breath levels of methanol, isoprene, xylene and acetonitrile were associated with smoking in other studies [104-106]. In a large, but unselected population of subjects (N=344) Moser et al determined concentrations of some selected VOCs in exhaled breath using PTR-MS. In addition to methanol and acetone the authors found that the median levels of benzene were also above 100 ppb [107]. Of note, elevated levels of exhaled benzene were also associated with smoking [105, 106]. The most prominent volatile sulphur compounds in breath are hydrogen sulphide, methanethiol and dimethyl sulphide, found in variable concentrations, but their physiological thresholds were estimated to be 100 ppb, 12 ppb and 24 ppb, respectively [108]. In addition to the aforementioned VOCs, breath ammonia is found in 1-10 ppm levels [13].
2.4.1.3. The current status of exhaled breath analysis using Cyranose 320 electronic nose.
Surprisingly, despite the lack of validation studies, various results show that the diagnostic potential of Cyranose 320 is excellent (classification accuracy of 95-100%) to identify asthma as well as OSA, good (classification accuracy of 90-95%) to identify malignant mesothelioma and fair (classification accuracy of 85-90%) to identify lung cancer from exhaled breath samples. Nevertheless, these results should be interpreted with caution:
1. The statistical methods for data reduction (principal component analysis) may overestimate the classification accuracy as it separates the groups on the basis of largest differences, which are not necessarily related only to the disorders themselves but also to other unknown factors.
21
2. These studies were performed in relatively small cohorts (N<100 in all cases) and should be validated in further cohorts.
3. The fact that qualitative and quantitative characteristics of volatile substance in mixtures driving the differences are not determined one cannot exclude that instead of disease false and not disease-specific signals are captured. For instance, some studies showed that breath samples in lung cancer differed from health [70, 71], however another study showed that smoking may itself alter the volatile compound pattern [90].
While human breath contains hundreds of different volatile molecules, the number of potential candidates which may drive E-nose signals is limited because of their quantitative and qualitative modalities in exhaled breath. Taking into account the studies establishing VOC levels in human breath, acetone, methanol, ethanol, isoprene, ammonia, pentane, hydrogen sulphide, xylene, acetonitrile and benzene are those which may produce a measurable Cyranose 320 signal. However, there is a possibility that an aberrant molecule found in lower concentrations in the breath of healthy individuals can be extremely overproduced in disorders. Unfortunately, it is not very likely that such a molecule exist, as in this case there would be no need for an unspecific platform, and studies should focus on developing sensitive and selective sensors to measure that specific molecule instead.
Comparing the results of previous GC-MS studies to those with electronic nose, it seems plausible that the differences observed by E-noses are caused by not a mixture of many and not only a couple of molecules. In line with this, altered levels of acetone [109-112], isoprene [109-111, 113], benzene [20], xylene [109], pentane [114], ethanol [112] and methanol [111] were found in lung cancer, nonetheless methanol, isoprene [106] and benzene [106, 109, 114] were associated with smoking itself. Elevated levels of pentane [115] and reduced levels of ammonia [116, 117] were linked with asthma.
Altered levels of breath pentane were found in OSA [118] and malignant mesothelioma [119].
In spite of the promising results of case-control studies, only a limited number of experiments investigated the methodological factors that may influence Cyranose 320 results.
22
One possible factor which may affect E-nose results is the temporal drift of the sensors, meaning that the steady-state E-nose responses change along time with usage. The temporal drift can be short or long term. It is not known for conducting polymers whether repetitive measurements influence sensor reactivity when volatile substances do not detach from the composite fast enough and sensors cannot regain baseline conformation. Knobloch et al. repeated sampling every two hours in total for 6 hours using a commercially available conducting polymer E-nose (ST214, Scensive Tech.
Ltd.), and showed a significant short term drift [120]. However, contrarily, initial studies on carbon black sensors showed that the time for desorption is less than 1 second [47]. A study by Lazar et al. supported these findings showing no change in exhaled volatile compound pattern 90 minutes after baseline [121]. The oxidation of the polymers contributes to the long term drift [53]. Supporting this, Nake et al. exposed Cyanose 320 to CH3SH and assessed results along 8 days. E-nose responses correlated highly with the elapsed time (r=0.99), suggesting a considerable effect of sensor drift [122]. Nevertheless, long term stability of the exhaled breath E-nose signal has been reported in few studies [73, 74, 76, 121, 123], indicating that Cyranose 320 results are reproducible within 6 weeks.
Exhaled breath contains a variable amount of water which may affect the E-nose result [124]. Although it was shown that the selectivity of carbon black polymer sensors for volatile substances is not influenced by humidity [82], the increase in vapour pressure decreases sensor sensitivity [47]. There are two possible solutions to reduce this confounding factor. It was shown that sensors 5, 6, 23, 31 are the most sensitive water sensors [100], and the manufacturer suggest excluding them to prevent this effect. The other technique is to lead exhaled breath through a silica gel during collection which adsorbs most of the humidity [75, 76], however one study suggested that this method is ineffective [124]. The main disadvantage of the former technique is that the excluded sensors may be specific for other important molecules besides water. Silica gels reduce water content with an unpredictable and possibly varying ratio making sensor signals inconsistent as sensor sensitivity for volatile molecules is dependent on ambient water content [47]. Notably, the workgroup which introduced the application of silica gel in breath sampling later decided to dismiss it and instead began to exclude the water sensitive sensors [86]. Conducting polymer arrays are also influenced by the
23
temperature of the sample gas, therefore a temperature-adjustment is required during analysis [120].
E-nose volatile pattern differences between healthy individuals and patients with obstructive lung diseases may not be due to airway inflammation or oxidative stress, but the magnitude of airway narrowing which may modify the kinetics of exhaled particles.
However, this effect is still contradictory, as Lazar et al. showed that the acute changes in airway calibre do not affect the E-nose results [121], while Biller et al. concluded that Cyranose 320 results are related to the lung function parameters [125].
Assessing the relationship between exhaled volatile compound pattern and systemic inflammatory parameters, Biller et al. showed that a significant relationship existed between Cyranose 320 data and blood total leukocyte number, as well as neutrophils, lymphocytes, monocyte and eosinophil percentages in healthy subjects [125]. In addition, Fens et al. showed that the E-nose pattern is associated with airway inflammation measured by sputum eosinophil cationic protein and myeloperoxidase levels in COPD subjects [126].
Complex physiological circumstances may affect the exhaled volatile compound levels in a more elaborate way. These changes cannot be derived from the sum of different factors, but need to be investigated using powerful bioinformatics. For instance, food and beverage intake may influence the exhaled volatile compound measurements [127].
Following meal, volatile substances might originate from the oral cavity, from stomach, or from blood after complete digestion. It is widely known that alcohol ingestion increases exhaled ethanol levels [44]. Breath acetone concentration is not only directly influenced by the consumed food, but also by the systemic metabolic state [128]. Other volatile compounds levels, like that of exhaled carbon monoxide are also increased following sugar intake, which may be related to the enhanced systemic oxidative stress [129]. Unfortunately, a general recommendation how long the subject should fasten before volatile compound measurements has not been put forward. Preliminary measurements are warranted for as many target volatile molecules as possible. In general, subjects fast for 2-3 hours when breath is analyzed.
Other important influencing conditions are physical exercise and physiological pregnancy.
24
2.4.2. Effect of physical exercise on exhaled volatile compounds
Exercise may alter exhaled volatile particle levels through several mechanisms.
Physical challenge enhances the metabolism of carbohydrates, lipids and amino acids and elevates the cardiac output. Hence, the excretion of blood borne volatile compounds, such as acetone or isoprene through exhaled breath increases with exercise [130].
Hyperventilation during exercise may wash out the volatile molecules which are produced in the airways [131]. For instance, despite the increased production of nitric oxide in the airways, the concentration of exhaled nitric oxide decreases during physical challenge [132].
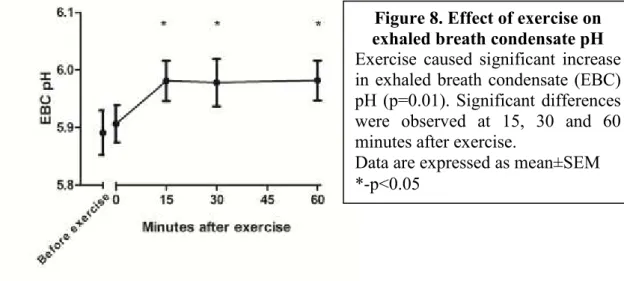
Hyperventilation and the consequent drying of airway mucosa may induce inflammatory response, especially in asthmatic subjects. We have previously shown that exercise increases exhaled inflammatory markers of adenosine [133] and cysteinyl- leukotrienes [29] in subjects with exercise-induced bronchoconstriction. In addition, the levels of oxidative stress markers, such as EBC H2O2 [134-136] and malondialdehyde [137] as well as inflammatory markers, such as EBC PGE2 and TXB2 [138] increase after exercise in healthy subjects. Nevertheless, the effect of exercise on oxidative stress markers needs further evaluation, as in other studies no significant changes were found in EBC H2O2 or tiobarbituric acid reactive substance levels following moderate cycling [139] or in EBC 8-isoprostane concentration after swimming [140]. The effect of exercise on EBC oxidative stress markers could be work load dependent, as Araneda et al. found an increase in EBC H2O2 and NO2- levels after 21.1 km and 42.2 km running, but not after 10 km in elite long distance runners [141]. Chronic training at high altitude (2,800 m) increased EBC 8-isoprostane and H2O2 levels in healthy subjects [142]. As airway inflammation and oxidative stress is related to the exhaled volatile compound levels, their levels may be altered after exercise.
Exhaled breath pH increases following exercise, as shown by various workgroups [143, 144]. It is known that the entrapment of some acids and bases in condensate in their non-volatile form is based on condensate acidity. For instance, decreasing EBC pH increases its non-volatile ammonium (NH4+) concentrations [25], which presumably reduces the levels of exhaled ammonia (NH3), the volatile base form of this molecule. In line with this, elevated NH3 and reduced propionic acid breath levels were measured in
25
parallel with EBC alkalisation following physical exercise in healthy subjects [143].
However, experiments by Marek et al. contradicts other studies that showed EBC alkalisation following exercise, as these authors described an increase in EBC lactate concentration [135, 145]. Since lactate measured in EBC correlated with its blood levels [145], it may suggest that the change in EBC pH following exercise depends on aerobic/anaerobic threshold during exercise challenge. Similarly to oxidative stress markers, changes in EBC pH may also be workload dependent, as in elite runners EBC pH values tended to increase at 10 km, but showed a tendency to decrease at 21.1 and 42.2 km (changes were not significant at any timepoints) [141]. Interestingly, studies investigating systemic changes of oxidative stress markers are also contradictory and seem to be related to work load [146, 147].
2.4.3. Effect of pregnancy on exhaled volatile compounds
Physiological pregnancy activates numerous pathways which may influence exhaled biomarkers. Haemodynamical changes during gestation might alter the excretion rate of some blood borne volatile substances. The levels of hormones and metabolites change in pregnancy. In addition, pregnancy is characterised by accelerated metabolism [148], increased systemic oxidative stress [149] and immune tolerance [150]. These changes may all lead to altered exhaled volatile compound composition.
The number of studies measuring exhaled biomolecule levels in pregnancy is low.
Stolarek et al. reported decreased levels of EBC H2O2 during pregnancy [151], Shin et al. showed that exhaled pentane increases during delivery [152], while Zusterzeel et al.
concluded no differences in exhaled ethene concentration in pregnant women [153]. We aimed to measure EBC vascular endothelial growth factor in pregnancy, however could not detect this molecule in the majority of samples [33]. Supporting the previous results [154], we have found no difference in exhaled nitric oxide in healthy pregnant women [155]. More importantly, pregnancy did not alter the fractional exhaled nitric oxide levels in asthmatic women either [155], therefore this variable can be used as a potential biomarker for the assessment of airway and possibly systemic inflammation [156] and thus asthma control in pregnancy [157]. A study, investigating a profile of 107 VOCs showed that the contour of breath methylated alkanes was altered in preeclampsia [158], without a difference in physiological pregnancy compared to healthy, non-pregnant women.
26
3. Objectives
This PhD work aimed to investigate methodological and physiological factors which may affect the exhaled breath measurements. These were the following:
3.1. The effect of respiratory droplet dilution on EBC pH
The main aim was to assess the relationship between EBC dilution and EBC pH values between healthy and asthmatic subjects.
The other aims included:
o To study the reproducibility of EBC pH and EBC dilution measurements o To compare EBC dilution and EBC pH values between healthy and
asthmatic subjects.
o To compare EBC pH and dilution values with various variables of asthma control, including lung function, exhaled nitric oxide and inhaled steroid use.
3.2. Reproducibility of Cyranose 320 measurements
We aimed to assess the short term reproducibility of exhaled volatile compound pattern assessed with Cyranose 320 within a day.
We aimed to assess the long term reproducibility of exhaled volatile compound pattern assessed with Cyranose 320 over 8 weeks.
3.3. EBC pH and exhaled volatile compound pattern during physical exercise
We aimed to assess the effect of physical exercise on EBC pH and exhaled volatile compound pattern in healthy subjects
We aimed to compare exercise-induced EBC pH and exhaled volatile compound pattern changes, thus investigating the relationship between the two variables.
3.4. Effect of physiological pregnancy on exhaled breath volatile compounds
The main aim was to compare exhaled volatile compound pattern between pregnant and non-pregnant women.
27 In addition we aimed to assess:
o The effect of accompanying disorders and smoking on discrimination model set on pregnant and non-pregnant subjects.
o The relationship between exhaled volatile compound pattern and gestational age in pregnant women.
28
4. Methods
4.1. The effect of respiratory droplet dilution on exhaled breath condensate pH
4.1.1. Study design
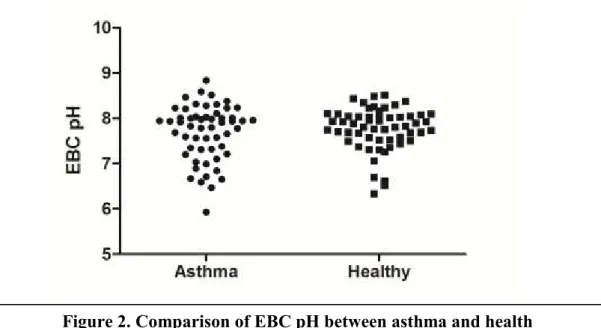
The study had a case-control design in which exhaled breath condensate dilution and pH values were compared in 112 (55 asthmatic and 57 healthy) individuals. After filling informed consent, exhaled breath condensate was collected from all subjects for pH and respiratory droplet dilution measurements. In asthmatic subjects additional exhaled nitric oxide and lung function measurements were performed according to the latest guidelines [159, 160]. Exhaled breath condensate was collected during tidal breathing using Rtube (Respiratory Research, Charlottesville, VI, USA) for 10 minutes without wearing a nose clip with a chilling tube that was previously cooled at -80 °C. Following the collection samples were divided for pH (250 µL) and dilution (600 µL) measurements and stored at -80 °C until analysis.
4.1.2. Study subjects
55 asthmatic (32±9 years) and 57 healthy (29±7 years) volunteers were recruited.
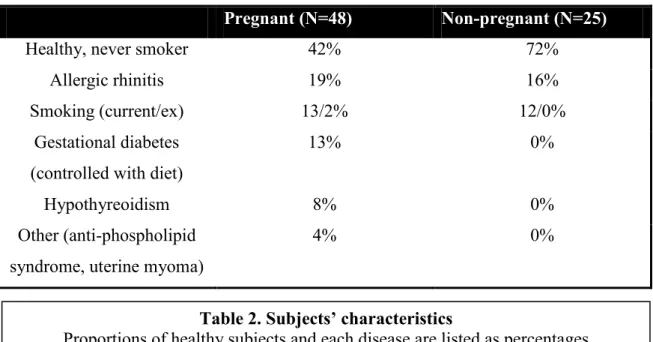
Asthma was defined using the latest Global Initiative for Asthma (GINA) guidelines [75], and confirmed by >12% and 200 mL increase in FEV1 after administration of 400 µg salbutamol. According to the GINA, 19 asthmatics were considered well controlled, 20 partially controlled and 16 uncontrolled. Asthmatic patients were recruited at the outpatient clinic of Department of Pulmonology and none of the subjects was hospitalised due to asthma exacerbation in the last year. Twenty-three asthmatic patients used inhaled corticosteroids (ICS) either alone or in a combination with long acting beta agonist and twenty-two were considered steroid-naive. Healthy subjects were recruited among workers and students of Semmelweis University. None of the subjects had respiratory tract infection within 2 months prior to the study. The volunteers were asked to avoid consuming food or beverages 2 hours prior to the breath measurements.
To measure EBC dilution, we used the vacuum evaporation method validated by our workgroup previously [24, 30]. To investigate the effect of vacuum evaporation on EBC
29
conductivity, further seven healthy subjects were involved and EBC conductivity was estimated before and after vacuum treatment.
Furthermore, to study the analytical reproducibility of EBC pH and conductivity measurements twelve and seven healthy volunteers were recruited for pH and conductivity analysis, respectively. Their samples were divided into two and measured in parallel.
4.1.3. Exhaled breath condensate pH measurements
EBC pH was estimated using a glass pH electrode (SV 20 Seveneasy, Mettler Toledo, Schwerzenbach, Switzerland) after 10 minutes of de-aeration with argon gas. During this approach the majority of CO2 is eliminated resulting in a more reproducible EBC pH than of an untreated sample [26].
4.1.4. Exhaled breath condensate dilution factor measurements
EBC dilution factor was estimated by conductivity measurements in vacuum treated samples. During 12 hours of vacuum evaporation at 700 mbar and room temperature all the water and volatile constituents of EBC are removed and only non-volatile ions remain. Evaporation was performed on 600 µL serially diluted 150 mM NaCl standards (1/1000, 1/2000, 1/4000, 1/8000 and 1/16000), distilled water (serving as 0 mM NaCl) as well as EBC samples. After evaporation standards/samples were reconstituted in 600 µL distilled water (conductivity 3.3±0.9 µS/cm) and conductivity was measured with GMH 3410 conductivity meter (Greisinger Electronic GmbH, Regenstauf, Germany).
The detection limit of conductivity measurements was estimated at 6.85 µM NaCl [30].
To study the potential of vacuum evaporation to eliminate ammonia, the main volatile ion in EBC, conductivity was measured in serially diluted NH4OH solutions (178.5 mM, 89.3 mM, 44.6 mM and 14.9 mM) before and after vacuum-treatment.
4.1.5. Statistical analysis
The sample size (N=112) was estimated to investigate the relationship between EBC pH and respiratory droplet dilution with an effect size of 0.3, the power of 90% and the probability of α error of 0.05.
Statistica 8.0 (Stat Soft, Inc., Tusla, OK, USA) was used for statistical analysis. The normality of data was estimated with Kolmogorov-Smirnov test. Wilcoxon test was used to compare pre and post vacuum-treatment conductivity. Mann-Whitney test was
30
used to compare EBC pH and dilution values between healthy and asthmatic groups.
The relationship between EBC pH and dilution was examined by Spearman-correlation.
Stepwise-multiple regression was used to assess the relationship between EBC pH, dilution factors and clinical variables. The asthmatic group was divided into low pH (≤7.2) and normal pH (>7.2) groups and exhaled nitric oxide, lung function values and asthma control were compared between the two subgroups using logistic regression.
General linear model was used to compare EBC pH between the three asthma control groups with and without adjustment on respiratory droplet dilution. Data are expressed as median (25-75 % inter-quartile range). A p<0.05 value was considered significant.
4.2. Reproducibility of Cyranose 320 measurements
4.2.1. Study design and subjects
To study the short-term variability of “breathprints” obtained with Cyranose 320 (Smiths Detection, Pasadena, USA), fifty-six healthy subjects (40±13 years, 20 men) were involved. Exhaled breath samples were collected from all subjects and processed instantly with Cyranose 320. A second sample was also collected immediately after the instrument has finished the previous analysis and processed using the same algorithm.
Because electronic nose analysis took around 10 minutes, the two measurements were performed 10 minutes apart. None of the subjects were smokers or had respiratory tract infection within 2 weeks prior to the study. The volunteers were asked to avoid consuming food or beverages 2 hours prior to the breath measurements.
The long-term variability was assessed in 12 healthy subjects (30±5 years, 3 men).
Exhaled breath was collected at baseline as well as 30 minutes, 60 minutes, 120 minutes, 1 day, 1 week, 4 week and 8 weeks after the first measurement. None of the subjects were smokers or had respiratory tract infection within 2 weeks prior to the study. The volunteers were asked to avoid consuming food or beverages 2 hours prior to the breath measurements.
4.2.2. Exhaled breath collection and measurements
Exhaled breath collection was performed in the same way in all cases. After a deep inhalation through a VOC filter to total lung capacity, subjects exhaled at controlled flow rate (50 mL/sec) against resistance (15-20 cmH2O) to residual volume. The first 500 mL of exhaled air, representing the anatomical dead space was discarded by leading
31
through a T-valve and the second part, representing alveolar air was collected into a Teflon-coated Mylar bag, which is chemically inert with respect to most compounds in the breath [161] (Image 1, EcoMedics, Dürnten, Switzerland). The bags were attached to the E-nose and processed immediately. After auto scale normalisation, sensor responses (dR) were calculated using formula dR=(Rs-R)/R, where Rs is the response to the sampled gas and R is the response to the baseline reading, the reference gas being the VOC-filtered room air. Cyranose 320 contains 32 sensors but to avoid the confounding effect of water vapour exhaled breath volatile compound pattern was analysed using only 28 sensors (the four water sensitive sensors 5, 6, 23, and 31 were excluded). The raw data were stored in the onboard database and then transferred to an offline database for further analysis. Between each collection, Mylar bags were purged using 99.999% N2 gas (Linde, Budapest, Hungary).
4.2.3. Statistical analysis
The statistical analysis was performed with SPSS 15.0 software (SPSS Inc., Chicago, IL, USA). To reduce the dimensionality of the data set, principal component analysis (PCA), an exploratory technique was applied to investigate how the data cluster in the multi-sensor space. The responses of 28 sensors underwent data reduction (PCA) and
Image 1. Setup for collection for Cyranose 320 measurements
After inhaling through a VOC-filter (D) to total lung capacity, the subject exhales through a mouthpiece (A) and a bacteria filter (B) while the exhalation flow rate is being controlled with a flow-meter (C). The first part of the exhaled breath, representing the dead space, is discarded in a dead space bag (F) via a T-valve (E) and the alveolar air is collected in a Teflon-coated Mylar bag (G).
32
the principal components were sorted by their Initial Eigen value sizes and the first 3 principal components (PCs, capturing 99% of the variances between the datasets) were used in further analyses.
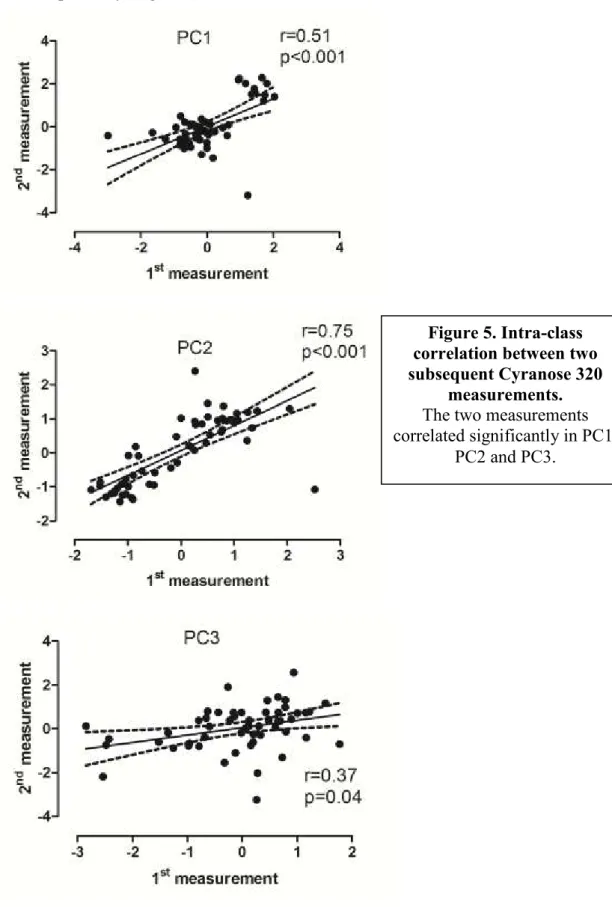
Assessing short-term variability PCs were correlated using Pearson-test and compared using paired t-test.
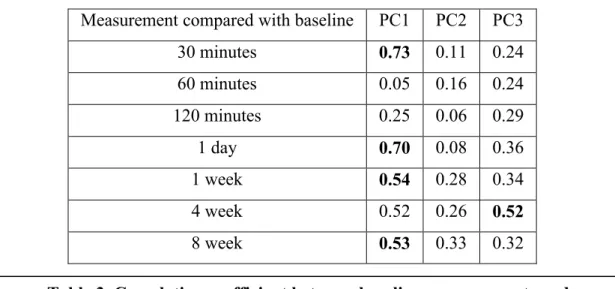
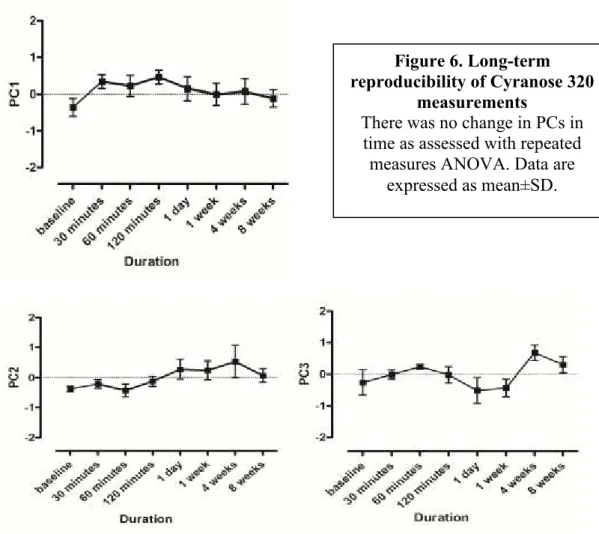
To study long-term variability intra-class correlations between sensor responses were calculated by the Pearson-test and repeated measures analysis of variance (ANOVA), followed by the Dunnett’s post hoc tests were used to assess the temporal changes in PCs. A p value <0.05 was considered significant.
4.3. EBC pH and exhaled volatile compound pattern during physical exercise
4.3.1. Study design
Exhaled breath volatile compounds as well as exhaled breath condensate were collected and lung function test was performed before the 6-minute outdoor running test at 14.5±5.7 °C. The cycles of breath collection and spirometry were repeated 0, 15, 30 and 60 minutes following the exercise.
4.3.2. Study subjects
Ten healthy subjects (22±4 years, 6 men) participated in the study. None of them had any chronic disorder or respiratory tract infection in the 6 weeks prior to the study.
None of them were smokers and were asked to avoid consuming food or beverages and physical exercise 2 hours before the measurements.
4.3.3. Exhaled breath volatile compounds collection and analysis
Subjects were asked to inhale through their nose and exhale into a three-litre poly-vinyl- chloride bag three times. During the exhalation the dead space was not discarded and the expiratory flow was not controlled. After the third exhalation the bag was closed with a clip and analysed immediately using Cyranose 320 (Smiths Detection, Pasadena, USA). After exclusion of the four water-sensitive sensors, 28 responses underwent data reduction (principal component analysis), the principal components were sorted by their Eigenvalue sizes and the highest 4 of them (which represented 98.9% of total variances) were used for further analysis.