Potential use of superparamagnetic iron-oxide nanoparticles as MRI contrast agent in
imaging intracranial tumors PhD Thesis
Péter Várallyay MD Semmelweis University
János Szentágothai Doctoral School of Neurosciences
Consultant: Zoltán Nagy MD., D.Sc.
Official reviewers: Edit Dósa, MD., Ph.D.
Gábor Bajzik MD., Ph.D.
Head of the Complex Exam Committee:
Alán Alpár MD., D.Sc.
Members of the Complex Exam Committee:
Tibor Kovács MD., Ph.D.
Emília Madarász MD., D.Sc.
Budapest 2018
1. INTRODUCTION
Magnetic resonance imaging (MRI) provides outstanding capability of differentiating among tissues. Contrast between tissues is primarily determined by their intrinsic properties such as proton density, T1 and T2 relaxation time constants but other factors like diffusion, susceptibility, flow, chemical shift and perfusion also play role in producing tissue contrast. In addition, contrast can further be modified by setting the parameters of different sequences, particularly the repetition time (TR), echo time (TE), inversion time (IT) and flip angle. Although in a large number of cases these possibilities render enough contrast between tissues to make a diagnosis, administration of a contrast agent (CA) is often needed to detect or clarify certain pathologies, monitor response to therapy as well as gain functional or physiological data. MRI CA-s are special molecules that can alter the T1 and T2 relaxation rates (1/T1 and 1/T2) of the surrounding water protons and therefore enhancing image contrast in tissues of interest. MRI CA-s are categorized as positive (T1) or negative (T2) CA- s based on their major relaxation mechanisms. Gadolinium (Gd) based contrast agents (GBCA) are effective for increasing the T1 relaxation rate and therefore mainly used as positive CA-s generating high signal intensity (enhancement) on T1-weighted images. Superparamagnetic and ultra small superparamagnetic iron oxide particles (SPIO and USPIO), originally developed for imaging of the liver and lymph nodes, are more effective for increasing the T2 relaxation rate and used as negative CA-s producing low signal on T2- and particularly T2*-weighted images. Nowadays, the majority of MRI CA-s used in clinical practice are GBCA-s with over 10
million contrast enhanced MRI studies annually in the USA. Application of CA-s are therefore extremely important.
Current concerns regarding gadolinium safety and to increase specificity draw attention to the need for alternatives, such as manganese- and iron- based contrast agents. Concerns include the possibility of nephrogenic systemic fibrosis (NSF) in patients with chronic kidney disease and more recently Gd deposition in brain (basal ganglia, dentate nuclei) and other tissues, currently with unknown clinical relevance.
In this dissertation, three types of (U)SPIO (ferumoxides, ferumoxtran and ferumoxytol) are examined for potential application as MRI CA-s in intracranial tumors. In the long term, our research may contribute to improving the diagnosis of brain tumors by increasing both sensitivity and specificity.
We performed the first clinical trial testing two iron-oxide agents ferumoxides and ferumoxtran for potential MRI CA-s in human intracranial tumors. The possible application of these (U)SPIOs in human brain tumors had not been clarified before. Further researches with the second generation USPIO, ferumoxytol in central nervous system (CNS) pathologies were mainly based on the results of our first clinical trial.
2. OBJECTIVES
2.1. Study I.
1. To examine the MRI signal changes of two iron-oxide nanoparticles, ferumoxides (SPIO) and ferumoxtran (USPIO) in human intracranial tumors and to compare these signal changes with GBCA enhancement.
2. To determine, which MRI sequence is the best to detect signal changes caused by the iron-oxide particles.
3. To compare USPIO MRI signal changes with histologic staining for iron.
2.2. Study II.
1. To examine ferumoxtran (USPIO) enhancement on pre- and postoperative MR images in malignant brain tumor patients and to check the possibility of residual lesion assessment.
2. To show the intracellular localisation of iron with histology.
2.3. Study III.
1. To compare the second generation USPIO, ferumoxytol and gadoteridol enhancement volume and signal intensity with an objective, semiautomatic method and to examine if the two contrast agents change similarly in response to treatment.
3. METHODS
The most important characteristics of the different iron-oxide particles used in our studies are described in table 1. in comparison to gadoteridol. In
general, (U)SPIO particles consist of a magnetite (Fe3O4) crystalline core which is coated with dextran, semisynthetic carbohydrate or other molecules. Besides differences in size and coating of the particles, the structure of the crystalline core, the thickness, completeness and surface charge of the coating may also be different. These properties together determine the pharmacology, opsonisation, degree of cellular uptake and plasma half life of (U)SPIOs. In contrast to GBCA-s which are eliminated from the body through the kidney, (U)SPIO particles are cleared from the circulation with relatively slow uptake of the cells of the mononuclear phagocytic system (MPS), mainly in the liver, spleen, bone marrow and lymphatic system.
1. table. Major characteristics of superparamagnetic iron-oxide nanoparticles in comparison to gadoteridol.
Feature Ferumoxides Ferumoxtran Ferumoxytol Gadoteridol
Basic element Fe Fe Fe Gd
Molecular composition
Iron-oxide + incomplete, thin coating, Dextran T10
Iron-oxide + complete, thick coating, Dextran T10, T1
Iron-oxide + complete coating, Polyglucos- sorbitol- carboxymethyl- ether
Gd- chelate,
Gd-10-(2-hydroxy- propyl)-1,4,7,10 tetraazacyclododeca n-1,4,7-triacetic acid
Particle size (nm)a
120-180 SPIO
15-30 USPIO
30 USPIO
1 GBCA Relaxivity
(mM-1sec-1)b
r1=10,1 r2=120
r1=9.9 r2=65
r1=15 r2=89
r1=4 r2=6
Dose 0.56 mg/kg 2.6 mg/kg 1-7 mg/kg 0.1 mmol/kg
Plasma half-life
2 hour 24-30 hour 14 hour 1,6 hour
Maximal signal intensity after injectionc
4 hour 24-72 hour 24 hour 3.5-25 min
T1- weighted signal intensityc
Minimal high signal
High signal (low signal at very high concentration)
High signal (low signal at very high concentration)
High signal
T2-, T2*- weighted signal intensityc
No signal change detected
Low signal Low signal T2: usually no signal change T2*: low signal in bolus
Distribution Intracellular:
MPS cells
Blood pool phase, then delayed phase:
exra- and intracellular:
MPS cells.
macrophages + reactive astrocytesc
Dynamic phase, blood pool phase, then delayed phase:
exra- and intracellular:
MPS cells.
macrophages + reactive astrocytesc
Dynamic phase, Extracellular phase
Excretion Stored with the body’s iron reserve and used in hemopoesis. Coating with renal and fecal excretion
Renal
a: Hydrodynamic diameter, laser light scattering.
b: Relaxometric properties (mM-1sec-1), at 1.5T, 37C, water or in plasma;
per mM Gd, or Fe.
c: in brain tumors
3.1. Study I.
We examined MRI signal changes induced by ferumoxides (SPIO) and ferumoxtran (USPIO) on different sequences in human intracranial tumors and compared these signal changes to those of a GBCA. In 20 patients (4
grade IV., 6 grade III., 2 grade II. glioma, 1 metastasis, 1 medulloblastoma, 2 nasopharyngeal carcinoma, 1 hamartoma, 1 pituitary macroadenoma, 2 meningioma), (U)SPIO were intravenously administered at recommended clinical doses (ferumoxides: 0.56 mg/kg, ferumoxtran: 2.6 mg/kg). MR imaging was performed 30 minutes and 4 hours after ferumoxides infusion (n=3), whereas ferumoxtran-enhanced MR imaging (n=17) was performed 6 and 24 hours after infusion in the first five patients and 24 hours after infusion in the remaining 12 patients. Each MRI study included spin-echo (SE) T1-weighted, fast SE (FSE) T2- and proton density–weighted and gradient recalled-echo (GRE) T2*-weighted sequences. In addition, in three patients echo-planar SE T2-weighted and echo-planar GRE T2*-weighted sequences were also obtained. Representative regions of interest (ROI) were chosen on pre- and postcontrast images to compare normalized signal intensities in each sequence. Histology with iron staining was performed in one case.
3.2. Study II.
Pre- and postoperative MR images were compared for ferumoxtran (USPIO) and GBCA enhancement in seven patients with primary and metastatic malignant tumors (3 grade III, 3 grade IV glioma and 1 metastasis). Normalized signal intensities on the ferumoxtran-enhanced scans were determined in representative ROIs and the signal intensities of residual ferumoxtran-enhancing regions were compared to signal intensities of preoperative ferumoxtran as well as haemostatic material and blood on postoperative images. Resected tissue from six ferumoxtran patients and from three patients who did not receive ferumoxtran was assessed for iron localization in tumor and reactive brain.
3.3. Study III.
The second generation USPIO, ferumoxytol and gadoteridol volume and signal intensity and their change in response to specific treatment were measured with an objective, semiautomatic method. 58 high grade glioma patients were analyzed with 193 complex MRI studies (193 post- gadoteridol and 193 post-ferumoxytol), which were stratified according to the therapy received before each scan: 8 pre-chemoradiation (CRT), 107
<90 days post-chemoradiation, 15 >90 days post-chemoradiation and 63 post-bevacizumab scans. Ferumoxytol (4mg/kg, diluted 1:1 with saline) was administered after performing the post-gadoteridol scans and delayed ferumoxytol scans were obtained at ~24h after injection. Enhancement volumes and normalized signal intensities of both CA-s were calculated with a semiautomatic method. Enhancement cube root volumes (D) and signal intensities (SI) were compared between the two contrast agents, and relative difference of D and SI were compared in different treatment groups with multivariate analysis. Besides, D and SI before and after treatment with bevacizumab or steroid were assessed in 26 patients in each treatment group.
4. RESULTS
4.1. Study I.
Fifteen of 17 patients given ferumoxtran had T1 and T2 shortening or only T1 shortening consistent with iron accumulation in the tumor. Only the two low-grade oligodendroglioma did not show signal changes despite Gd enhancement was present. On SE T1-weighted images, the increase in
signal intensity (enhancement) was readily detected. Among the other sequences, GRE T2*-weighted images were the best to visualise iron accumulation as low signal intensity (fig. 1. and 2.). 13 of the 15 brain tumors had signal intensity changes in the approximate region where gadolinium enhancement was seen, but in three cases ferumoxtran enhancement was detected even in areas of no gadolinium enhancement (fig. 2.). Comparing the 6 and 24 hour scans, ferumoxtran showed progressive accumulation with significant increase in signal intensity (P‹0.05) and the enhancement also extended into a larger area on the 24 hour scans. The long plasma half life (24-30 hour) and the small size of the ferumoxtran particle make it possible for this USPIO to cross the leaky blood–brain barrier (BBB) and accumulate in tumors.
Fig 1. A. Comparison of SE T1-weighted and B. FSE T2-weighted and GRE T2*-weighted MR images in 15 patients. Normalized mean signal intensity values with standard mean error in areas of absent, minimal, and maximal ferumoxtran (Combidex) enhancement in the tumor as well as in brain around tumor (BAT).
(A) significant differences; a: Gd › precontrast, b: Gd › ferumoxtran, c: Gd or ferumoxtran › precontrast, d: ferumoxtran › precontrast.
(B) significant differences; a and c: T2 ferumoxtran ‹ T2 precontrast, b and d: T2* ferumoxtran ‹ T2 ferumoxtran
On the other hand, ferumoxides essentially did not cause signal changes,
A B
therefore it cannot be used for imaging intracranial tumors. This is most likely secondary to the larger particle size and the large variety in size (compared with ferumoxtran) as well as the thin and incomplete dextran coating resulting in rapid protein-binding (opsonization) when in circulation and thus a short plasma half-life.
Histologic examination revealed strong iron staining mainly at the periphery of the tumor and the cellular uptake was primarily in parenchymal cells with fine fibrillar processes, suggesting an astrocytic derivation (fig.
2.).
Fig. 2. Anaplastic oligodendroglioma.
A and B, Nonenhanced (A) and gadolinium-enhanced (B) SE T1-weighted images of the right temporal tumor. The gadolinium-enhanced image shows evidence of strong, lobulated peripheral enhancement with a central nonenhancing zone.
C, At 24 hours after ferumoxtran infusion, SE T1-weighted image demonstrates marked high signal intensity in a similar distribution but with less peripheral lobulation compared with the gadolinium-enhanced image.
Also note that the non–gadolinium-enhancing central zone became isointense to white matter, suggesting some ferumoxtran accumulation.
D–F, Fast SE T2-weighted image obtained before ferumoxtran infusion (D) and fast SE T2-weighted (E) and GRE T2*-weighted (F) images obtained
24 hours after ferumoxtran infusion show a heterogeneous tumor mass with peripheral decreased signal intensity that is more prominent on the GRE T2*-weighted image. The distribution of the low-signal-intensity areas is similar to that of the high-signal-intensity areas on the SE T1-weighted image in C.
G and H, Photomicrographs from histologic staining for iron (DAB- enhanced Perls stain). In G (original magnification x7.5; bar indicates 1 mm), tumor (T) and reactive brain interface (RB) show the intense staining for iron at the periphery of the tumor. In H (original magnification x100; bar indicates 0.1 mm), cellular iron staining at the tumor–reactive brain interface shows iron uptake by the parenchymal cells with fibrillar processes (arrows) rather than by the round tumor cells (T).
4.2. Study II.
All malignant tumors (all of which enhanced with Gd) showed ferumoxtran accumulation with T1 and T2 signal changes. In one patient, there was readily detectable enhancement even using a 0.15 T intraoperative MR unit. In five of the seven patients, areas enhancing with ferumoxtran but not with Gd were observed. Ferumoxtran enhancement either involved a larger area compared to the Gd-enhancing tumor mass, or appeared in new regions showing additional lesions. In one of these cases, new Gd- enhancing tumors developed in 5 months later in regions of additional ferumoxtran enhancement.
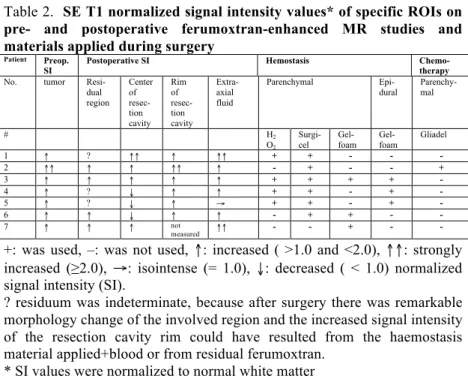
Comparison of the pre- and postoperative MRI revealed residual ferumoxtran-enhancing areas in four of seven cases. In the remaining three patients residuum could not be clearly determined due to the similar signal changes caused by the applied haemostasis (H2O2 and Surgicel) and blood degradation products as well as postsurgical morphological changes of the involved region. Each residual ferumoxtran-enhancing region remained of high normalized signal intensity and could be easily detected even after 5 days of ferumoxtran infusion (table 2., fig. 3.)
Table 2. SE T1 normalized signal intensity values* of specific ROIs on pre- and postoperative ferumoxtran-enhanced MR studies and materials applied during surgery
Patient Preop.
SI Postoperative SI Hemostasis Chemo-
therapy
No. tumor Resi-
dual region
Center of resec- tion cavity
Rim of resec- tion cavity
Extra- axial fluid
Parenchymal Epi-
dural Parenchy- mal
# H2
O2
Surgi- cel
Gel- foam
Gel- foam
Gliadel
1 ↑ ? ↑↑ ↑ ↑↑ + + - - -
2 ↑↑ ↑ ↑ ↑↑ ↑ - + - - +
3 ↑ ↑ ↑ ↑ ↑ + + + + -
4 ↑ ? ↓ ↑ ↑ + + - + -
5 ↑ ? ↓ ↑ → + + - + -
6 ↑ ↑ ↓ ↑ ↑ - + + - -
7 ↑ ↑ ↑ not
measured ↑↑ - - + - -
+: was used, –: was not used, ↑: increased ( >1.0 and <2.0), ↑↑: strongly increased (≥2.0), →: isointense (= 1.0), ↓: decreased ( < 1.0) normalized signal intensity (SI).
? residuum was indeterminate, because after surgery there was remarkable morphology change of the involved region and the increased signal intensity of the resection cavity rim could have resulted from the haemostasis material applied+blood or from residual ferumoxtran.
* SI values were normalized to normal white matter
Fig. 3. Glioblastoma
A. Gadolinium-enhanced SE T1-weighted image shows a large left fronto- lateral enhancing tumor (arrows).
B. At 24 h after ferumoxtran infusion, preoperative SE T1-weighted image demonstrates intense ferumoxtran enhancement in the left fronto-lateral tumor (arrows). Additionally, a new ferumoxtran-enhancing lesion showed
up medially to the main tumor mass in the putamen (arrowhead). Surgery was performed within 4 h after this MR.
C. At 5 days after ferumoxtran infusion and 4 days after surgery, postoperative SE T1-weighted image reveals still clear visualization of the residual ferumoxtran-enhancing lesion in the putamen (arrowhead). The rim of the resection cavity has increased signal intensity in some areas (arrows) (Surgicel was used).
D and E. Iron staining (DAB-enhanced Perl’s) photomicrographs. In D (original magnification x25; bar indicates 0.5 mm) there is intense iron staining in the brain around tumor (BAT) but not in tumor (T). In E (original magnification x200; bar indicates 0.05 mm), dense iron staining is seen in a reactive cell (arrow) with only minimal staining (uptake) in tumor cells.
F. GFAP staining. Astrocytic cells stained for GFAP (arrows) show the same morphology as iron-stained cells in E (original magnification x200;
bar indicates 0.05 mm).
Histochemistry: iron staining was predominantly in reactive cells (macrophages and reactive astrocytes) at the tumor-brain interface and not in tumor cells (fig. 3.).
4.3. Study III.
There was a strong correlation in enhancement cube root volumes (r=0.7979, P<0.0001) and in signal intensities (r=0.5362, P<0.0001) between ferumoxytol and gadoteridol. Analyzing all of the MRI scans together, cube root of enhancement volume was 13.83% lower and enhancement signal intensity was 7.24% lower with ferumoxytol than with gadoteridol (P<0.0001 for both). The relative differences of D and SI between contrast agents were not statistically significantly different among the four different treatment groups (D, P.0.7905 and SI, P.0.3725) (fig. 4.).
In addition, relative difference between contrast agents did not change significantly in response to bevacizumab (D: P=0.5234, SI: P=0.2442), or steroid (D: P=0.3774, SI: P=0.0741). These results show, that the two
contrast agents behave similarly during follow up after treatment, ie. if gadoteridol enhancement changes, then ferumoxytol enhancement follows it.
Fig. 4. Enhancement cube root volumes (A) and signal intensities (B) of the two contrast agents in different treatment groups. The relative differences of the cube root volumes and signal intensities of the two contrast agents were not significantly different in the four treatment groups.
Fe: ferumoxytol; Gad: gadoteridol.
5. CONCLUSIONS
1. In contrast to ferumoxides (SPIO), ferumoxtran (USPIO) can be used as an MRI contrast agent in human intracranial tumors. Ferumoxtran accumulation is progressive with stronger and larger area of signal intensity changes on the 24-hour images compared to the 6-hour scans and can be best seen on SE T1-weighted and GRE T2*-weighted images.
2. In malignant brain tumors, ferumoxtran may show additional areas of enhancement (near or even at a distance of the Gd-enhancing tumor), which do not enhance with Gd indicating early pathological changes.
pre-‐CRT post-‐CRT post-‐CRT bev pre-‐CRT post-‐CRT post-‐CRT bev
›90nap ›90nap
A B
3. On postoperative MR images residual ferumoxtran enhancing areas remain readily detectable with persistent high T1 signal intensity for 2-5 days after ferumoxtran infusion, which may make it possible to assess residual tumor (intra- and postoperative) without new CA administration and surgery induced Gd enhancement. Ferumoxtran enhancement can also be detected with a low field, 0.15 T intraoperative MRI.
4. The mechanism for additional and persistent MRI signal change of iron oxide particles appears to result from a long plasma half life (24–30 h) to breach the BBB followed by intracellular trapping.
5. Histochemistry showed extra- and intracellular iron mainly at the tumor periphery. Intracellular iron uptake is in reactive cells (macrophages and reactive astrocytes) rather than tumor cells. USPIO particles are unique agents, since they can be imaged both by MRI as well as light microscopy (even electron microscopy).
6. The significant correlation between the second generation USPIO, ferumoxytol and gadoteridol enhancement volume and signal intensity and their similar behavior in response to therapy are important results toward developing ferumoxytol as an additional MR imaging CA.
However, more studies are needed to assess the clinical impact of timing and dosing of ferumoxytol for delayed imaging.
6. PUBLICATIONS RELATED TO THE THEME OF THE PHD THESIS
1. Várallyay P, Nesbit G, Muldoon LL, Nixon RR, Delashaw J, Cohen JI, Petrillo A, Rink D, Neuwelt EA. (2002) Comparison of two superparamagnetic viral-sized iron oxide particles ferumoxides and ferumoxtran-10 with a gadolinium chelate in imaging intracranial tumors. AJNR Am J Neuroradiol, 23(4): 510-9. IF: 2.463 2. Neuwelt EA, Várallyay P, Bago AG, Muldoon LL, Nesbit G, Nixon R.
(2004) Imaging of iron oxide nanoparticles by MR and light microscopy in patients with malignant brain tumors. Neuropathol Appl Neurobiol,
30(5): 456-71. IF: 3.402
3. Muldoon LL, Várallyay P, Kraemer DF, Kiwic G, Pinkston K, Walker- Rosenfeld SL, Neuwelt EA. (2004) Trafficking of superparamagnetic iron oxide particles (Combidex) from brain to lymph nodes in the rat.
Neuropathol Appl Neurobiol, 30(1):70-9. IF: 3.402 4. Horváth A, Varallyay CG, Schwartz D, Toth GB, Netto JP, Barajas R,
Várallyay P, Szidonya L, Firkins J, Youngers E, Fu R, Ambady P, Bogner P, Neuwelt EA. (2018) Quantitative comparison of delayed ferumoxytol T1 enhancement with immediate gadoteridol enhancement in high grade gliomas. Magn Reson Med, 80(1):224-230. IF: 4.082 5. Varallyay CG, Nesbit E, Horvath A, Várallyay P, Fu R, Gahramanov S,
Muldon LL, Li X, Rooney WD, Neuwelt EA. (2018) Cerebral Blood Volume Mapping With Ferumoxytol in Dynamic Susceptibility Contrast Perfusion MRI: Comparison to Standard of Care. J Magn Reson
Imaging, 48(2):441-448 IF: 3.612
Citable International Abstract
6. Varallyay P, Varallyay CG, Horvath A, Szidonya L, Fu R, Toth G, Neuwelt EA. (2017) Visualisation of normal and abnormal brain vasculature with different ferumoxytol doses. 53rd Annual Meeting of the American-Society-of Clinical Oncology ASCO, J Clin Oncol 35:
(S15) (abstr e13517)
7. OTHER PUBLICATIONS
1. Berényi Ervin, Kövér Ferenc, Várallyay Péter, Szikora István. (2017) Az optimális betegkiválasztást támogató képalkotó diagnosztika alapelvei akut ischaemiás stroke-ban. Magyar Radiológia, 91:(2): 79- 90.
2. Téglási V, Reiniger L, Fábián K, Pipek O, Csala I, Bagó AG, Várallyay P, Vízkeleti L, Rojkó L, Tímár J, Döme B, Szállási Z, Swanton C, Moldvay J. (2017) Evaluating the significance of density, localization, and PD-1/PD-L1 immunopositivity of mononuclear cells in the clinical course of lung adenocarcinoma patients with brain metastasis. Neuro
Oncol, 19(8): 1058-1067. IF: 9.384
3. Fábián K, Gyulai M, Furák J, Várallyay P, Jäckel M, Bogos K, Döme B, Pápay J, Tímár J, Szállási Z, Moldvay J. (2016) Significance of Primary Tumor Location and Histology for Brain Metastasis Development and Peritumoral Brain Edema in Lung Cancer. Oncology,
91(5):237-242. IF: 2.262
4. Várallyay P. (2014) Újdonságok és új lehetőségek az agydaganatok radiológiai diagnosztikájában. Novelties and new possibilities in radiological diagnostics of brain tumors. Magy Onkol, 58(4):261-268.
5. Szűcs Anna, Barcs Gábor, Winkler Gábor, Soós Zsuzsanna, Folyovich András, Kelemen Anna, Várallyay Péter, Kamondi Anita. (2014) Anti- glutamate-decarboxilase antibodies: A liaison between localisation related epilepsy, stiff-person-syndrome and type-1 diabetes mellitus.
Ideggyogy Sz, 67(7-8): 269-271. IF: 0.386 6. Bagó GA, Várallyay P, Osztie E, Fedorcsák I. (2013) Tumort utánzó
barrierzavarok a neuroonkológiai terápia során. Treatment-induced tumor-like lesions in the course of neurooncological therapy. Magy Onkol, 57(4):240-250.
7. Szucs A, Várallyay P, Osztie E, Papp E, Sólyom A, Finta L, Varga D, Barcs G, Holló A, Kamondi A. (2012) Clinical experiences with Creutzfeldt-Jakob disease: three case studies. Ideggyogy Sz, 65(11-
12):401-10. IF:0.348
8. Várallyay Péter. (2011) Az agydaganatok – Onco update, 2010.
Magyar Radiológia, 85(1-2):8-24.
9. Várallyay Peter. Az agydaganatok képalkotó diagnosztikája. In Bodoki Gy (szerk.), Onco Update 2009. Melania Kiadó Kft, Budapest 2009:
142-169.
10. Neuwelt EA, Guastadisegni PE, Várallyay P, Doolittle ND. (2005) Imaging changes and cognitive outcome in primary CNS lymphoma after enhanced chemotherapy delivery. AJNR Am J Neuroradiol,
26(2):258-265. IF: 2.525
11. Osztie É, Várallyay P, Doolittle ND, Lacy C, Jones G, Nickolson HS, Neuwelt EA. Combined Intraarterial Carboplatin, Intraarterial Etoposide Phosphate, and IV Cytoxan Chemotherapy for Progressive Optic- Hypothalamic Gliomas in Young Children. (2001) AJNR Am J
Neuroradiol, 22(5):818-823. IF: 2.240
12. Kiss Zs, Várallyay P, Fazekas P, Kajári É. (1998) High resolution CT signs of pulmonary Histiocytosis-X. Magyar Radiológia, 72(4):99-102.