Iron Oxide Nanoparticles as MRI Contrast Agents in CNS Imaging; Perfusion assessment of
brain tumor therapy using ferumoxytol
PhD Dissertation
Csanád Várallyay M.D.
Semmelweis University
School of Doctoral Studies, Clinical Medicine
Supervisor: Prof. Kálmán Hüttl M.D., Ph.D.
Official Reviewers: Tibor Kovács M.D., Ph.D.
János Martos M.D., Ph.D.
Head of the Final Examination Committee:
Prof. Judit Fidy M.D., Ph.D., D.Sc.
Members of the Final Examination Committee:
Prof. Imre Szirmai M.D., Ph.D., D.Sc.
Péter Barsi M.D., Ph.D.
Budapest
2012
1
1 TABLE OF CONTENTS
1 TABLE OF CONTENTS ... 1
2 LIST OF ABBREVIATIONS: ... 4
3 INTRODUCTION ... 6
3.1 Malignant gliomas ... 8
3.1.1 Neovascularization in gliomas ... 8
3.1.2 MRI of primary brain tumors ... 8
3.1.3 Standard treatment of GBM ... 9
3.1.4 Antiangiogenic therapy ... 9
3.1.5 Monitoring therapy – pseudoprogression and pseudoresponse ... 10
3.2 Magnetic resonance imaging ... 10
3.2.1 High field MRI ... 11
3.2.2 Magnetic properties of matter... 12
3.2.3 What is superparamagnetism? ... 14
3.3 Magnetic resonance imaging contrast agents ... 15
3.3.1 Nephrogenic systemic fibrosis (NSF) and MR contrast agents ... 15
3.3.2 Superparamagnetic iron oxide contrast agents ... 16
3.3.3 USPIO imaging at various magnetic field strength ... 18
3.3.4 Ferumoxytol (Feraheme®) ... 19
3.3.5 Safety of ferumoxytol ... 20
3.3.6 Pharmacokinetics of ferumoxytol ... 20
3.4 Dynamic MRI ... 21
3.4.1 Perfusion-weighted imaging (PWI) ... 21
3.4.2 Issues with CBV calculation... 22
3.4.3 DCE permeability measurement ... 22
4 OBJECTIVES ... 24
2
4.1 Clinical studies: ... 24
4.2 Preclinical studies ... 24
5 METHODS ... 25
5.1 Clinical studies ... 25
5.1.1 Patients... 25
5.1.2 Imaging ... 25
5.1.3 TOF MRA and T1 measurement ... 27
5.1.4 Dynamic MRI scans ... 28
5.1.5 MRI acquisition parameters... 28
5.1.6 Statistical analysis... 29
5.2 Preclinical studies ... 30
5.2.1 Tumor model ... 30
5.2.2 Animal preparation for MRI ... 31
5.2.3 MR imaging at 12T... 32
5.2.4 Ferumoxytol vs. gadodiamide in MR perfusion and permeability ... 34
5.2.5 Study design for monitoring antiangiogenic treatment ... 34
5.2.6 Statistical analysis... 35
6 RESULTS ... 36
6.1 Clinical studies ... 36
6.1.1 Ferumoxytol enhancement time course ... 37
6.1.2 TOF MRA... 41
6.1.3 Quantitative T1 measurement ... 41
6.1.4 DSC perfusion imaging ... 41
6.2 Preclinical studies ... 45
6.2.1 Tumor model ... 45
6.2.2 MR perfusion using gadodiamide vs. ferumoxytol: ... 47
3
6.2.3 CBV changes using ferumoxytol in treated animals ... 49
6.2.4 Gadodiamide permeability changes ... 51
7 DISCUSSION ... 55
7.1 clinical studies ... 55
7.1.1 Delayed ferumoxytol enhancement ... 55
7.1.2 TOF MRA and T1 measurement ... 57
7.1.3 Dynamic imaging ... 57
7.2 Preclinical studies ... 59
7.2.1 Developing the protocol for dynamic MR imaging at 12T ... 59
7.2.2 DSC imaging using gadiodiamide vs. ferumoxytol... 61
7.2.3 Dual agent imaging ... 61
7.2.4 Antiangiogenic drugs vs. corticosteroids... 62
7.2.5 Future directions ... 63
8 CONCLUSIONS ... 64
9 SUMMARY... 65
9.1 Summary in English ... 65
9.2 Summary in Hungarian ... 66
10 REFERENCES ... 67
11 BIBLIOGRAPHY – list of own publications ... 76
11.1 Publications related to the thesis ... 76
11.2 Further scientific publications ... 77
12 ACKNOWLEDGEMENT ... 79
12.1 Conflict of interest: ... 79
4
2 LIST OF ABBREVIATIONS:
1.5T: 1.5 tesla 3D: 3 dimensional 3T: 3 tesla
BBB: blood-brain barrier
BEV: indicates the study group; animals treated with bevacizumab (45mg/kg) CNS: central nervous system
CBF: cerebral blood flow CBV: cerebral blood volume
rCBV: relative cerebral blood volume CKD: chronic kidney disease
CNR: contrast to noise ratio CT: computed tomography
CTR: indicates the control group; animals receiving saline
DEX 2: indicates the study group; animals treated with dexamethasone (2mg/kg/day) DEX 12: indicates the study group; animals treated with dexamethasone (12mg/kg/day) DCE: dynamic contrast enhanced (imaging) - referring to T1w acquisition
DSC: dynamic susceptibility contrast (imaging) - referring to T2*w acquisition EPI: echo planar imaging
FDA: Food and Drug Administration Fe: Iron
FFE: Fast field echo (Philips) equivalent to GRE (Siemens, GE) FOV: field of view
FSE: fast spin echo (General Electric) equivalent to TSE (Siemens and Philips) Gd: Gadolinium
GBCA: gadolinium based contrast agent GBM: glioblastoma
GRE: gradient recalled echo (Siemens, GE) equivalent to FFE (Philips) IF: impact factor
IV: intravenous
MR: magnetic resonance
MRA: magnetic resonance angiography
5
MRI: magnetic resonance imaging MTT: mean transit time
rMTT: relative mean transit time NSF: nephrogenic systemic fibrosis
OHSU: Oregon Health and Science University PE-50: polyethylene 50 (tube)
PWI: perfusion-weighted imaging r: relaxivity
r1: longitudinal relaxivity r2: transverse relaxivity R1: longitudinal relaxation rate RF: radio frequency
ROI: region of interest SE: spin echo
SI: signal intensity SNR: signal to noise ratio
SPIO: superparamagnetic iron oxide SWI: susceptibility-weighted imaging T: tesla
T1w: T1-weighted T2w: T2-weighted TE: echo time T-I: time-intensity TOF: time of flight TR: repetition time
TSE: turbo spin echo (Siemens and Philips) equivalent to FSE (General Electric) TTP: time to peak (in this work indicating the time elapsed between the arrival of
the contrast bolus and maximum signal intensity of the enhancing tissue on dynamic T1-weighted images.)
USPIO: ultrasmall superparamagnetic iron oxide VEGF: vascular endothelial growth factor VSPIO: very small superparamagnetic iron oxide
6
3 INTRODUCTION
High-grade gliomas such as glioblastoma (GBM), anaplastic astrocytoma, and anaplastic oligodendroglioma are commonly treated with radiation therapy with concomitant temozolomide chemotherapy, followed by adjuvant temozolomide. In addition, at recurrence, as a second line therapy patients may receive anti-angiogenic therapy such as bevacizumab (Avastin®), a monoclonal antibody against vascular endothelial growth factor (VEGF) (1). Tumor response is generally determined using the Macdonald treatment response criteria, which is based on post-contrast tumor enhancement on T1-weighted (T1w) magnetic resonance (MR) images. Decreases in tumor vascular permeability and normalization of existing tumor vasculature after bevacizumab treatment (2) can be interpreted as decreased tumor volume and apparent tumor response; however, tumor progression as non-enhancing or infiltrative disease can occur in bevacizumab-treated patients (3). Bevacizumab-induced pseudoresponse, also referred to as pseudoregression, makes radiographic responses challenging to interpret. Similarly, increasing tumor vascular permeability during and after radiotherapy can result in an increasing contrast enhancement, without an increase of the underlying tumor mass, this is called pseudoprogression. Both pseudo-phenomenona confuse the assessment of outcome of brain tumours in clinical practice and in clinical trials. To overcome these issues, alternative endpoints and response criteria are needed (4).
My PhD thesis deals with a magnetic resonance imaging (MRI) contrast agent, an ultrasmall superparamagnetic iron oxide (USPIO) compound, called ferumoxytol, and its application in primary malignant brain tumors. The ultimate goal of these research projects is a “better” detection of brain malignancies, including improved specificity and sensitivity, and the evaluation of early therapeutic changes, overcoming the above mentioned issues with therapy assessment, and thus to help find the optimal therapeutic options.
This dissertation reports preclinical and clinical investigations. For better understanding, I would break the tradition and start with the clinical studies, followed by the preclinical experiments. There are two reasons justifying this; first of all, as chronologically the
7
clinical study was performed before, and most importantly, because results of these clinical investigations raised questions which became objectives in the preclinical experiments. The “Objectives”, “Methods”, “Results” and also “Discussion” sections are divided into two major parts, labeled as “clinical studies” and “preclinical studies”.
The “introduction” discusses important features of brain tumors, focusing on MR imaging. There is a quick review of MRI itself and MR contrast agents. Also, the widely studied and still controversial treatment modality of antiangiogenic therapy will be discussed.
The nomenclature of the various iron oxide compounds can be confusing for the first time, as most of them start with “ferumox…”, such as ferumoxytol (Feraheme ®), our currently studied agent. Ferumoxtran-10 (Combidex ®, Sinerem ®) and ferumoxides (Feridex ®, Endorem ®) will also be mentioned. Throughout this work, we will often compare ferumoxytol with the commonly used gadolinium based contrast agents (GBCA). We avoid the terminology of “gadolinium” or “Gd” when referring to contrast media. GBCA will be used instead. The names of various GBCA, such as gadodiamide (Omniscan®) or gadoteridol (Prohance®) are more familiar from daily clinical practice.
8
3.1 Malignant gliomas
Malignant gliomas, the most common primary brain tumors, are generally highly invasive and extremely vascular tumors. Gliomas are histologically heterogeneous, with components that include varying degrees of cellular and nuclear pleomorphism, mitotic activity, vascular proliferation, and necrosis. GBM, the most malignant glioma, is the most common primary brain tumor, accounting for 12%–15% of all intracranial neoplasms. Despite decades of research and appearance of new treatment modalitites, the prognosis of GBM still remains poor (5).
3.1.1 Neovascularization in gliomas
An important factor in the malignancy of GBM is the ability of the tumor to recruit and synthesize vascular networks for further growth and proliferation. The degree of vascular proliferation is one of the most critical elements in the determination of tumor grade and prognosis for several reasons. First, the degree of vascular proliferation, or angiogenesis, is one of the most important histologic criteria (along with cellularity, mitosis, pleomorphism, necrosis) for determination of the degree of malignancy and grade of the glioma. Second, vascular networks are not only the principal route for delivery of oxygen and nutrients to the neoplastic cells and removal of metabolic waste products, such networks also serve as a path for tumor infiltration along the perivascular spaces. Third, the cerebral capillary endothelium (site of the blood-brain barrier, (BBB)) – composed of a continuous homogeneous basement membrane, numerous astrocytic processes, and tight junctions and an important host defense mechanism responsible for the regulation of movement of molecules – is frequently destroyed by malignant tumor cells. Fourth, a destroyed or altered BBB serves as a diagnostic tool at both computed tomography (CT) and MR imaging by allowing for contrast agent extravasation and, therefore, identification of the tumor (5).
3.1.2 MRI of primary brain tumors
Currently MRI is the most sensitive imaging modality in the diagnosis and follow up of brain tumors. In these patients contrast agent is given routinely, since the detection, characterization, and border delineation of the tumors need a high lesion contrast. This contrast depends on the signal differences between the lesion and the surrounding
9
tissue. Contrast enhanced MRI techniques allow for a better differential diagnosis, grading, therapy decision, and surgical planning, as well as providing a key parameter for follow-up imaging of tumor response to therapy (6). MRI perfusion measurement, especially relative cerebral blood volume (rCBV) measurement in tumors can be associated with tumoral neoangiogenesis. rCBV maps of glioma demonstrate not only the overall vascularity of the tumor but also the inherent heterogeneity and geographic differences within a single tumor. These CBV maps, in conjunction with conventional MR images, can be used to grade gliomas preoperatively, guide stereotactic biopsy, evaluate different tumor types, differentiate between recurrent tumor and delayed radiation necrosis, and monitor tumor response to therapy (5, 7).
3.1.3 Standard treatment of GBM
The current standard of care of high grade gliomas is surgical resection followed by radiotherapy and concomitant and adjuvant temozolomide chemotherapy. This relatively recent standard has been published in 2005 with the conclusion that the addition of temozolomide to radiotherapy for newly diagnosed GBM resulted in a clinically meaningful and statistically significant survival benefit with minimal additional toxicity (8).
3.1.4 Antiangiogenic therapy
In May 2009, the United States Food and Drug Administration (FDA) approved bevacizumab for recurrent GBM. Bevacizumab (Avastin) is a monoclonal antibody targeting VEGF, which is one of the known key regulators of angiogenesis and often overexpressed in high-grade gliomas (9). VEGF inhibitors have been successfully used in patients with high-grade gliomas (10). Along with various antiangiogenic drugs, bevacizumab has been investigated in numerous preclinical and clinical studies (11-13).
Among the new biological agents, bevacizumab has been shown to induce a clinically meaningful proportion of durable responses among patients with recurrent GBM with an acceptable safety profile. Furthermore, data are emerging that bevacizumab induces improvement or preservation of neurocognitive function, suggestive of quality of life improvement, in the majority of poor-prognosis patients who would otherwise be expected to show a sudden, rapid deterioration in quality of life (14). The mechanism of these antiangiogenic agents is still not fully understood, it may include “normalization”
10
of existing vasculature, blocking neovascularization and decreasing edema by decreasing the BBB permeability (15).
3.1.5 Monitoring therapy – pseudoprogression and pseudoresponse
At present, the standard criteria of treatment response in gliomas are based on the GBCA enhancement (6). Tumor progression is considered to have occurred when an increase of >25% in the volume of the contrast-enhancing region is observed. Contrast enhancement, however, in post treatment brain tumors can be nonspecific and changes might not correlate with treatment response as it has been realized when introducing novel therapeutic methods. Therefore the extent of contrast enhancement may not always be considered a true surrogate of tumor response. Both pseudoprogression, an increase in the nontumoral enhancing area, and pseudoresponse, a decrease in the enhancing area, show that enhancement, by itself, is not a measure of tumor activity but rather reflects a disturbed BBB (16). Pseudoprogression can occur shortly after completion of radiotherapy; patients with high-grade brain tumors can present with an increase in contrast-enhancing lesion size, followed by subsequent improvement or stabilization without any further treatment. Pseudoresponse happens when antiangiogenic drugs act on hyperpermeable tumor blood vessels; the apparent decrease in enhancing tumor volume may represent decreased tumor vascular permeability without affecting the underlying tumor mass. This is sometimes referred to as a „steroid- like‟ effect, as glucocorticoids are used routinely in brain tumors to decrease intracranial pressure and edema by decreasing BBB permeability. To increase diagnostic accuracy, it is critical to investigate the utility and reliability of alternative response measures, such as CBV, as measured by dynamic susceptibility contrast (DSC) perfusion MRI, and permeability, as measured by dynamic contrast enhanced (DCE) MRI (17-19).
3.2 Magnetic resonance imaging
MRI is a noninvasive technique that uses magnetic fields to produce high resolution and high-contrast sectional images of tissue structure and function. The principal tissue signal in essentially all clinical MRI arises from water protons. Water concentration can vary significantly between biological tissue. This property is exploited to produce a fundamental contrast in MRI that is known as „proton density contrast‟. In proton density-weighted MRI, the signal intensity (SI) of each voxel is related to the local
11
proton concentration. Another fundamental class of MRI contrast relies on spatial differences in the relaxation properties of the MR signal. There are two principal relaxation processes that characterize MR signals: one that relates how rapidly magnetization parallel to the strong static magnetic field recovers after a perturbation, and the other that describes how rapidly magnetization transverse to the static magnetic field decays after it has been produced by a series of radiofrequency pulses. The constants that characterize these two kinetic processes are referred to as longitudinal and transverse relaxation time constants, T1, and T2, respectively. Generally, on T1w images tissues with short T1 relaxation times will appear signal intense, while on T2- weighted (T2w) images tissues with short T2 relaxation times will appear as signal loss.
This will be important when discussing the relaxation time shortening effect, called relaxivity (r) of MR contrast agents.
There are numerous further parameters influencing SI. These can be exploited to obtain further image contrasts. Amongst them; the Brownian motion of water molecules in diffusion-weighted imaging, tissue blood perfusion in perfusion-weighted imaging (PWI), rapid motion of the water molecules in time of flight (TOF) MR angiography (MRA), and blood oxygenation level dependent contrast in functional MRI etc…
Besides the morphology, many of these MRI techniques can reflect functional and metabolic changes.
3.2.1 High field MRI
The usual clinical MR systems operate on 1 to 3 tesla (T) magnetic field strenghts, most commonly on 1.5T. The principal advantage of MRI at higher field is the increase in signal to noise ratio (SNR). This can be used to improve anatomic and/or temporal resolution and reduce scan time while preserving image quality. Clinical MRI devices for whole body imaging at 3T are gaining wider use and a few experimental whole body 7T MR scanners are also available. Functional MRI and MR spectroscopy benefit significantly from increased magnetic field strength. In addition, high field machines have a great utility in applications such as TOF MRA and diffusion tensor imaging.
Higher contrast may permit reduction of contrast agent doses and, in some cases, earlier detection of disease. Even higher field strengths can be used for imaging of small parts
12
of the body or scientific animal experiments. Preclinical, experimental MR scanners can reach 17.2T (Ultra-High field MRI).
For protons (hydrogen nuclei), the precession frequency of magnetic moments about an external magnetic field (Larmor frequency) is 42.58 MHz/tesla. Higher frequencies at higher field strength negatively influence the tissue penetration of radio frequency (RF) pulses, complicating the development of MR coils. The absorption of RF (microwave) power causes heating of the tissue. The energy deposited in the patient's tissues is fourfold higher at 3T than at 1.5T. The specific absorption rate induced temperature changes of the human body are the most important safety issue of high field MRI.
Tissue contrast can vary on different field strengths, as tissue relaxation is also field strength dependent. Similarly, the relaxivity of contrast agents can show substantial variations at different magnetic field strengths as discussed later.
High field MRI can be more vulnerable for imaging artifacts, such as patient movement, and also chemical shift and susceptibility dispersion increase. However, this latter one can be used for DSC PWI, which is the most common clinically relevant MR perfusion technique, and also one of the main topics discussed in this writing.
3.2.2 Magnetic properties of matter
Magnetism is a fundamental property of matter. The three types of magnetic properties are: diamagnetic, paramagnetic, and ferromagnetic. These three properties are illustrated in Figure 1.
3.2.2.1 Diamagnetism
Outside of a magnetic field, diamagnetic substances exhibit no magnetic properties.
When placed in a magnetic field, diamagnetic substances will exhibit a negative interaction with the external magnetic field. In other words they are not attracted to, but rather slightly repelled by the magnetic field. These substances are said to have a negative magnetic susceptibility. Notable diamagnetic materials are: Bismuth, Silver, Carbon, Copper and water.
3.2.2.2 Paramagnetism
Paramagnetic substances also exhibit no magnetic properties outside of a magnetic field. When placed in a magnetic field, however, these substances exhibit a slight
13
positive interaction with the external magnetic field and are slightly attracted. The magnetic field is intensified within the sample causing an increase in the local magnetic field. These substances are said to have a positive magnetic susceptibility. Paramagnetic materials are for example: Tungsten, Aluminium, Lithium and the clinically most important Gadolinium.
3.2.2.3 Ferromagneism
Ferromagnetic substances are quite different. When placed in a magnetic field they exhibit an extremely strong attraction to the magnetic field. The local magnetic field in the center of the substance is greatly increased. These substances (such as iron) retain magnetic properties when removed from the magnetic field. Objects made of ferromagnetic substances should not be brought into the scan room as they can become projectiles; being pulled at great speed toward the center of the MR imager. An object that has become permanently magnetized is referred to as a permanent magnet (20).
Figure 1
Schematic illustration of three types of magnetic properties of matter. Diamagnetic substances will exhibit a slight negative, paramagnetic substances a slight positive interaction with the external magnetic field, whereas ferromagnetic materials show a strong attraction to the magnetic field (20).
14
3.2.3 What is superparamagnetism?
Superparamagnetism is a special form of magnetism, which appears in small particles of ferromagnetic materials. In sufficiently small nanoparticles, magnetization can randomly flip direction under the influence of temperature. In the absence of external magnetic field, their magnetization appears to be in average zero: they are said to be in the superparamagnetic state. In this state, an external magnetic field is able to magnetize the nanoparticles, similarly to a paramagnet. However, their magnetic susceptibility is much larger than the one of paramagnets.
Normally, ferro- or ferrimagnetic materials undergo a transition to a paramagnetic state above its Curie temperature. Superparamagnetism is different from this standard transition as it occurs below the Curie temperature of the material.
15
3.3 Magnetic resonance imaging contrast agents
Although intrinsic contrast is sufficient for most MRI applications, exogenous contrast agents are used in ~40% of all clinical MRI studies. Typically, these agents are used to increase lesion conspicuity and to improve characterization of blood vessels. Unlike tracers used in x-ray or nuclear medicine imaging, MRI contrast agents are detected indirectly through their ability to catalyze water proton relaxation and perturb MRI SI.
By far, the most widely used MRI contrast agents are those based on the paramagnetic gadolinium [Gd(III)] ion. The Gd(III) ion has seven unpaired electrons and favorable electronic spin relaxation properties that make for very efficient catalysis of water proton relaxation. The Gd(III) ion is chelated to a low-molecular weight ligand to reduce toxicity. After intravenous (IV) injection of these low-molecular weight GBCAs, most will distribute rapidly into all accessible extracellular spaces, and are eliminated from the body through the kidneys with a typical elimination half-life of ~1.6 h.
Contrast agents catalyze relaxation rate constants (the inverse of the time constants: T1 or T2, described above) in a concentration-dependent manner. In simple solutions, the 1/T1 increases linearly with contrast agent concentration. The slope of this dependence is known as the relaxivity, typically reported in units of mmol-1sec-1, and is a measure of how potent the agent is for catalyzing relaxation. Relaxivities typically differ for longitudinal (T1) and transverse (T2) relaxation and vary with magnetic field strength.
The GBCAs are typically used in combination with T1w MRI acquisitions and produce a hyperintense (bright) signal in tissue regions in which the agent accumulates. The low-molecular weight and weak protein binding characteristics of most GBCAs lead to avid extravasation of GBCAs from normal blood vessels in most tissues and abnormal blood vessels in the central nervous system (CNS). These agents have found widespread use for investigations of blood–CNS barrier disruption found in many disease pathologies (21).
3.3.1 Nephrogenic systemic fibrosis (NSF) and MR contrast agents
GBCAs in MRI are used in daily clinical practice and appear safe in most patients, however, NSF is a recently recognized severe complication associated with GBCAs.
NSF is not common but can be severely debilitating and potentially fatal. It affects primarily patients with renal disease, such as stage 4 or 5 chronic kidney disease (CKD;
16
glomerular filtration rate of 30 ml/min per 1.73 m2), acute kidney injury, or kidney and liver transplant recipients with kidney dysfunction. An alternative contrast agent is needed to obtain adequate imaging results while avoiding the risk of NSF in this vulnerable patient group (22).
3.3.2 Superparamagnetic iron oxide contrast agents
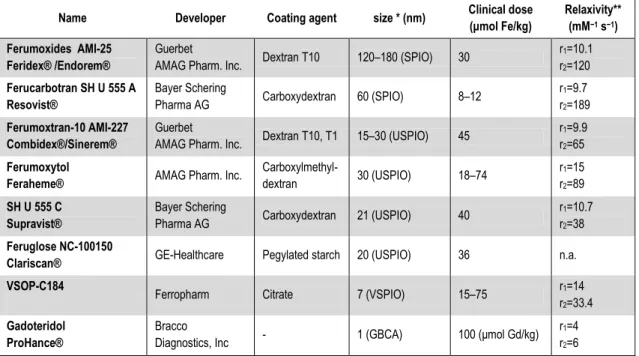
The superparamagnetic iron oxides are based on magnetite (Fe3O4) nanocrystals and are classified as superparamagnetic compounds because the net magnetic dipole moment realized exceeds that expected from the unpaired [Fe(II), Fe(III)] electrons alone. Like GBCAs, the (U)SPIOs do not retain any net magnetism once removed from the strong magnetic field; thermal energy is sufficient to destroy the net magnetic order within the nanocrystal established by the strong magnetic field. There are several imaging agents based on this construct (Table 1). The specific coating imparts differing biological properties. A complete coating protects the molecule against opsonization and endocytosis and bestows a long plasma half-life, of 14 to 30 hours (23). The utility of superparamagnetic iron oxides as MRI contrast agents has been studied for more than two decades (24) and the list of available agents is rapidly expanding (Table 1). These particles can be organized according to their hydrodynamic diameter into several categories (25): standard superparamagnetic iron oxide particles (SPIOs) (50 to 180 nm), ultrasmall superparamagnetic iron oxide particles (USPIO) (10 to 50 nm), and very small superparamagnetic iron oxide particles (VSPIOs) ( < 10 nm). The USPIOs have excellent relaxivities and on a per iron-atom basis compare very favorably with GBCAs.
Unlike the GBCAs, which have similar transverse and longitudinal relaxivities at clinically relevant magnetic fields, the USPIOs have significantly greater transverse relaxivities (r2) compared with longitudinal relaxivities (r1). The contrast effects of iron oxide agents differ across magnetic resonance sequences. On T2w MRI scans, the iron oxide agents demonstrate a decreasing signal with increasing concentration. On T1w MRI scans, ferumoxtran-10 and ferumoxytol produce a decreased signal at high concentrations and an increased signal in areas of low concentration (26, 27). For CNS imaging, T1w scans have proven to be superior for the evaluation of low concentrations of iron oxide nanoparticles across the BBB (28). Enhancement after IV infusion of feruoxtran-10 increases slowly and peaks at approximately 24 hours after
17
administration, then declines during the next several days (29, 30). When administered to patients with CNS abnormalities, ferumoxtran-10 allows the visualization of lesions in which the BBB is defective and/or inflammatory cells (CD68-positive macrophages or glial fibrillary acidic protein-positive reactive astrocytes) take up the particles (28, 31). Subtle defects in the BBB and inflammation may sometimes be detected more readily with iron nanoparticle agents, such as ferumoxtran-10, than with GBCAs (29).
The prolonged enhancement may also be useful in comparing pre- and postoperative tumor burden and can facilitate intraoperative MRI scanning (32).
Table 1. Available superparamagnetic iron oxide agents and Prohance (Gd-based agent) for comparison Name Developer Coating agent size * (nm) Clinical dose
(μmol Fe/kg)
Relaxivity**
(mM−1 s−1) Ferumoxides AMI-25
Feridex® /Endorem®
Guerbet
AMAG Pharm. Inc. Dextran T10 120–180 (SPIO) 30 r1=10.1 r2=120 Ferucarbotran SH U 555 A
Resovist®
Bayer Schering
Pharma AG Carboxydextran 60 (SPIO) 8–12 r1=9.7
r2=189 Ferumoxtran-10 AMI-227
Combidex®/Sinerem®
Guerbet
AMAG Pharm. Inc. Dextran T10, T1 15–30 (USPIO) 45 r1=9.9 r2=65 Ferumoxytol
Feraheme® AMAG Pharm. Inc. Carboxylmethyl-
dextran 30 (USPIO) 18–74 r1=15
r2=89 SH U 555 C
Supravist®
Bayer Schering
Pharma AG Carboxydextran 21 (USPIO) 40 r1=10.7
r2=38 Feruglose NC-100150
Clariscan® GE-Healthcare Pegylated starch 20 (USPIO) 36 n.a.
VSOP-C184 Ferropharm Citrate 7 (VSPIO) 15–75 r1=14
r2=33.4 Gadoteridol
ProHance®
Bracco
Diagnostics, Inc - 1 (GBCA) 100 (μmol Gd/kg) r1=4 r2=6
Currently available intravenous iron oxide nanoparticle contrast agents. Modified from (Corot, Robert et al. 2006)
* Hydrodynamic diameter, laser light scattering
** Relaxometric properties (mM−1 s−1) at 1.5 T, 37 °C, water or in plasma; per mM Gd, or Fe.
Table 1
18
3.3.3 USPIO imaging at various magnetic field strength
One of the major benefits of MR imaging at higher tesla is the general gain in SNR, which can be converted into increased spatial or temporal resolution, image quality or shorter acquisition time (as mentioned previously). The assumption that the increased SNR associated with a higher magnetic field will translate into a higher contrast to noise ratio (CNR) between enhancing and non-enhancing tissue is generally true in GBCA.
The effectiveness of the T1-shortening effect of a contrast agent also depends on the baseline T1 relaxation time of local tissue. With the longer baseline T1 relaxation times brought about by a higher magnetic field strength, the T1-shortening effect of GBCA will be greater, as the relaxivity of such contrast agents changes only marginally between 1.5T and 3T MRI. (34, 35). CNR increases more than two fold at higher field strength comparing 1.5T and 3T MRI using the standard 0.1 mmol/kg GBCA (36). The increased CNR allows the detection of even subtle disruptions in the BBB or could, in principle, be traded to reduce the dose of GBCA for contrast-enhanced brain imaging at 3.0 T (37).
Obviously, for T1-weigthed MRI, signal-enhancement by contrast agents is generally observed as long as the T1-shortening (caused by r1) is the dominant effect of the contrast agent. However, a substantial T2(*)-shortening (caused by r2), where the condition T2(*) >>TE (TE indicates echo time) is no longer fulfilled, counteracts the signal increase in T1w contrast enhanced MRI. Hence, the achievable signal enhancement is under these conditions not only determined by the r1, but also by r2. Therefore, in post contrast T1w MRI larger r1/r2 ratios are favourable.
According to the different field strength dependencies of r1 and r2, generally the r1/r2 ratios decrease with increasing field strength. These alterations of r1/r2 ratios are especially pronounced for (U)SPIO (35) (Figure 2).
Similar considerations apply for T2*w MRI, such as PWI, where lower r1/r2 ratios can be advantageous in addition to high r2 relaxivities (38). For this reason the use of iron oxide nanoparticles and higher magnetic field is beneficial in PWI or high resolution susceptibility-weighted imaging (SWI).
19
Figure 2
Field strength dependencies of r1/r2 ratios. Comparison of GBCA, SPIO and USPIO agents, measured at 37°C in water. (modified from Rohrer et al. (35)). GBCA displays a marginal decrease of r1/r2 whereas SPIOs and especially USPIOs show a considerable decrease with increasing magnetic field strength.
3.3.4 Ferumoxytol (Feraheme®)
Ferumoxytol is an ultrasmall superparamagnetic iron oxide nanoparticle approved by the United States FDA for iron replacement therapy in adults. Ferumoxytol is available for IV injection (30 mg Fe/mL) in single use vials. Each vial contains 510 mg of elemental iron in 17 mL. Ferumoxytol is also gaining utility in MR imaging. Unlike other iron oxide nanoparticle contrast agents, ferumoxytol‟s modified carbohydrate coating allows it to be administered as a bolus without mast cell degranulation. This property makes ferumoxytol suitable for dynamic magnetic resonance studies, such as dynamic MRA and PWI, for which it has already been used in body MRA (39, 40).
Ferumoxytol particles are very large (hydrodynamic diameter ~30nm), in comparison to GBCA (~1nm). They initially remain in the intravascular space early after administration, potentially allowing PWI that is more accurate, MRA of regions with defects in the BBB (i.e., tumors), and delayed imaging to evaluate for enhancement, as
20
with ferumoxtran-10 (29). As an iron replacement agent, Feraheme is given in a dose of 510mg, repeated 3-8 days later. Each of these is equivalent with around 7mg/kg (in a 70kg individual). For MR imaging our study protocols usually use 2, 4 mg/kg, or a single dose of 510mg. Repeated injections are possible if they do not exceeding the therapeutic 2 x 510mg/kg doses.
3.3.5 Safety of ferumoxytol
In a prospective, double-blind, crossover study of more than 700 patients with CKD, the safety of IV bolus of 510mg ferumoxytol was studies and compared with normal saline injection. The rates of treatment-related adverse events were 5.2% and 4.5%, respectively. Serious treatment-related adverse events were seen in one patient in each treatment group. The most common adverse events with ferumoxytol occurred at the injection site (bruising, pain, swelling, erythema). Dizziness, nausea, pruritus, headache, and fatigue occurred in less than 2% of patients receiving ferumoxytol, with a similar frequency noted after administration of normal saline.
Adverse effects related to ferumoxytol were recorded in Phase 3 clinical studies of patients with CKD and iron deficiency anemia. Serious hypersensitivity reactions were reported in 0.2% (3/1,726) of subjects receiving ferumoxytol. Other adverse reactions potentially associated with hypersensitivity (e.g., pruritus, rash, urticaria or wheezing) were reported in 3.7% (63/1,726) of these subjects. Hypotension may follow Ferumoxytol administration. In clinical studies, hypotension was reported in 1.9%
(33/1,726) of subjects, including three patients with serious hypotensive reactions.
Excessive therapy with parenteral iron can lead to excess storage of iron with the possibility of iatrogenic hemosiderosis. (Feraheme drug insert, AMAG Pharmaceuticals, Inc. 2009)
Contraindications of ferumoxytol administarion are: evidence of iron overload, known hypersensitivity to ferumoxytol or any of its components. (41). An observation period of 30 minutes following ferumoxytol injection is recommended.
3.3.6 Pharmacokinetics of ferumoxytol
After IV injection, parenteral iron compounds distribute throughout the intravascular compartment and are slowly removed by phagocytes in the liver, spleen, and bone. Iron is released intracellularly and either stored intracellularly or can be released from the
21
cell and bound by transferrin in the plasma. This iron-transferrin complex can then bind to transferrin receptors on the cell membrane of erythroid precursors, and then be internalized and subsequently incorporated into hemoglobin (23). Plasma half life is around 15h. In larger doses, clearance follows nonlinear, zero-order kinetics and becomes saturable (42). There is no substantial renal elimination of ferumoxytol. Also, hemodialysis does not alter its plasma concentration.
3.4 Dynamic MRI
3.4.1 Perfusion-weighted imaging (PWI)
PWI is mostly performed using first-pass, DSC MR echo-planar imaging approaches (5). The basic principle of PWI using DSC MRI is as follows: the first pass effect of a contrast bolus in brain tissue is monitored by a series of T2*w MR images by scanning the same brain regions repeatedly. The susceptibility effect of a paramagnetic (GBCA), or superparamagnetic (SPIO, USPIO) contrast agent causes a signal loss, which can be converted into an increase of contrast agent concentration (37). From this data, parametric maps of cerebral blood flow (CBF), cerebral blood volume (CBV) and mean transit time (MTT) can be calculated. Regional CBF, CBV and MTT values can be obtained by region of interest (ROI) analysis (43).
PWI in CNS diseases have benefits for 3 major fields: improving accurate diagnosis, biopsy planning and monitoring of therapy. The higher vascularity of brain neoplasms is most commonly quantified with perfusion MR techniques in terms of the CBV of the tumor. CBV is defined as the total volume of blood traversing a given region of brain, measured in milliliters of blood per 100 grams of brain tissue (ml/100 g). CBF is defined as the volume of blood traversing a given region of brain per unit time, measured in milliliters of blood per 100 grams of brain tissue per minute (ml/100 g/min). The definition of MTT is more complex, but it can be thought of as the average time it takes for blood to traverse between arterial inflow and venous outflow, measured in seconds (s). MTT will therefore depend on the path taken by the blood to travel from artery to vein, and as such will depend on local tissue hemodynamics, such as shunts and vessel tortuosity. The concepts of CBF and MTT have not been as fully studied in the context of oncologic imaging as has CBV, despite their widespread application in stroke imaging (5, 44, 45).
22
3.4.2 Issues with CBV calculation
Using the DSC technique, CBV is estimated from the area encompassed by the time - intensity curve, which is inverted in this case, since there is signal loss. DSC PWI is based on the premise that contrast material remains within the intravascular compartment. High permeability or leakiness in regions of marked breakdown of the BBB results in intravascular gadolinium extravasating into the interstitial space.
Extravasation can significantly affect calculations and alter CBV values (46). and this could lead to false results in monitoring tumor therapy especially when primarily microvasculature is targeted (e.g. antiangiogenic therapy). Several methods have been used to correct, or more appropriately, compensate for the unwanted effect of extravasation on rCBV calculations, including mathematical algorithms, such as excluding portions of the SI time curve from the calculations. This corrective method still leads to underestimation of the rCBV. Another method, sloping baseline, leads to artifactually high rCBV. One of the most common contrast material extravasation correction methods is administration of a loading dose of GBCA before DSC PWI acquisition. This is referred to as the “preload method”. This could increase the diagnostic accuracy, however it seems to be dose-dependent and was found to be inconsistent in longitudinal studies assessing antiangiogenic treatment (47). Therefore the use of a blood pool agent (such as the bolus injectable USPIO ferumoxytol, or SHU 555 C) would be favorable by eliminating the permeability dependence of CBV estimation. Furthermore due to its more effective T2 relaxation time shortening (r2), a more pronounced signal drop can be reached without the need of injecting large contrast bolus volumes with a high flow rate.
3.4.3 DCE permeability measurement
The angiogenic process is heterogeneous within tumors, with some vessels demonstrating maturity and other vessels demonstrating incomplete layers with high permeability and fragility. Angiogenic vessels in the tumor have large gaps between the endothelial cells, the endothelium, and the basement membranes, as well as between the basement membrane and the pericytes, making the vessels hyperpermeable to many macromolecules. These properties can be exploited by DCE-MRI. MR contrast agents that leak slowly through the normal vasculature are able to pass more quickly through
23
tumor vessels to produce differential enhancement. This results in a fast “wash-in” of contrast coupled with the rapid “wash-out,” and allows a functional analysis of the tumor microcirculation (48). DCE-MRI is performed by repeated (dynamic) T1w imaging of tissue started immdiately after injection of low-molecular-weight contrast media. If a reliable arterial input function (AIF) can be obtained, the rate of contrast agent leakage can be quantified. Tofts et al (49) proposed the terms volume transfer constant (Ktrans) (min-1), the volume of extravascular extracellular space (EES) per unit volume of tissue (ve) and the flux rate constant between EES and plasma (kep) (min-1) as outcome parameters derived from a two-compartment general kinetic model, which is the most widely accepted model. There are numerous publications using a newer, three-site equilibrium water exchange model (50).
24
4 OBJECTIVES
4.1 Clinical studies:
Ferumxytol has not been used before as an imaging agent in the CNS. The clinical objective of my work was to investigate the potential for this USPIO as an MR contrast agent in CNS malignancies:
1. Evaluation of enhancement time course, and comparison with standard GBCA enhancement on T1w scans.
2. Assessing the utility of ferumoxytol in various MR imaging techniques, such as T2* weighted imaging, TOF MRA and PWI, using the DSC technique.
3. Comparison of MR imaging using ferumoxytol at various magnetic field strengths.
4.2 Preclinical studies
My further research with ferumoxytol was focused on standardized preclinical experiments, allowing a more objective assessment of this iron oxide compound in dynamic PWI of brain tumors using a 12T experimental MR system. The ojectives were:
4. To develop a study protocol, including an intracranial tumor model in rats, and serial dynamic MR imaging at 12T with bolus injection of ferumoxytol and GBCA.
5. Comparison of dynamic imaging using ferumoxytol vs. GBCA.
6. Detection of early therapeutic changes of the antiangiogenic drug, bevacizumab, using a dual agent MR imaging method (ferumoxytol for perfusion assessment and GBCA for permeability estimation)
25
5 METHODS
5.1 Clinical studies
The clinical data presented in this work is derived from an imaging study, which has been completed and published (33). The study was sponsored by the National Cancer Institute and approved by the FDA and the Oregon Health & Science University (OHSU) institutional review board.
5.1.1 Patients
The study consisted of 12 patients with primary or secondary brain malignancies. All patients provided written informed consent before enrollment in the study. Laboratory tests were performed within 14 days before entry in the study. Patients who were pregnant, younger than 18 years old, had a known allergy to the contrast agents, or had hemochromatosis, liver function insufficiency, or uncal herniation were excluded. No chemotherapy or other treatments were administered to the patients between the time of the baseline scan and the ferumoxytol infusion. Patients underwent multiple MRI scans as Figure 3 describes.
5.1.2 Imaging
5.1.2.1 Contrast agents used in the study
Gadodiamide (Omniscan; GE Healthcare AS, Oslo, Norway) was used in all scans in which GBCA was required in a dose of 2 x 0.1mmol/kg. The investigational agent ferumoxytol (Advanced Magnetics, Inc., Cambridge, MA) was provided by the manufacturer. Ferumoxytol was injected in total 4mg/kg (1mg/kg undiluted (~2ml of the 30mg/ml solution) as a bolus for dynamic imaging, and the rest 3mg/kg was administered diluted)
26
Figure 3
Imaging schedule; each patient had an initial MRI scan with and without gadodiamide.
Patients were randomized to a 1.5T MRI (Horizon LX; GE Medical Systems, Milwaukee, WI), or to a 3T MRI (Intera; Philips, The Netherlands) for the initial and for the subsequent dynamic scans. Delayed MRI scans were obtained at 4 to 6 hours, 16 to 20 hours, 24 to 28 hours, 48 to 52 hours, and longer than 72 hours after infusion for each patient on both 1.5- and 3T magnets.
5.1.2.2 Ferumoxytol enhancement time course
To evaluate delayed contrast enhancement with ferumoxytol, MRI scans were obtained at 4 to 6 hours, 16 to 20 hours, 24 to 28 hours, 48 to 52 hours, and longer than 72 hours after infusion for each patient on both 1.5- and 3T magnets using standard T1w, standard T2w, T2*w axial scans (Figure 3). To analyze the changes in ferumoxytol enhancement in tumor and normal tissue, the baseline noncontrast T1w and all post- ferumoxytol T1w scans for each patient were aligned to the baseline scan via a semiautomated coregistration technique implemented using BrainVoyager QX (Brain Innovations BV, Maastricht, The Netherlands). In each patient, a tumor ROI and an ROI of normal apperaring brain tissue were defined and applied to the coregistered scan.
ROIs of enhancing lesions were defined using a semiautomated method. The control ROIs were used to correct for changes in SI in healthy tissue, resulting from fluctuation
27
in scanner sensitivity across time and nonspecific enhancement in normal tissue, using a custom program implemented in Mathlab7 (Mathworks). For each field strength, the time of the maximum SI on T1w images was determined in each patient and the average of the relative SIs was plotted as a function of time. Data from patients with intervening surgery were not included after surgery because of changes in SI that may be caused by blood products in the operative field (51, 52). Five patients had additional imaging performed with a low-field 0.15-T intraoperative MRI scanner (Polestar N10 or N20;
Medtronic, Louisville, CO) during surgery 24 to 48 hours after ferumoxytol administration. T1w axial sequences using preset standard parameters provided with the system were obtained intraoperatively. The extent of the enhancement was estimated bidimensionally. On representative slices, the largest diameter was averaged by its perpendicular diameter and plotted as a function of time. For qualitative analysis, ferumoxytol enhancement was compared with gadodiamide by the same unblinded reviewers. The regional correlation of enhancement, the enhancement characteristics, and intensity were noted.
5.1.3 TOF MRA and T1 measurement
TOF MRA (n=6) and T1 measurement (n=5) was performed in patients randomized to the 3T MRI for dynamic imaging. Quantitative T1 measurement was permormed before and within 20 minutes after contrast administration in order to detect subtle contrast agent extravasation early after injection. T1 values were obtained in ROIs of the tumoral, peritumoral, and control areas using a multishot “Look-Locker” imaging sequence for five patients. The regional uptake of contrast agent can be assessed quantitatively by T1w changes, independent of any other effects such as T2w changes, and magnetic susceptibility-related signal changes. The longitudinal relaxation rate (R1=1/T1) changes in linear proportion to the local contrast agent concentration in blood and tissue (53, 54). The values of R1 in the enhancing lesion and the peritumoral region were normalized by the R1 value in a remote control area to assess the differential contrast between lesions or lesion periphery. Similarly TOF-MRA was performed before and 15-20 minutes following contrast agent administration. Images were assessed visually comparing images without contrast, with gadodiamide or with ferumoxytol.
28
5.1.4 Dynamic MRI scans
DSC scans were performed either at 1.5 or 3T. Three patients underwent 1.5T dynamic MRI scans and the remainder underwent 3T dynamic MRI scans. For perfusion evaluation, ROIs of the enhancing tumor and peritumoral area (surrounding abnormal T2w signal areas) and in control areas (normal appearing white and/or gray matter) were chosen by one of the authors (CGV) (55). Time-intensity (T-I) curves, CBV parametric maps and rCBV values (56) (as the area under the SI) curve, normalized by the area under the curve for the control region) were obtained using a dedicated workstation (Advantage Windows 4.2. with Functool software; GE Healthcare, Milwaukee, WI). Relative MTT (rMTT) values were obtained by γ-variate fitting the T- I curves (57), using the Mathlab environment (Mathworks, Natick, MA).
5.1.5 MRI acquisition parameters
All MRI scans were acquired with a field of view (FOV) of 230 to 240 mm (unless otherwise indicated) using 3-mm thick contiguous in the axial plane and 5-mm thick slices with a 1-mm interslice gap in the sagittal plane.
5.1.5.1 1.5-Tesla unit:
MRI acquisitions included T1w sagittal spin echo (SE) images with a repetition time (TR) of 500 ms and an echo time (TE) of 9 ms, T1w axial SE images with a TR of 600 ms and a TE of 20 ms, T2w axial echo planar imaging (EPI)- SE images with a TR of 4000 ms and a TE of 91 ms, T2w axial EPI gradient recalled echo (GRE) images with a TR of 550 ms, a TE of 23 ms, and a flip angle of 10 degrees), PWI EPI-SE images with a TR of 2600 ms and a TE of 80 ms, 1 image/s matrix 64 x 64.
5.1.5.2 3-Tesla unit
Scans were optimized for 3T, including T1w sagittal SE images (TR, 525 ms; TE, 10 ms), T1w axial turbo spin echo (TSE) images (TR, 700 ms; TE, 7.2 ms; TSE factor, 3), T1w axial fast field echo (FFE) images (TR, 150 ms; TE, 2 ms; flip angle, 80 degrees), T2w axial TSE images (TR, 3000 ms; TE, 80 ms; TSE factor, 15), T2w axial FFE images (TR, 1534 ms; TE, 16 ms; flip angle, 18 degrees), PWI EPI (TR, 35 ms; TE, 28 ms), 1 image/s, matrix 128 x 128., three-dimensional TOF MRA: GRE (TR, 14.7 ms;
TE, 2.4 ms; flip angle, 20 degrees; FOV, 250 mm; matrix, 1024 x 1024; slice thickness,
29
0.5mm), and quantitative T1 measurement (segmented GRE cine with nonslice selective inversion pulse (TR, 6.3 ms; TE, 3 ms; flip angle, 10 degrees; matrix, 240 x 200; slice thickness, 280 mm) sequences.
5.1.6 Statistical analysis
In DSC PWI studies for statistical analyses, Student‟s t tests were used to determine the significance of the quantitative perfusion parameters. Unpaired t-tests compared the enhancing region and the surrounding non-enhancing area with abnormal T2w signal and paired t-tests compared the same ROIs with ferumoxytol versus GBCA.
In quantitative T1 measurement, R1 values before and after contrast were compared via the linear mixed effects model to account for correlations between repeated measurements (with gadodiamide and ferumoxytol) in the same subject.
30
5.2 Preclinical studies
5.2.1 Tumor model
The U87 human glioma intracerebral xenograft model was selected for the study because it is known to be a vascular tumor that overexpresses VEGF (58) and has previously been used to study antiangiogenic treatment response (59). U87MG human glioma cells were cultured in Dulbecco‟s Modified Eagle‟s medium supplemented with 10% fetal bovine serum and antibiotics. The care and use of animals was approved by the Institutional Animal Care and Use Committee and were supervised by the OHSU Department of Comparative Medicine. Male athymic nude rats (rnu/rnu, 252 to 332 g;
from the OHSU BBB Program in-house colony) were anesthetized with intraperitoneal ketamine (60 mg/kg) and intraperitoneal diazepam (7.5 mg/kg). Because of previous inconsistencies of this tumor model, all rats were treated with cyclophosphamide (300mg/m2 i.p.) 24 h prior to tumor implantation to increase tumor growth (60).
Animals received 1.2 to 1.5 * 106 of > 90% viable U87MG cells in a volume of 15µL, stereotactically injected in the right caudate nucleus (vertical, bregma 5 mm; lateral, bregma 3 mm). The needle was initially advanced to a depth of 6.5 mm and then withdrawn to a depth of 5 mm to limit reflux up the needle track. The animals were examined daily and weighed at least weekly. Animals were sacrificed if they showed severe clinical signs or symptoms, or > 20% weight loss. Tumor growth was monitored weekly using MRI starting 14 days after implantation. Studies were started when tumor volumes reached at least 50 mm3. Animals without tumor growth were sacrificed at week 7.
5.2.1.1 Histology
After animals had to be sacrificed the brains were excised and fixed in 10% buffered formalin for vibratome sectioning at 100 µm in the coronal plane. Histology sections were stained with hematoxylin. For USPIO localization, iron histochemistry was performed using the Diaminobenzidine-enhanced Perl‟s stain (26).
31
5.2.2 Animal preparation for MRI
5.2.2.1 Sedation for MRI
When performing serial MR imaging in rats, especially in intracranial tumor bearing rats, one of the major issues is the anesthesia. The intraperitoneal ketamine – diazepam combination, which was used for tumor inoculation appeared to be unsafe in our tumor bearing animals. Overdosing caused cardio-respiratory insufficiency and death, insufficient doses caused substantial motion artifacts. Therefore (except for the first few animals) in the current study an other drug, medetomidine (0.6 mg/kg, Domitor, Pfizer Animal Health, Exton, PA, USA) was applied intraperitoneally, combined with reduced dose of ketamine (15mg/kg). This resulted in a 1 to 2 hour long motionless deep sedation. After the MRI, medetomidine was reversed using 1 mg atipamezole (Antisedan, Pfizer Animal Health, Exton, PA, USA).
5.2.2.2 Preparing the animals for contrast agent injection
Dynamic contrast studies need a reliable venous access for rapid bolus contrast agent injection followed by a saline flush. It could be problematic in small animals as the number of available veins is limited. Many studies use the tail vein. This needs a preparation before each imaging session. Tail veins of our animals were small, and veins were needed at least 4 times on four consecutive days with a relatively high flow rate, therefore we did not decide on tail vein injection. Another possibility would have been the femoral vein. Although it requires a minor surgery with a skin incision above the vessel, femoral vein is often used for IV contrast agent imaging, or applying continuous anesthesia.
For our study we decided on a third method. A catheter in the external jugular vein was placed surgically prior to the first MRI session. This was performed under surgical stereo-microscope. After preparing the vessel, its distal part we occluded with a tight suture. Proximal from this suture a small longitudinal incision was made using micro scissors, and a sterile Polyethylene 50 (PE-50) tube was inserted into the vein and advanced 1 to 2 cm toward the heart. After tightening the catheter around the vein, it was tunneled subcutaneously to the back of the animal, and fixed to the skin. The skin incision on the neck was sutured. This catheter could be used for dynamic contrast (DCE and DSC) MR imaging. After each imaging session, jugular catheters were
32
flushed with 0.5ml of heparinized saline (5 to 50 U/mL), and then sealed by heat, and were preserved under the back skin for the dynamic MR session the next day. Drugs for tumor treatments (e.g. bevacizumab, see later) were applied through this catheter too.
Animals with jugular catheters were kept in separate cages.
5.2.3 MR imaging at 12T
Animals with jugular catheters were placed in the 12T MRI scanner (Bruker, Billerica, MA, USA). Throughout MR scans, warm water was circulated under the animals to keep them warm, and oxygen saturation and heart rate were monitored. A 7-cm quadrature birdcage coil was used to transmit radiofrequency, and a 2-cm surface coil, placed on the animal‟s head, was used to receive radiofrequency. Both coils were actively decoupled. High-resolution anatomical T2w scans were performed in both the coronal and axial planes for accurate planning of dynamic MR imaging (DSC and DCE studies). TR: 1560ms, TE: 21.3ms, echo train: 8, FOV: 2.3 x 2.4 cm2, matrix 192 x 392.
5.2.3.1 Technical issues with contrast bolus delivery
Standardization of the injected contrast bolus was crucial for reproducibility. This however posed problems for the following reasons: The infusion pump had to be placed outside of the magnet room, due to the high magnetic field strength, and the distance between the infusion pump and the animal was long, measuring more than 4 meters.
Also, relatively small volumes had to be injected (60µl of contrast agent), with a constant flow rate.
To ensure precise delivery, the end of the catheter was preloaded with contast agent.
The injected volume of 60µl was equivalent to 22 cm of the PE-50 Tube. The dark brown color of ferumoxytol made this measurement simple. The transparent gadodiamide (Omniscan) contrast agent was stained with a small amount of Ewans blue for easier differentiation from saline. Proximal and distal from this preloaded contrast agent, the tubes were filled with saline. The mixing of the saline and contrast agent could be prevented by allowing a minimal air bubble in both ends of the contrast bolus in the PE-50 tube.
To provide a consistent flow rate we used an infusion pump. The distance between the pump and the animal was first bridged using a saline filled PE-50 (very thin and flexible) tube. Due to the high resistance, and distensibility of this tube the contrast
33
bolus administration became delayed and the bolus stretched out, the flow rate became inconsistent and has also decreased. A viable solution overcoming this issue was the use of 3 human perfusion tubes (with larger inner diameter) connected together and filled up with saline and connected at one end to the injector, and on the other end to the PE-50 tube which was previously filled with contrast agent. This rigid system provided a better coupling between the infusion pump and the animal. The contrast bolus remained short as planned.
5.2.3.2 Dynamic MR imaging parameters
In this work the following terminology is used. DSC imaging will indicate a T2*w rapid acquisition. The main purpose of this scan type is to obtain a signal drop as the bolus contrast passes the brain. This technique is used for brain perfusion measurement. The DCE technique will indicate a T1w rapid image acquisition. Primarily the BBB permeability of a contrast agent can be studied. High permeability will result in a rapid and intense positive enhancement peak after contrast administration.
For the DSC gradient echo images, the following parameters were used: TR 9.7 ms, TE 4.0 ms, flip angle 51, slice thickness 1.4mm, rectangular FOV 3.6 * 2.6 cm2, 128 read- out points, and 64 phase encode lines, zero filled to 128 lines. These resulted in a 0.6- sec per image time-resolution and an in-plane (zero filled) spatial resolution of 280 µm
* 200 µm. During this, rapid single slice coronal T2*w image acquisition, 60µl of undiluted contrast agent was injected as a short bolus using an infusion pump, followed by a saline flush of 240 µl at a 3 ml/min flow rate.
DCE was performed using 60µL of preloaded, twofold diluted (250mmol/l) gadodiamide bolus (Omniscan, GE Healthcare, Waukesha, WI, USA) followed by 240 µl saline flush administered at a 1 ml/min flow rate during rapid repeated single-slice T1w image acquisition. For these DCE gradient echo images, the following parameters were used: TR 25.0 ms, TE 1.7 ms, flip angle 20, slice thickness 1.0 mm, rectangular FOV 5.1 x 2.6 cm2, 128 read-out points, and 64 phase encode lines. These resulted in a 1.6-s per image time-resolution, and an in-plane (zero filled) spatial resolution of 400 µm * 400 µm. Inflow saturation slices, having a thickness of 3.0mm and a gap of 1.0mm from the slice of interest, were applied both anterior and posterior to the slice of interest.