ORIGINAL INVESTIGATION
Transcriptomic alterations in the heart
of non-obese type 2 diabetic Goto-Kakizaki rats
Márta Sárközy1, Gergő Szűcs1,2, Veronika Fekete1, Márton Pipicz1, Katalin Éder3, Renáta Gáspár1, Andrea Sója1, Judit Pipis4, Péter Ferdinandy4,5, Csaba Csonka1 and Tamás Csont1*
Abstract
Background: There is a spectacular rise in the global prevalence of type 2 diabetes mellitus (T2DM) due to the worldwide obesity epidemic. However, a significant proportion of T2DM patients are non-obese and they also have an increased risk of cardiovascular diseases. As the Goto-Kakizaki (GK) rat is a well-known model of non-obese T2DM, the goal of this study was to investigate the effect of non-obese T2DM on cardiac alterations of the transcriptome in GK rats.
Methods: Fasting blood glucose, serum insulin and cholesterol levels were measured at 7, 11, and 15 weeks of age in male GK and control rats. Oral glucose tolerance test and pancreatic insulin level measurements were performed at 11 weeks of age. At week 15, total RNA was isolated from the myocardium and assayed by rat oligonucleotide microarray for 41,012 genes, and then expression of selected genes was confirmed by qRT-PCR. Gene ontology and protein–protein network analyses were performed to demonstrate potentially characteristic gene alterations and key genes in non-obese T2DM.
Results: Fasting blood glucose, serum insulin and cholesterol levels were significantly increased, glucose tolerance and insulin sensitivity were significantly impaired in GK rats as compared to controls. In hearts of GK rats, 204 genes showed significant up-regulation and 303 genes showed down-regulation as compared to controls according to microarray analysis. Genes with significantly altered expression in the heart due to non-obese T2DM includes func- tional clusters of metabolism (e.g. Cyp2e1, Akr1b10), signal transduction (e.g. Dpp4, Stat3), receptors and ion channels (e.g. Sln, Chrng), membrane and structural proteins (e.g. Tnni1, Mylk2, Col8a1, Adam33), cell growth and differentia- tion (e.g. Gpc3, Jund), immune response (e.g. C3, C4a), and others (e.g. Lrp8, Msln, Klkc1, Epn3). Gene ontology analysis revealed several significantly enriched functional inter-relationships between genes influenced by non-obese T2DM.
Protein–protein interaction analysis demonstrated that Stat is a potential key gene influenced by non-obese T2DM.
Conclusions: Non-obese T2DM alters cardiac gene expression profile. The altered genes may be involved in the development of cardiac pathologies and could be potential therapeutic targets in non-obese T2DM.
Keywords: Spontaneous diabetes mellitus, Inherited diabetes mellitus, Non-obese type 2 diabetes mellitus, Myocardium, DNA microarray, GO, String, Insulin resistance
© 2016 The Author(s). This article is distributed under the terms of the Creative Commons Attribution 4.0 International License (http://creativecommons.org/licenses/by/4.0/), which permits unrestricted use, distribution, and reproduction in any medium, provided you give appropriate credit to the original author(s) and the source, provide a link to the Creative Commons license, and indicate if changes were made. The Creative Commons Public Domain Dedication waiver (http://creativecommons.org/
publicdomain/zero/1.0/) applies to the data made available in this article, unless otherwise stated.
Background
Diabetes mellitus is a heterogeneous chronic metabolic disorder characterized by hyperglycemia as a common feature resulting from impaired insulin secretion, insulin resistance, or both [1]. In 2014, the global prevalence of
diabetes mellitus (DM) was estimated to be 9 % among adults according to WHO data [2]. The total number of people suffering from DM is projected to almost triple from 190 million to 552 million by 2030 [3, 4]. T2DM accounts for more than 90 % of all diabetes cases and its incidence is continuously rising worldwide [1, 5, 6]. The major cause for this phenomenon is the so-called obesity epidemic due to physical inactivity and increased con- sumption of energy-rich food [7]. Nevertheless, it is often
Open Access
*Correspondence: csont.tamas@med.u-szeged.hu
1 Department of Biochemistry, Faculty of Medicine, University of Szeged, Dóm tér 9, Szeged 6720, Hungary
Full list of author information is available at the end of the article
neglected that around 20 % of T2DM patients are non- obese in Europe and Asia [7–10]. The non-obese T2DM phenotype is characterized by a more pronounced reduc- tion in insulin secretion and less severe insulin resist- ance as compared to obese T2DM patients [7]. The risk of T2DM in non-obese individuals is considered to be mostly influenced by polygenic inheritance and prenatal environment [7].
It is well known that diabetic patients have an increased risk of developing a number of co-morbid- ities including cardiovascular diseases (CVD). It has been reported that T2DM patients have a two to four- fold increased risk of CVD in general [7, 11, 12]. Obe- sity is recognized as an independent risk factor for both T2DM and CVD [7, 13]. Interestingly, it has been reported that non-obese T2DM patients also have a high risk of CVD similarly to that of obese T2DM patients [7, 11, 14]. Indeed, CVD are estimated to be responsible for more than 50 % of deaths among T2DM population [15].
One of the major pathologies of the aforementioned CVD is diabetic cardiomyopathy (DCM) [15, 16]. DCM is defined as left ventricular (LV) diastolic and/or sys- tolic dysfunction with hypertrophy and fibrosis in the absence of preceding hypertension, coronary artery dis- ease and valvular or congenital heart disease [15–17].
Although DCM is a distinct clinical entity, it is also a part of the diabetic atherosclerosis process [18]. DCM might be independent of the coexistence of arterial hypertension, coronary artery disease or other macro- vascular complications [18]. DCM is characterized by the development of myocardial damage, reactive hyper- trophy and fibrosis, structural and functional changes of the small coronary vessels, and cardiac autonomic neu- ropathy [18]. These alterations make the diabetic heart more susceptible to ischemia and subsequent remodel- ling [18–20].
We have previously shown that cardiac gene expression pattern is significantly altered in obese ZDF rats, a model of T2DM and metabolic syndrome [21], and in strepto- zotocin-induced T1DM rats [22] at the transcript level.
The effect of non-obese T2DM on gene expression pat- tern in various tissue types has been investigated in a few studies. Pancreatic islets [23, 24], liver [25], skeletal mus- cle [26], adipose tissue [27], hippocampus and prefron- tal cortex [28] obtained from the well-known non-obese T2DM model Goto-Kakizaki (GK) rat showed altered gene expression pattern as compared to controls. Sur- prisingly, whole transcriptomic analysis in the heart of GK rats has not been performed previously. Therefore, in the present study, our aim was to investigate the effect of non-obese T2DM on cardiac alterations of the transcrip- tome in GK rats.
Methods Ethics approval
This investigation conforms to the National Institutes of Health Guide for the Care and Use of Laboratory Animals (NIH Pub. No. 85–23, Revised 1996) and was approved by the Animal Research Ethics Committee of the University of Szeged.
Animal model of non‑obese T2DM
Male Goto-Kakizaki rats and their age-matched male Wistar controls were obtained from Charles River Laboratories at the age of 6 weeks and were housed at 22 ± 2 °C with a 12:12-h light–dark cycle. The rats received standard rat chow and water ad libitum for 9 weeks after their arrival. The GK rat is a recognized model of inherited type 2 diabetes mellitus [29]. This spontaneously diabetic rat strain was developed by selec- tive breading of Wistar rats with the highest normal blood glucose levels in response to oral glucose toler- ance test [30, 31]. GK rats develop a non-obese and mild hyperglycemic phenotype at week 4–5 accompanied by a metabolic state of glucose intolerance and later periph- eral insulin resistance [29, 32] which develops to a hyper- glycemic insulin-deficient state with aging [29, 32–34].
The metabolic features manifested in this animal model are in many ways similar to the pathogenesis of inher- ited spontaneous T2DM in humans [29, 32]. However, hyperglycemia and glucose intolerance developed in GK rats are not associated with the development of obesity or hypertension [1]. The adult GK rat of T2DM has been shown to develop cardiovascular complications includ- ing left ventricular hypertrophy, fibrosis, as well as dias- tolic and/or systolic dysfunction [1, 20, 35, 36]. Therefore, the GK rat is an applicable model for investigation of the consequences of non-obese T2DM in the heart.
Experimental setup
Body weight, serum glucose, insulin, cholesterol levels and homeostasis model assessment-estimated insulin resistance (HOMA-IR) were determined at 7, 11 and 15 weeks of age in order to monitor the basic parameters of glucose and lipid metabolism and insulin resistance in GK and control rats (Figs. 1, 2, 3). Oral glucose toler- ance test (OGTT) was performed at week 15 to further characterize glucose homeostasis of GK and control rats (Fig. 2). At 15 weeks of age, rats were anaesthetized using pentobarbital sodium (Euthasol, 50 mg/kg, Produlab Pharma b.v., Raamsdonksveer, The Netherlands). Hearts and pancreata were isolated, and then hearts were per- fused according to Langendorff as described earlier [21, 37]. After 5 min perfusion ventricular tissue was frozen and stored at −80 °C until gene expression analysis by DNA microarray and qRT-PCR techniques.
Serum glucose level measurements and OGTT
As described previously, rats were fasted overnight (12 h) prior to serum glucose level measurements and OGTTs (weeks 7, 11 and 15) to verify the development of hyper- glycemia and glucose-intolerance as diagnostic crite- ria of diabetes mellitus [21, 22, 36]. Blood samples were collected from the saphenous vein. Blood glucose levels were measured using AccuCheck blood glucose moni- toring systems (Roche Diagnostics Corporation, USA, Indianapolis) [21, 22, 38]. In case of OGTT, after the measurement of baseline glucose concentrations, 1.5 g/
kg body weight glucose was administered per os via gav- age and blood glucose levels were checked 30, 60 and 120 min later [21, 22, 38]. Area under the curve values for OGTT was also calculated.
Measurement of serum and pancreatic insulin levels Serum and pancreatic insulin levels were measured by an enzyme-linked immunosorbent assay (Merco- dia, Ultrasensitive Rat Insulin ELISA) as described
previously [21, 22, 38]. Blood samples were collected from the saphenous vein at weeks 7, 11 and 15. At week 15, during OGTT blood was collected at 0, 30 and 120 min for serum insulin level measurements.
Blood samples were centrifuged (4500 rpm for 10 min at 4 °C) and kept at −20 °C until the assay was per- formed. At week 15, pancreata were removed, trimmed free of adipose tissue and weighed. Pancreata were homogenized in 6 mL cold acidified-ethanol (0.7 M HCl: ethanol, 1:3 v/v) with an Ultraturrax homog- enizer and were kept at 4 °C for 24 h. Then pancreas homogenates were centrifuged (900g for 15 min at 4 °C), and the supernatants were stored at 4 °C. The pellet was extracted again with 3 mL acidified ethanol for 24 h at 4 °C. The supernatant obtained after cen- trifugation was pooled with the previous one and kept at −20 °C until assayed. Insulin ELISA was carried out according to the instructions of the manufacturer from either sera or homogenized pancreatic tissue samples of GK and control rats.
0 4 8 12
week 7 week 11 week 15
Fasng blood glucose (mmol/L)
*
#
*
0 1 2 3 4
week 7 week 11 week 15
Serum cholesterol (mmol/L)
*
* *
0 2 4 6
week 7 week 11 week 15
Serum insulin (ng/mL)
*
0 1 2
week 7 week 11 week 15 HOMA-IR (mmol/L*ng/mL)
*
* a
c
b
d
Control GK
#
*
#
*
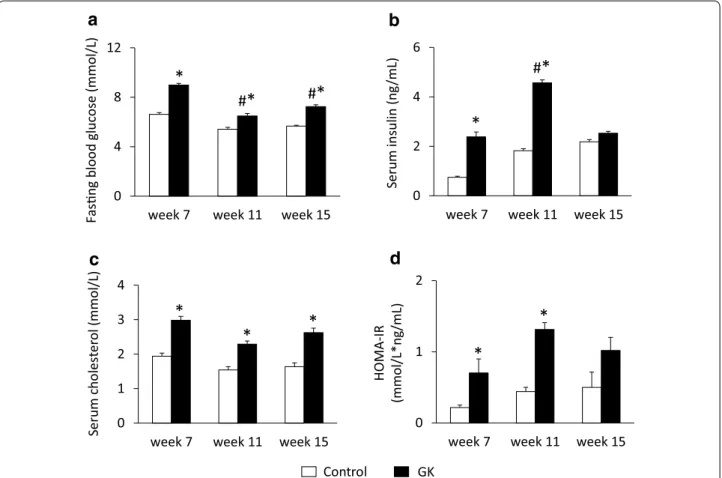
Fig. 1 Fasting blood glucose, serum insulin and cholesterol levels. Fasting blood glucose (a), serum insulin (b) and cholesterol (c) levels as well as HOMA-IR index (d) at weeks 7, 11 and 15 in both control and GK rats. Values are mean ± SEM, n = 7–9, *p < 0.05 vs. control within the same time point, #p < 0.05 vs. week 7 values
HOMA‑IR index
To estimate insulin resistance in GK or control rats the widely used HOMA-IR index was calculated [21, 39] by multiplying fasting serum insulin (μg/mL) with fasting blood glucose (mmol/L), then dividing by the constant 22.5, i.e. HOMA-IR = (fasting serum insulin concentra- tion × fasting blood glucose concentration)/22.5.
Measurement of serum cholesterol levels
In order to follow up the development of hypercholester- olemia which is a risk factor of cardiovascular diseases, serum cholesterol levels were measured at weeks 7, 11 and 15 using a test kit (Diagnosticum Zrt., Budapest, Hungary) as described previously [21, 40, 41].
RNA preparation and DNA microarray analysis
Total RNA was isolated from heart samples with Qia- gen miRNeasy Mini Kit according to the manufacturer’s protocol (Qiagen, Hilden, Germany) as described pre- viously [22]. On-column DNase digestion was carried out with the RNase-Free DNase Set (Qiagen GmbH).
RNA concentration was measured by NanoDrop 1000 0
1000 2000 3000
Control GK
*
OGTT AUC (mmol/L*min)
0 100 200 300 400
Control GK
Pancreac insulin (µg/mg protein)
c
b
d
Control GK 0
10 20 30
0 30 60 120
Blood glucose (mmol/L) *
* *
min
* a
Control
GK *
*
min 0
1 2 3 4 5
0 30 60 90 120
Serum insulin (ng/mL)
*
Control GK
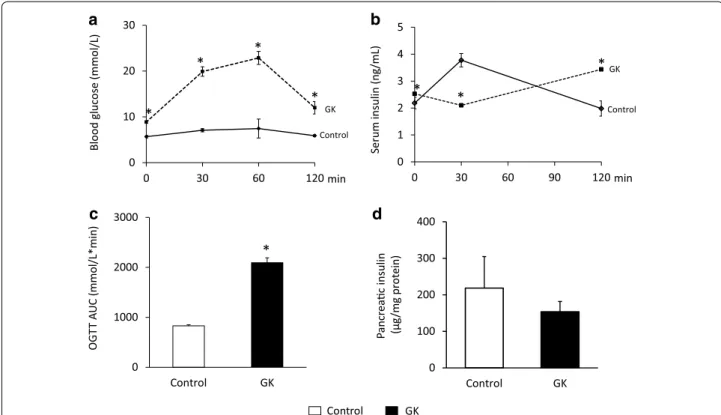
Fig. 2 Blood glucose and insulin levels during OGTT and pancreatic insulin content. Blood glucose (a) and serum insulin (b) levels during OGTT, OGTT AUC (c) and pancreatic insulin (d) content at week 15 in both control and GK rats. Solid line control; dashed line GK. Values are mean ± SEM, n = 7–9, *p < 0.05
0 10 20 30
Control GK
Coronary flow (mL/min) *
0 500 1000 1500
Control GK
Heart weight (mg)
*
0 100 200 300 400
Control GK
Body weight (g)
*
0 1 2 3 4 5
Control GK
HW/BW (mg/g)
*
a
c
b
d
Fig. 3 Body weight, heart weight and coronary flow. Body weight (a), heart weight (b), heart weight to body weight ratio (c) and coronary flow (d) at week 15 in both control and GK rats. Values are mean ± SEM, n = 7–9, *p < 0.05
Spectrophotometer (Thermo Fisher Scientific Inc., Waltham, MA, USA) and RNA integrity was determined by an Agilent 2100 Bioanalyzer System (Agilent Technol- ogies Inc., Santa Clara, CA, USA). Samples with an RNA integrity number (RIN) above 8.0 were used for further analysis. RNA was stored at −80 °C until use.
Total RNA (1000 ng) was labelled and amplified using the QuickAmp Labelling Kit according to the instruc- tions of the manufacturer. Labelled RNA was purified and hybridized to Agilent Whole Rat Genome 4 × 44 K array slides, according to the manufacturer’s protocol.
After washing, array scanning and feature extraction was performed with default scenario by Agilent DNA Micro- array Scanner and Feature Extraction Software 9.5.
Messenger RNA (mRNA) expression profiling by qRT‑PCR In order to validate gene expression changes obtained by DNA microarray, qRT-PCR was performed with gene-specific primers. Total RNA (1 µg) was reverse transcribed using High-Capacity cDNA Reverse Tran- scription Kit (Thermo Fisher Scientific, Waltham, MA US). Quantitative RT-PCR was performed using TaqMan Array 96 Well Fast Plate 3 × 32 (Thermo Fisher Scien- tific, Waltham, MA US) according to the manufacturer’s instructions on a 7900HT Fast Real-Time PCR System.
Each well of the TaqMan Array Plate contained 5 μL of Taqman Fast Universal Master Mix (2X) no AmpErase® UNG, 1 μL cDNA (50 ng/μL) and 4 μL distilled water in a final reaction volume of 10 μL per well. Then qPCR was performed with the following protocol: 50 cycles of 95 °C for 15 s and 60 °C for 1 min. The fluorescence intensity was detected after each amplification step. Melting tem- perature analysis was done after each reaction to check the quality of the products. Primers were designed using the online TaqMan® Assays custom plating service of the manufacturer. Relative expression ratios were calculated as normalized ratios to rat glyceraldehyde-3-phosphate dehydrogenase (GAPDH), hypoxanthine phosphoribosyl- transferase (HPRT) and ribosomal protein S18 (RPS18) housekeeping genes. A non-template control sample was used for each primer to check primer-dimer formation.
Normalized signal levels for each mRNA were calculated using comparative cycle threshold method (delta–delta Ct method). Fold change refers to 2−ΔΔCt (in the case of up-regulated genes) and −(1/2−ΔΔCt) (in the case of down-regulated genes).
Gene ontology (GO) analysis
By using DNA microarrays for transcriptional profiling a large number of genes can be analyzed simultaneously [21, 42], however, the resulting data do not give direct information about possible biological interaction of the differentially expressed genes. GO analysis is a suitable
method for integration genes with pathways and biologi- cal interaction networks to detect coordinated changes in functionally related genes [21, 42]. GO analysis was per- formed using GO pathway analysis using the open access software DAVID bioinformatics system and database (Database for Annotation, Visualization and Integrated Discovery, http://www.david.abcc.ncifcrf.gov website) [21, 42]. The differentially expressed genes were submit- ted to DAVID bioinformatics system and database to reveal significantly enriched biological functions/path- ways [21, 42].
Protein–protein interaction analysis
Gene expression networks are of great biological inter- est since co-expressed genes could be (1) controlled by the same transcriptional regulatory program, (2) func- tionally related, or (3) members of the same pathway or protein complex [43]. In order to further characterize the connections of significantly altered genes obtained by DNA microarray, protein–protein network analysis was performed by STRING10 based on two types of evi- dence: experimental (protein–protein interaction data- bases) and text-mining (abstracts of scientific literature).
STRING (http://www.string-db.org/), is an online acces- sible database of known and predicted protein–protein interactions. Protein–protein interactions from STRING 10 were collected for the construction of differential pro- tein interaction network among the genes whose expres- sions were significantly different in hearts of GK rats. The differently expressed genes were mapped to the String database and then known and predicted associations were scored and integrated. Combined-score > 0.4 was the threshold. Differently expressed genes were visual- ized after KMEANS clustering. Finally, interaction net- work was constructed by integrating these relationships.
Statistical analysis
Statistical analysis was performed by using Sigmaplot 12.0 for Windows (Systat Software Inc). All values are presented as mean ± SEM. Repeated measures Two-Way ANOVA was used to determine the effect of T2DM and the age on FBG, serum insulin and cholesterol levels as well as glucose levels during OGTT. After ANOVA, all pairwise multiple comparison procedures with Holm- Šídák post hoc tests were used as multiple range tests.
Two sample t test was used to determine the effect of T2DM on OGTT AUC, pancreatic insulin concentration, body weight, heart weight, heart weight/body weight ratio and coronary flow. P < 0.05 was accepted as a sta- tistically significant difference. In the microarray experi- ments, biological and technical replica tests were carried out to gain raw data for statistical analysis. Altogether 4 individual parallel gene activity comparisons were done
between the two groups. Both in the microarray and qRT- PCR experiments, a two-sample t test was used and the p value was determined to find significant gene expression changes. In the microarray experiments, a corrected p value was determined for each gene to control the false discovery rate using the Benjamini and Hochberg mul- tiple testing correction protocol. Gene expression ratios with p value of <0.05 and log2 ratio of < −1.00 or log2 ratio of >1.00 (~2.0-fold were considered as repression or overexpression respectively in gene activity.
Results
Metabolic characterization of non‑obese T2DM
In order to verify the development of T2DM in male GK rats, concentrations of several serum metabolites were measured at weeks 7, 11 and 15 (Fig. 1). GK rats showed a significantly elevated FBG level at all time points as compared to controls (Fig. 1a). Interestingly, blood glu- cose level in GK rats were significantly lower at week 11 as compared to week 7 or week 15 blood glucose val- ues (Fig. 1a). Parallel with hyperglycemia, serum insulin levels were significantly increased in GK rats compared to Wistar controls at week 7 and more profoundly at week 11 showing the presence of hyperinsulinemia in GK animals (Fig. 1b). However, there was no signifi- cant difference between serum insulin levels measured in GK and control rats at week 15, since serum insu- lin concentration in GK rats significantly decreased by week 15 as compared to insulin level measured at week 11 indicating beta-cell damage in GK rats (Fig. 1b).
HOMA-IR was significantly increased at weeks 7 and 11 in GK rats when compared to controls showing insulin resistance in GK animals (Fig. 1d). In contrast, increase of HOMA-IR did not reach the level of statistical sig- nificance at week 15 in GK animals (Fig. 1d). Serum cholesterol levels were significantly higher in GK rats as compared to control ones throughout the study dura- tion representing hypercholesterolemia (Fig. 1c). OGTT was performed at week 15 in order to verify the devel- opment of impaired glucose tolerance in GK rats. Glu- cose levels during OGTT were markedly increased in GK rats in every time point of blood glucose measure- ments (Fig. 2a). Area under the curve (AUC) of blood glucose levels during OGTT was significantly increased in GK rats representing impaired glucose tolerance (Fig. 2c). In addition, serum insulin level in GK rats during OGTT was significantly lower 30 min after glu- cose loading and became markedly increased 120 min after glucose administration indicating impaired insu- lin secretion (Fig. 2b). Interestingly, pancreatic insulin levels were 25 % lower in GK rats compared to control ones, however, the values were not significantly differ- ent between the two groups (Fig. 2d).
Body weight, heart weight and coronary flow
Body weight was significantly decreased at week 15 in GK rats proving a non-obese phenotype of T2DM in GK rats (Fig. 3a). Heart weight and heart weight to body weight ratio were significantly increased at week 15 in GK rats suggesting the development of cardiac hypertrophy in response to chronic T2DM (Fig. 3b, c). Interestingly, cor- onary flow was significantly increased at week 15 in GK rats as compared to control hearts (Fig. 3d).
Gene expression profile and qRT‑PCR
Among the 41,012 genes surveyed (Additional file 1:
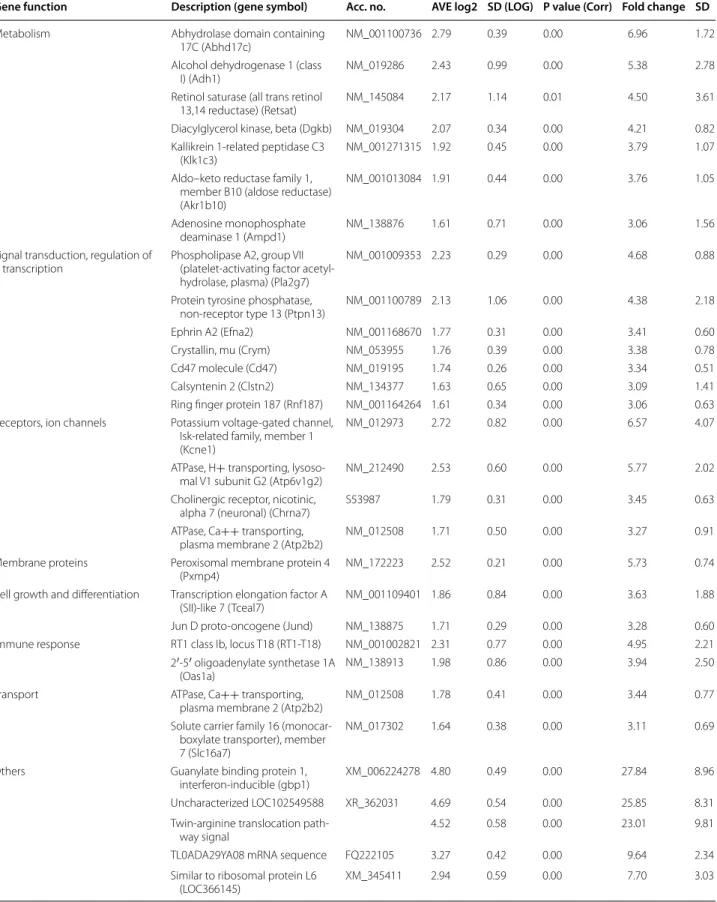
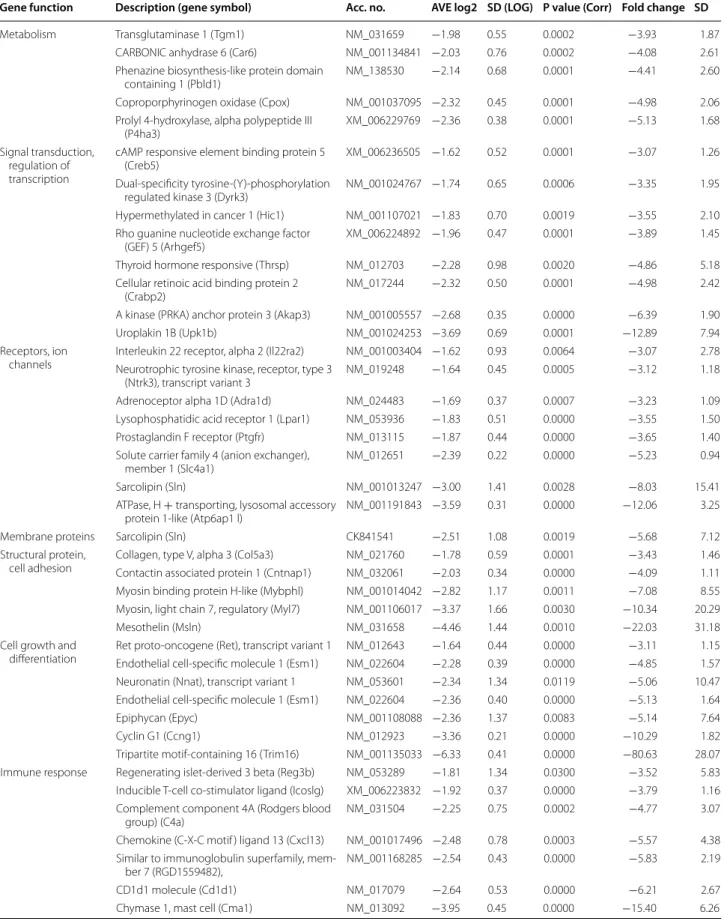
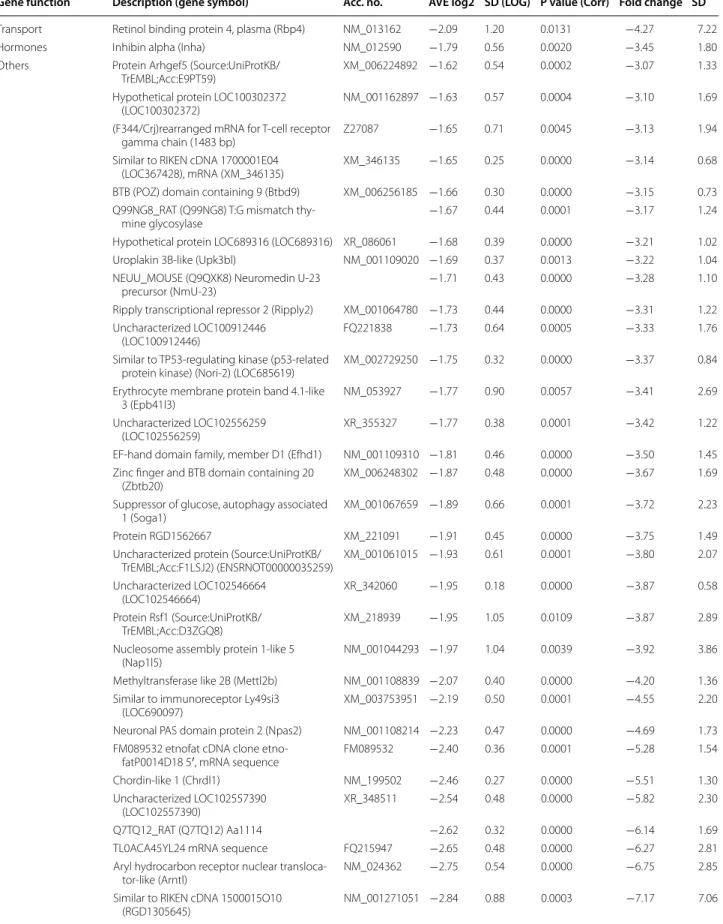
Table S1), 507 genes whose expression was > ~2.0-fold up- or down-regulated in hearts of GK rats relative to levels of control rats showed significant change in expres- sion. According to our results, 204 genes showed up- regulation (Additional file 2: Table S2) and 303 genes showed down-regulation in hearts of GK rats (Additional file 2: Table S3). Moreover, 138 genes showed more than threefold change of expression in hearts of GK rats as compared to the levels of control rats. Among these 138 genes, 50 genes were significantly up-regulated (Table 1) and 88 genes were significantly down-regulated (Table 2) in GK rat hearts. The expression change of selected 28 genes was validated by qRT-PCR (Table 3), 19 of these 28 genes have been confirmed by qRT-PCR (Table 3).
Gene ontology analysis
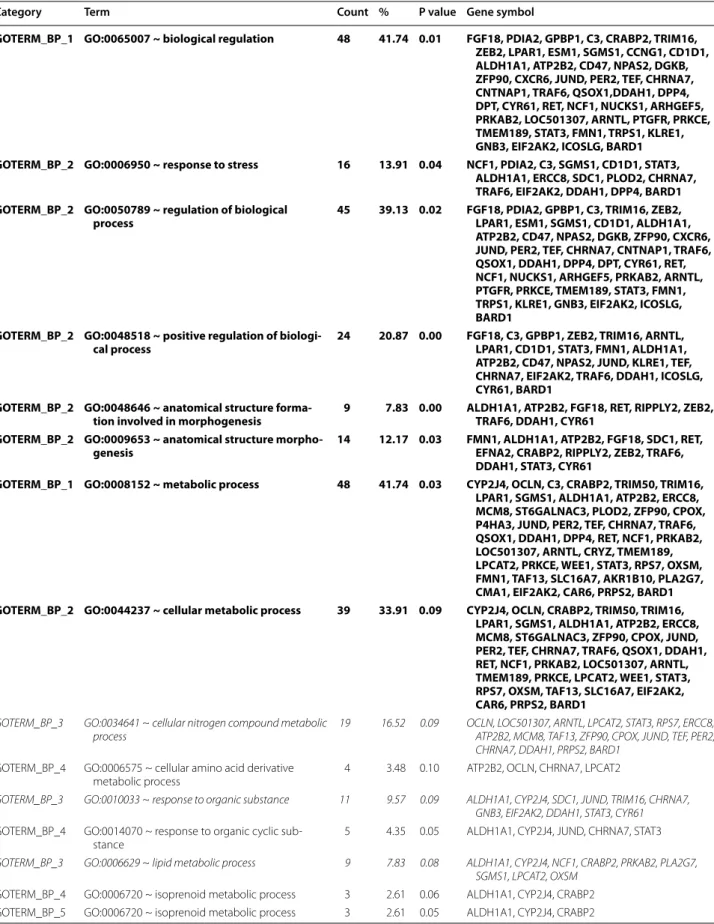
In order to further determine the biological significance and functional classification of differentially expressed genes due to non-obese T2DM, GO analysis was per- formed (Table 4) [21]. GO analysis is suitable for identi- fying significantly enriched GO terms related to multiple genes and for discovering enriched functionally related gene groups. A single gene can belong to different cat- egories. Out of the 507 genes significantly altered by non- obese T2DM in our present study, 277 genes with known function were submitted to GO analysis and 115 were clustered into different categories. The rest of the 507 genes were either unknown expressed sequence tags or unrecognized by the GO analysis database (Table 4). The 115 analyzed genes were classified into five main catego- ries such as (1) biological regulation, (2) metabolic pro- cess, (3) immune system process, (4) biological adhesion, and (5) rhythmic process (Table 4).
Protein–protein interaction analysis
To better understand the relationships between the functionally related gene groups analyzed by GO, we examined protein–protein interactions between protein products of all 507 genes showing significant difference in gene expression (Fig. 4). Here, Stat3 seems to have a major networking group affecting multiple top GO
Table 1 Up-regulated genes (>3.0-fold up-regulation)
Gene function Description (gene symbol) Acc. no. AVE log2 SD (LOG) P value (Corr) Fold change SD
Metabolism Abhydrolase domain containing
17C (Abhd17c) NM_001100736 2.79 0.39 0.00 6.96 1.72
Alcohol dehydrogenase 1 (class
I) (Adh1) NM_019286 2.43 0.99 0.00 5.38 2.78
Retinol saturase (all trans retinol
13,14 reductase) (Retsat) NM_145084 2.17 1.14 0.01 4.50 3.61
Diacylglycerol kinase, beta (Dgkb) NM_019304 2.07 0.34 0.00 4.21 0.82 Kallikrein 1-related peptidase C3
(Klk1c3) NM_001271315 1.92 0.45 0.00 3.79 1.07
Aldo–keto reductase family 1, member B10 (aldose reductase) (Akr1b10)
NM_001013084 1.91 0.44 0.00 3.76 1.05
Adenosine monophosphate
deaminase 1 (Ampd1) NM_138876 1.61 0.71 0.00 3.06 1.56
Signal transduction, regulation of
transcription Phospholipase A2, group VII (platelet-activating factor acetyl- hydrolase, plasma) (Pla2g7)
NM_001009353 2.23 0.29 0.00 4.68 0.88
Protein tyrosine phosphatase,
non-receptor type 13 (Ptpn13) NM_001100789 2.13 1.06 0.00 4.38 2.18
Ephrin A2 (Efna2) NM_001168670 1.77 0.31 0.00 3.41 0.60
Crystallin, mu (Crym) NM_053955 1.76 0.39 0.00 3.38 0.78
Cd47 molecule (Cd47) NM_019195 1.74 0.26 0.00 3.34 0.51
Calsyntenin 2 (Clstn2) NM_134377 1.63 0.65 0.00 3.09 1.41
Ring finger protein 187 (Rnf187) NM_001164264 1.61 0.34 0.00 3.06 0.63 Receptors, ion channels Potassium voltage-gated channel,
Isk-related family, member 1 (Kcne1)
NM_012973 2.72 0.82 0.00 6.57 4.07
ATPase, H+ transporting, lysoso-
mal V1 subunit G2 (Atp6v1g2) NM_212490 2.53 0.60 0.00 5.77 2.02
Cholinergic receptor, nicotinic,
alpha 7 (neuronal) (Chrna7) S53987 1.79 0.31 0.00 3.45 0.63
ATPase, Ca++ transporting,
plasma membrane 2 (Atp2b2) NM_012508 1.71 0.50 0.00 3.27 0.91
Membrane proteins Peroxisomal membrane protein 4
(Pxmp4) NM_172223 2.52 0.21 0.00 5.73 0.74
Cell growth and differentiation Transcription elongation factor A
(SII)-like 7 (Tceal7) NM_001109401 1.86 0.84 0.00 3.63 1.88
Jun D proto-oncogene (Jund) NM_138875 1.71 0.29 0.00 3.28 0.60
Immune response RT1 class Ib, locus T18 (RT1-T18) NM_001002821 2.31 0.77 0.00 4.95 2.21
2′-5′ oligoadenylate synthetase 1A
(Oas1a) NM_138913 1.98 0.86 0.00 3.94 2.50
Transport ATPase, Ca++ transporting,
plasma membrane 2 (Atp2b2) NM_012508 1.78 0.41 0.00 3.44 0.77
Solute carrier family 16 (monocar- boxylate transporter), member 7 (Slc16a7)
NM_017302 1.64 0.38 0.00 3.11 0.69
Others Guanylate binding protein 1,
interferon-inducible (gbp1) XM_006224278 4.80 0.49 0.00 27.84 8.96
Uncharacterized LOC102549588 XR_362031 4.69 0.54 0.00 25.85 8.31
Twin-arginine translocation path-
way signal 4.52 0.58 0.00 23.01 9.81
TL0ADA29YA08 mRNA sequence FQ222105 3.27 0.42 0.00 9.64 2.34
Similar to ribosomal protein L6
(LOC366145) XM_345411 2.94 0.59 0.00 7.70 3.03
pathways in non-obese T2DM. Moreover, there are pro- teins interconnected with each other in smaller network- ing groups including networks of (1) Sdc1; (2) Cyp2e1 and (3) Tef proteins (Fig. 4) affecting the top GO path- ways as well (Table 4).
Discussion
In the present study, our aim was to investigate how car- diac gene expression pattern is influenced by non-obese T2DM. Here we show several characteristics of non- obese T2DM in 15 weeks old male GK rats including decreased body weight, fasting hyperglycemia, hyper- cholesterolemia, insulin resistance, and impaired glucose
tolerance. Moreover, we show increased heart weight and heart weight/body weight ratio in GK rats indicating car- diac hypertrophy. We also demonstrate that non-obese T2DM influences cardiac gene expression pattern by altering transcript levels of several genes. We identified 507 genes which were differentially expressed in the myo- cardium of GK rats compared to Wistar controls.
The spontaneously diabetic GK rat is a well character- ized and recognized model of non-obese type 2 diabetes mellitus. The abnormal glucose regulation in the GK rat develops in association both with impaired insulin secre- tion and with insulin resistance as reviewed by Östenson and Movassat [29, 32]. At the onset of T2DM, there is a Table 1 continued
Gene function Description (gene symbol) Acc. no. AVE log2 SD (LOG) P value (Corr) Fold change SD Mitochondrial ribosomal protein
S10 (Mrps10) NM_001008859 2.86 1.24 0.00 7.28 4.07
Cd300 molecule-like family mem-
ber G (Cd300lg) XM_003750936 2.61 0.68 0.00 6.10 2.99
MRNA decapping enzyme 2.32 0.35 0.00 4.99 1.11
Transmembrane emp24 domain-
containing protein 5 precursor 2.14 0.28 0.00 4.41 0.72
Macrophage activation 2 like
(Mpa2 l) XM_006221662 2.10 1.05 0.00 4.30 3.00
Similar to interferon-inducible
GTPase (RGD1309362) NM_001024884 2.02 0.84 0.00 4.06 2.65
Myc-like oncogene, s-myc protein
(Mycs) NM_021837 2.00 0.80 0.00 4.00 1.64
Uncharacterized LOC102556738 XR_340771 1.96 0.44 0.00 3.89 1.10
Nuclear casein kinase and cyclin- dependent kinase substrate 1 (Nucks1)
XM_006249797 1.96 0.34 0.00 3.89 0.74
Transducin-like enhancer of split 6 (E(sp1) homolog, Drosophila) (Tle6)
XM_006241027 1.95 0.43 0.00 3.87 1.10
Transmembrane protein 132C
(Tmem132c) XM_002724836 1.91 0.45 0.00 3.75 1.09
CWC25 spliceosome-associated protein homolog (S. cerevisiae) (Cwc25)
NM_001108295 1.82 0.76 0.00 3.52 1.65
Contactin associated protein-like 2
(Cntnap2) XM_006236412 1.79 0.39 0.00 3.47 0.84
Anaphase promoting complex
subunit 10 (Anapc10) XM_006255406 1.77 1.29 0.03 3.41 4.41
Deoxycytidine triphosphate
deaminase 1.73 0.35 0.00 3.32 0.74
Hypothetical protein LOC500028 NM_001047954 1.65 0.38 0.00 3.13 0.66
RNA binding motif protein 44
(Rbm44) XM_001066845 1.64 0.46 0.00 3.12 0.87
Trichorhinophalangeal syndrome
I (Trps1) XM_006241626 1.62 0.39 0.00 3.08 0.69
Excision repair cross-complement- ing rodent repair deficiency, complementation group 8 (Ercc8)
NM_001107650 1.60 0.27 0.00 3.03 0.49
Uncharacterized LOC100912569 XR_348427 1.59 0.82 0.01 3.02 1.80
Table 2 Down-regulated genes (>3.0-fold down-regulation)
Gene function Description (gene symbol) Acc. no. AVE log2 SD (LOG) P value (Corr) Fold change SD
Metabolism Transglutaminase 1 (Tgm1) NM_031659 −1.98 0.55 0.0002 −3.93 1.87
CARBONIC anhydrase 6 (Car6) NM_001134841 −2.03 0.76 0.0002 −4.08 2.61
Phenazine biosynthesis-like protein domain
containing 1 (Pbld1) NM_138530 −2.14 0.68 0.0001 −4.41 2.60
Coproporphyrinogen oxidase (Cpox) NM_001037095 −2.32 0.45 0.0001 −4.98 2.06
Prolyl 4-hydroxylase, alpha polypeptide III
(P4ha3) XM_006229769 −2.36 0.38 0.0001 −5.13 1.68
Signal transduction, regulation of transcription
cAMP responsive element binding protein 5
(Creb5) XM_006236505 −1.62 0.52 0.0001 −3.07 1.26
Dual-specificity tyrosine-(Y)-phosphorylation
regulated kinase 3 (Dyrk3) NM_001024767 −1.74 0.65 0.0006 −3.35 1.95
Hypermethylated in cancer 1 (Hic1) NM_001107021 −1.83 0.70 0.0019 −3.55 2.10 Rho guanine nucleotide exchange factor
(GEF) 5 (Arhgef5) XM_006224892 −1.96 0.47 0.0001 −3.89 1.45
Thyroid hormone responsive (Thrsp) NM_012703 −2.28 0.98 0.0020 −4.86 5.18
Cellular retinoic acid binding protein 2
(Crabp2) NM_017244 −2.32 0.50 0.0001 −4.98 2.42
A kinase (PRKA) anchor protein 3 (Akap3) NM_001005557 −2.68 0.35 0.0000 −6.39 1.90
Uroplakin 1B (Upk1b) NM_001024253 −3.69 0.69 0.0001 −12.89 7.94
Receptors, ion
channels Interleukin 22 receptor, alpha 2 (Il22ra2) NM_001003404 −1.62 0.93 0.0064 −3.07 2.78 Neurotrophic tyrosine kinase, receptor, type 3
(Ntrk3), transcript variant 3 NM_019248 −1.64 0.45 0.0005 −3.12 1.18
Adrenoceptor alpha 1D (Adra1d) NM_024483 −1.69 0.37 0.0007 −3.23 1.09
Lysophosphatidic acid receptor 1 (Lpar1) NM_053936 −1.83 0.51 0.0000 −3.55 1.50
Prostaglandin F receptor (Ptgfr) NM_013115 −1.87 0.44 0.0000 −3.65 1.40
Solute carrier family 4 (anion exchanger),
member 1 (Slc4a1) NM_012651 −2.39 0.22 0.0000 −5.23 0.94
Sarcolipin (Sln) NM_001013247 −3.00 1.41 0.0028 −8.03 15.41
ATPase, H + transporting, lysosomal accessory
protein 1-like (Atp6ap1 l) NM_001191843 −3.59 0.31 0.0000 −12.06 3.25
Membrane proteins Sarcolipin (Sln) CK841541 −2.51 1.08 0.0019 −5.68 7.12
Structural protein,
cell adhesion Collagen, type V, alpha 3 (Col5a3) NM_021760 −1.78 0.59 0.0001 −3.43 1.46
Contactin associated protein 1 (Cntnap1) NM_032061 −2.03 0.34 0.0000 −4.09 1.11 Myosin binding protein H-like (Mybphl) NM_001014042 −2.82 1.17 0.0011 −7.08 8.55 Myosin, light chain 7, regulatory (Myl7) NM_001106017 −3.37 1.66 0.0030 −10.34 20.29
Mesothelin (Msln) NM_031658 −4.46 1.44 0.0010 −22.03 31.18
Cell growth and
differentiation Ret proto-oncogene (Ret), transcript variant 1 NM_012643 −1.64 0.44 0.0000 −3.11 1.15 Endothelial cell-specific molecule 1 (Esm1) NM_022604 −2.28 0.39 0.0000 −4.85 1.57 Neuronatin (Nnat), transcript variant 1 NM_053601 −2.34 1.34 0.0119 −5.06 10.47 Endothelial cell-specific molecule 1 (Esm1) NM_022604 −2.36 0.40 0.0000 −5.13 1.64
Epiphycan (Epyc) NM_001108088 −2.36 1.37 0.0083 −5.14 7.64
Cyclin G1 (Ccng1) NM_012923 −3.36 0.21 0.0000 −10.29 1.82
Tripartite motif-containing 16 (Trim16) NM_001135033 −6.33 0.41 0.0000 −80.63 28.07 Immune response Regenerating islet-derived 3 beta (Reg3b) NM_053289 −1.81 1.34 0.0300 −3.52 5.83 Inducible T-cell co-stimulator ligand (Icoslg) XM_006223832 −1.92 0.37 0.0000 −3.79 1.16 Complement component 4A (Rodgers blood
group) (C4a) NM_031504 −2.25 0.75 0.0002 −4.77 3.07
Chemokine (C-X-C motif ) ligand 13 (Cxcl13) NM_001017496 −2.48 0.78 0.0003 −5.57 4.38 Similar to immunoglobulin superfamily, mem-
ber 7 (RGD1559482), NM_001168285 −2.54 0.43 0.0000 −5.83 2.19
CD1d1 molecule (Cd1d1) NM_017079 −2.64 0.53 0.0000 −6.21 2.67
Chymase 1, mast cell (Cma1) NM_013092 −3.95 0.45 0.0000 −15.40 6.26
Table 2 continued
Gene function Description (gene symbol) Acc. no. AVE log2 SD (LOG) P value (Corr) Fold change SD
Transport Retinol binding protein 4, plasma (Rbp4) NM_013162 −2.09 1.20 0.0131 −4.27 7.22
Hormones Inhibin alpha (Inha) NM_012590 −1.79 0.56 0.0020 −3.45 1.80
Others Protein Arhgef5 (Source:UniProtKB/
TrEMBL;Acc:E9PT59) XM_006224892 −1.62 0.54 0.0002 −3.07 1.33
Hypothetical protein LOC100302372
(LOC100302372) NM_001162897 −1.63 0.57 0.0004 −3.10 1.69
(F344/Crj)rearranged mRNA for T-cell receptor
gamma chain (1483 bp) Z27087 −1.65 0.71 0.0045 −3.13 1.94
Similar to RIKEN cDNA 1700001E04
(LOC367428), mRNA (XM_346135) XM_346135 −1.65 0.25 0.0000 −3.14 0.68
BTB (POZ) domain containing 9 (Btbd9) XM_006256185 −1.66 0.30 0.0000 −3.15 0.73 Q99NG8_RAT (Q99NG8) T:G mismatch thy-
mine glycosylase −1.67 0.44 0.0001 −3.17 1.24
Hypothetical protein LOC689316 (LOC689316) XR_086061 −1.68 0.39 0.0000 −3.21 1.02
Uroplakin 3B-like (Upk3bl) NM_001109020 −1.69 0.37 0.0013 −3.22 1.04
NEUU_MOUSE (Q9QXK8) Neuromedin U-23
precursor (NmU-23) −1.71 0.43 0.0000 −3.28 1.10
Ripply transcriptional repressor 2 (Ripply2) XM_001064780 −1.73 0.44 0.0000 −3.31 1.22 Uncharacterized LOC100912446
(LOC100912446) FQ221838 −1.73 0.64 0.0005 −3.33 1.76
Similar to TP53-regulating kinase (p53-related
protein kinase) (Nori-2) (LOC685619) XM_002729250 −1.75 0.32 0.0000 −3.37 0.84 Erythrocyte membrane protein band 4.1-like
3 (Epb41l3) NM_053927 −1.77 0.90 0.0057 −3.41 2.69
Uncharacterized LOC102556259
(LOC102556259) XR_355327 −1.77 0.38 0.0001 −3.42 1.22
EF-hand domain family, member D1 (Efhd1) NM_001109310 −1.81 0.46 0.0000 −3.50 1.45 Zinc finger and BTB domain containing 20
(Zbtb20) XM_006248302 −1.87 0.48 0.0000 −3.67 1.69
Suppressor of glucose, autophagy associated
1 (Soga1) XM_001067659 −1.89 0.66 0.0001 −3.72 2.23
Protein RGD1562667 XM_221091 −1.91 0.45 0.0000 −3.75 1.49
Uncharacterized protein (Source:UniProtKB/
TrEMBL;Acc:F1LSJ2) (ENSRNOT00000035259) XM_001061015 −1.93 0.61 0.0001 −3.80 2.07 Uncharacterized LOC102546664
(LOC102546664) XR_342060 −1.95 0.18 0.0000 −3.87 0.58
Protein Rsf1 (Source:UniProtKB/
TrEMBL;Acc:D3ZGQ8) XM_218939 −1.95 1.05 0.0109 −3.87 2.89
Nucleosome assembly protein 1-like 5
(Nap1l5) NM_001044293 −1.97 1.04 0.0039 −3.92 3.86
Methyltransferase like 2B (Mettl2b) NM_001108839 −2.07 0.40 0.0000 −4.20 1.36 Similar to immunoreceptor Ly49si3
(LOC690097) XM_003753951 −2.19 0.50 0.0001 −4.55 2.20
Neuronal PAS domain protein 2 (Npas2) NM_001108214 −2.23 0.47 0.0000 −4.69 1.73 FM089532 etnofat cDNA clone etno-
fatP0014D18 5′, mRNA sequence FM089532 −2.40 0.36 0.0001 −5.28 1.54
Chordin-like 1 (Chrdl1) NM_199502 −2.46 0.27 0.0000 −5.51 1.30
Uncharacterized LOC102557390
(LOC102557390) XR_348511 −2.54 0.48 0.0000 −5.82 2.30
Q7TQ12_RAT (Q7TQ12) Aa1114 −2.62 0.32 0.0000 −6.14 1.69
TL0ACA45YL24 mRNA sequence FQ215947 −2.65 0.48 0.0000 −6.27 2.81
Aryl hydrocarbon receptor nuclear transloca-
tor-like (Arntl) NM_024362 −2.75 0.54 0.0000 −6.75 2.85
Similar to RIKEN cDNA 1500015O10
(RGD1305645) NM_001271051 −2.84 0.88 0.0003 −7.17 7.06
compensatory attempt of the beta cells to release more insulin to defeat insulin resistance. Later this mecha- nism is insufficient to maintain blood glucose level within a physiological range and finally leads to the functional exhaustion of the surviving beta cells. These stages in the GK model could be also observed in our present study.
Blood glucose levels were significantly increased in GK rats at weeks 7, 11 and 15 as compared to controls and there was a statistically significant difference in blood glu- cose levels in GK rats between the different time points.
Blood glucose level in GK rats were significantly lower at week 11 as compared to week 7 or week 15 blood glucose values. Moreover, serum insulin level was significantly increased at week 11 in GK rats as compared to week 7 values. The significantly higher serum insulin level at week 11 could explain the lower blood glucose level at week 11 as compared to week 7 blood glucose values.
Serum insulin levels and HOMA-IR were significantly increased at week 7 and 11 showing increasing insulin resistance and compensatory hyperinsulinemia. At week 15, there was no significant difference in serum insulin level between GK and control animals. However, pan- creatic insulin content of GK rats was slightly decreased suggesting the functional exhaustion of pancreatic beta cells. Probably this is the reason why HOMA-IR failed to reach the level of statistical significance in GK rats compared to controls at this time point. Nevertheless, this is not a sign of spontaneous improvement of insulin resistance in GK rats in our present study. These results
are in accordance with literature data showing that beta cell mass and insulin production continuously decreases from birth to adulthood in GK rats due to chronic islet inflammation, angiopathy, fibrosis and defective beta cell neogenesis [32].
Surprisingly, only a few studies were performed previ- ously using the qPCR technique to investigate the gene expression changes playing a role in the development of left ventricular hypertrophy and structural remodeling [20, 35, 44], excitation–contraction coupling [45, 46], and lipotoxicity [10] in the hearts of GK rats. Thus, our study is the first to describe overall alterations in the cardiac transcriptome in male GK rats. In our present study, the significantly altered genes can be classified into different clusters (e.g. metabolism, stress response, signal transduc- tion, regulation of transcription, receptors, ion channels, membrane and structural proteins, cell growth and differ- entiation, immune response, transport, hormones, etc.).
Moreover, some other genes without any definite function in the myocardium were also changed in response to DM.
The majority of these genes have not been related to non- obese T2DM yet, and therefore, characterization of the functional effects of these genes on the heart in non-obese T2DM is suggested in future mechanistic studies.
Genes related to metabolic alterations in T2DM
In our present study, several genes related to metabo- lism were found to be affected in the hearts of GK rats as compared to controls. A group of these altered genes Table 2 continued
Gene function Description (gene symbol) Acc. no. AVE log2 SD (LOG) P value (Corr) Fold change SD Uncharacterized LOC100911508
(LOC100911508) XR_145872 −2.86 0.30 0.0000 −7.25 1.86
TL0ACA40YB18 mRNA sequence. FQ216879 −2.99 1.21 0.0012 −7.94 9.21
Family with sequence similarity 216, member
B (Fam216b) XM_003751515 −3.04 0.89 0.0002 −8.25 6.41
SARCO_MOUSE (Q9CQD6) Sarcolipin, com-
plete (TC628765) AW918768 −3.06 1.35 0.0020 −8.33 14.57
Endogenous retrovirus mRNA AY212271 −3.51 1.47 0.0015 −11.38 17.10
Uncharacterized LOC102552170
(LOC102552170) XM_006224493 −4.01 0.40 0.0000 −16.09 5.74
O89816_9GAMR (O89816) Envelope glyco-
protein −4.04 0.99 0.0001 −16.49 15.56
Rat PRRHIS8 mRNA for ribosomal protein S8.
(X56846) X56846 −4.14 0.73 0.0000 −17.63 12.05
Elongator protein 3/MiaB/NifB −4.21 0.37 0.0000 −18.51 5.56
Endogenous retrovirus mRNA AY212271 −4.21 1.48 0.0006 −18.52 28.67
Similar to 60S ribosomal protein L19
(LOC316856) XM_229366 −4.46 0.84 0.0000 −22.05 16.63
Uncharacterized LOC102554872
(LOC102554872) XR_348916 −4.86 0.35 0.0000 −29.02 8.07
WDNM1 homolog (LOC360228) NM_001003706 −5.14 1.80 0.0013 −35.24 76.86
is involved in cellular ketone metabolic process accord- ing to GO and STRING protein–protein interaction analyses (e.g. down-regulation of cytochrome P450 2E1, (Cyp2e1); cytochrome P450 2J4, (Cyp2j4); and up- regulation of aldehyde dehydrogenase 1 family, mem- ber A1, (Aldh1a1); alcohol dehydrogenase 1, (Adh1c);
aldo–keto reductase family 1, member B10, (Akr1b10);
aldo–keto reductase family 1, member, C12, (Akr1c12);
etc.) (Fig. 4; Table 4). It has been shown that 60 day old GK rats developed increased ketone body production [47], however, there is no literature data available about ketone body metabolism in the heart of GK rats. The ketone body acetone can be converted in vivo to glucose via acetol and pyruvate, and the initial conversion to ace- tol is catalyzed by Cyp2e1 [48]. It has been shown that
Cyp2e1 knockout mice subjected to starvation to induce ketogenesis develop blood acetone levels much higher than those observed in wild-type mice [48]. In our pre- sent study, the down-regulation of Cyp2e1 might be a possible cause of increased ketone body level in the myo- cardium, however, up-regulation of other genes involved in ketone metabolic process including Aldh1a1; Adh1c;
Akr1b10; and Akr1c12 may be an adaptive response in the myocardium to antagonize elevated ketone body levels. Moreover, Akr1b10 has been shown to be induc- ible by hyperglycemia in peripheral blood mononuclear cells obtained from patients with diabetic nephropathy. It also could have potential downstream effect of reducing cellular retinoic acid level, which is a key molecule dur- ing organogenesis as well as the development of diabetic Table 3 Confirmation by qRT-PCR
Gene symbol Gene name Acc. nr. DNA microarray qRT‑PCR Confirmed
AVE (log2) Fold change Fold change SEM Adipoq Adiponectin, C1Q and collagen domain containing Rn00595250_m1 −4.99 −31.78 −23.64 0.02 Yes
Retn Resistin Rn00595224_m1 −4.74 −26.72 31.08 14.46 No
Atp1b4 ATPase, (Na+)/K+ transporting, beta 4 polypeptide Rn00584523_m1 −4.21 −18.51 −4.74 0.05 Yes
Car3 Carbonic anhydrase 3 Rn01461970_m1 −3.73 −13.27 −7.88 0.03 Yes
Cma1 Chymase 1, mast cell Rn00565319_m1 −3.11 −8.63 −5.12 0.02 Yes
Arntl Aryl hydrocarbon receptor nuclear translocator-like Rn00577590_m1 −2.75 −6.74 −2.95 0.03 Yes
Tgm1 Transglutaminase 1, K polypeptide Rn00581408_m1 −1.97 −3.92 −4.88 0.03 Yes
Nnat Neuronatin (Nnat), transcript variant 1 Rn00440480_m1 −1.87 −3.66 −4.2 0.02 Yes Ddah1 Dimethylarginine dimethylaminohydrolase 1 Rn00574200_m1 −1.69 −3.23 −3.36 0.02 Yes Ntrk3 Neurotrophic tyrosine kinase, receptor, type 3 Rn00570389_m1 −1.69 −3.23 −2.33 0.06 Yes Stat3 Signal transducer and activator of transcription 3 Rn00562562_m1 −1.49 −2.81 1.36 0.08 No
Dpp4 Dipeptidylpeptidase 4 Rn00562910_m1 −1.35 −2.55 −2.11 0.03 Yes
Ephx2 Epoxide hydrolase 2, cytoplasmic Rn00576023_m1 −1.33 −2.51 −4.23 0.02 Yes
Gpc3 Glypican 3 Rn00516722_m1 −1.29 −2.45 −2.54 0.04 Yes
Fgf18 Fibroblast growth factor 18 Rn00433286_m1 −1.17 −2.25 −2.36 0.03 Yes
Tfpi Tissue factor pathway inhibitor (lipoprotein-associ-
ated coagulation inhibitor) Rn00567935_m1 −1.10 −2.14 1.12 0.06 No
Gckr Glucokinase (hexokinase 4) regulator Rn00565467_m1 −0.98 −1.97 −2.09 0.05 N/A
Cdkn1a Cyclin-dependent kinase inhibitor 1A Rn00589996_m1 −0.93 −1.91 −1.34 0.04 N/A
Bat5 HLA-B associated transcript 5 Rn01525709_g1 0.96 1.95 −1.3 0.06 N/A
Sele Selectin E Rn00594072_m1 1.02 2.03 2.35 0.14 Yes
Dbp D site of albumin promoter (albumin D-box) bind-
ing protein Rn00497539_m1 1.06 2.08 2.39 0.17 Yes
Abcg1 ATP-binding cassette, subfamily G (WHITE), mem-
ber 1 Rn00585262_m1 1.08 2.11 1.99 0.14 No
Cyr61 Cysteine-rich, angiogenic inducer, 61 Rn00580055_m1 1.14 2.20 1.58 0.12 No
Ephx1 Epoxide hydrolase 1, microsomal Rn00563349_m1 1.21 2.31 2.24 0.18 Yes
Prkce Protein kinase C, epsilon Rn01769089_m1 1.28 2.43 1.09 0.08 No
Nurp1 Nuclear protein, transcriptional regulator, 1 Rn00586046_m1 1.34 2.53 3.29 0.28 Yes Slc16a7 Solute carrier family 16, member 7 (monocarbox-
ylic acid transporter 2) Rn00568872_m1 1.77 3.41 3.21 0.19 Yes
Atp2b2 ATPase, C++ transporting, plasma membrane 2 Rn01425460_m1 1.88 3.68 3.78 0.21 Yes
![etc.) (Fig. 4; Table 4). It has been shown that 60 day old GK rats developed increased ketone body production [47], however, there is no literature data available about ketone body metabolism in the heart of GK rats](https://thumb-eu.123doks.com/thumbv2/9dokorg/1383736.114315/12.892.82.819.154.774/table-developed-increased-ketone-production-literature-available-metabolism.webp)
![andcancers.Insulinresistanceisthemostcommonmetabolicdysregulationassociated ].SeveralfactorshavecontributedtotheincreasedprevalenceofobesityinIndonesia,includingincreaseinpercapitaincome,sedentarylifestyle,anddietary ].TheprevalenceofobesityinIndonesianwo](data:image/gif;base64,R0lGODlhAQABAIAAAP///wAAACH5BAEAAAAALAAAAAABAAEAAAICRAEAOw==)