Fish in World Nutrition
CHAPTER 7
GEORG BORGSTROM
Department of Food Science, Michigan State University, East Lansing, Michigan
I. Background Information 268 A. Historical Data 268 B. Present Catch 269 C. Yields 276 D. Subsistence Fishing 276
E. Utilization 278 F. International Trade 280
G. Nutritional Role 283 H. Consumption 285 I. Price 286 II. Aquatic Production and World Feeding 287
A. General 287 B. Per Capita Consumption and Calories 289
C. Fish and Shellfish as a Protein Source 291 D. Fish and Shellfish as a Fat Source 300 E. Fish as a Source of Vitamins and Minerals 302
III. Appraisal Methods 306 A. "Fish Population" 306 B. "Fish Acreage" 307 C. Fish and Animal Products 315
IV. Fish in Improved Nutrition 321 A. Alternative Vehicles 321
B. Fish Flour 321 C. Fish Macaroni 324 D. Fish Biscuits 325 E. Dried (Dehydrated) Fish 325
F. Fish Sausages 325 G. Better Utilization 326 H. Global Requirements 327 I. Upgrading of Fish Meal 331
V. Potentialities 332 A. Fish and Shellfish Potential 332
B. Cultivation 343 C. Seaweed and Plankton as Food 346
D. Hazards 348 References 352
267
268 GEORG BORGSTROM
I. Background Information
A. HISTORICAL DATA
A substantial part of the arable lands of the world has been brought under cultivation through man's quest for food to feed an ever increasing population. Forests have been leveled, swamps drained and deserts irri- gated. Even soilless agriculture is being tried—though on a very limited scale. Concurrently, the fishing frontiers have been pushed farther out to sea from the immediate coastlines of all continents. Many species of fish are pursued over thousands of miles of ocean—throughout their range of distribution. In expanding these boundaries for fishery activities, species new to the fish markets have been found in abundance and have been utilized. Efforts are now being made to exploit the deeper waters of the oceans and thus to push outside of the continental shelves.
In the dawn of history the sea provided, primarily through molluscan shellfish, a readily available food source. Shells at ancient dwelling sites constitute indestructible evidence to late generations of this historical priority of aquatic foods. In the ancient world, fish gained in importance when the Mediterranean population pressure forced cereals on the scene as the bulk of food to take the place of the all-dominant meat from earlier epochs. Fish became the despised food of the poor in the form of mack- erel, anchovy and tuna (as salted products) and as sand smelt (eaten fresh). The fish delicacies of the luscious Greek and Roman banquets belonged to a number of less common but highly praised fish, such as scarus, sturgeon, eel, sheatfish and pike. The Romans favored muraenas and mullets (see further Chapter 1 of this volume, and Cutting, 1955).
For several centuries, fishing and farming advanced at more or less comparable rates. In medieval times, the world saw the rise of the great herring and other fisheries in the Atlantic, off Western Europe, and a rapid increase in agricultural production in Central Europe. During the colonial period in North America, fishing and farming developed simul- taneously and almost at the same rate. But in more recent times, espe- cially since the middle of the nineteenth century, agriculture in North America has far outdistanced the fishing industry. In general, this has also been true throughout the rest of the world. As long as more land could be brought into production, less and less consideration was given to the sea as a source of food. Recently, however, this trend is being reversed. Most of the world's good soils are in use. Much topsoil has been allowed to blow and float away, or to be depleted through poor, or even too intensive, cultivation. Greater attention now has to be given, there- fore, to exploring fishery resources and tapping their vast stores of animal protein food. If the present trend is maintained, the oceans will be
7. FISH IN WORLD NUTRITION 269 combed for food fish as they were for whales in the first half of the nine- teenth century.
The distribution of human population on earth was historically de- termined by climate, potential agricultural land, and channels of trans- portation, such as harbors, rivers, straits and overland roadways. Popu- lation became concentrated where these conditions were most favorable.
Some of the major concentrations of fish are quite remote from dense human populations, e.g., the fringes of the Polar regions around Green- land and Alaska, the west coast of South America, Africa and many others. More than 90% of the world's catch originates in the Northern Hemisphere, yet the southern oceans constitute the greater part of the whole ocean and are known to encompass rich fishery resources. The high perishability of most seafoods further complicates problems of ex- ploiting these distant resources, requiring special techniques for capture, preservation and transporting. This involves the operation of long-range expensive fishing expeditions, now undertaken by several nations, pri- marily the Soviet Union, Japan and the United States; in the latter case, for tuna, both to the Southeast Pacific and quite recently to the tropical Atlantic also.
The distant cod riches of Newfoundland were exploited early in human history, presumably as early as the fifteenth century by the Por- tuguese, and subsequently pursued also by the French, Spaniards and British. Today, most major West European countries, together with the Soviet Union, Poland, and East Germany, take part in the fishing off Newfoundland, Labrador, Iceland, and Greenland. Redfish (ocean perch), haddock and herring have been added to the list of catches in these areas.
Through the years a number of studies have been conducted to estab- lish the importance of fishing to world nutrition (Taylor, 1932; Borg- strom, 1951; Galtsoff, 1952; Finn, 1954, 1960; Chapman, 1947; Vercelli, 1952; Jul, 1952; Weiss, 1953; Sandberg, 1945; Predel, 1957) or to elu- cidate some particular aspect of this multi-faceted field. Furthermore several books and reviews survey this vital area (Coker, 1947; Ommaney, 1949; Taylor, 1951; Popovici and Angelescu, 1954; Morgan, 1956; Die- trich and Kalle, 1957; Blanke, 1958; Walford, 1958).
B. PRESENT CATCH
1. Marine and in General
World War II caused a serious disturbance in world fisheries. The recovery was rapid, however, in Europe, Japan, and the U.S.S.R. In most countries bordering a marine area, chief emphasis was put on fishing as a means of rapidly acquiring badly needed high quality protein. A
270 GEORG BORGSTROM
number of new fishing nations emerged and are already quite important in the world catch (see Volume I, Chapter 2 by Riedel). The Food and Agriculture Organization estimates the sea harvest in 1959 to be in excess of 35 million metric tons (see Table I). In addition approximately 4.3
TABLE I
MAJOR CATEGORIES OF AQUATIC FOODS, 1959a
Fish Aquatic foods
Herring, sardine, anchovy, etc.
Cod, hake, haddock, etc.
Fresh-water fish
Mullet, jack, sea bass, etc.
Tuna, bonito, mackerel, etc.
Flatfish (flounder, sole, halibut, etc.) Salmon, trout, smelt, etc.
Nonidentified marine fish Shellfish
Mollusks Crustaceans Miscellaneous
Algae
Other products
Million metric tons
8.98 4.52 4.30 3.61 1.92 0.86 0.62 6.76 2.19 0.79 0.48 0.07 35.33
α Source: Food and Agriculture Organization Fisheries Yearbook, 1960.
million metric tons came from freshwater. Not all landed fish is for direct human consumption. Approximately one-fifth of the catch goes into the manufacture of oil and meal which reach the human consumer only in
directly in the form of oleomargarine or converted into animal food products. Furthermore one-tenth of the aquatic catch is comprised by shellfish. This leaves an amount of 28 million metric tons of food fish, 24 million tons of which refer to the seas and the remainder to freshwater areas (lakes, rivers, and ponds).
Year 1850 1900 1920 1938 1948 1950
WORLD AQUATIC HARVEST
Million metric tons
1.5-2.0 4 9.5 2 0 . 5 ( 1 8 ) 19.5 23
Year 1952 1954 1956 1958 1959 1960
Million metric tons
24 26.5 29.9 32.1 35.3 37.8
7. FISH IN WORLD NUTRITION 271 No other food commodity has shown an increase comparable to that of fish. Since the beginning of this century the total fish and shellfish catch has soared from a few million tons up to the present figure (see tabulation for data based on estimates of various workers, League of Nations, and FAO statistics). According to statistics of the Food and Agriculture Organization, 1935-1960, fish has the lead in the expansion of production volume among all foods, exceeded only by citrus fruits and sugar. No other animal products can contend for this top position held by fish (see Table II).
TABLE II AQUATIC CATCH
Total«
Nonfood Food Fish Shellfish"
Plants Marine Fresh-water
1938 20.5 2.6 17.9 18.3 1.7 0.5 18.6 1.9
1948 19.1 2.5 16.6 17.0 1.9 0.2 17.3 1.8
1951 27.0 5.0 18.6 19.3 2.2 0.3 24.1 2.9
1953 27.1 5.8 21.3 23.0 3.4 0.7 24.1 3.0
1954 27.0 4.6 22.4 19.2 2.7 0.5 24.2 2.8
1955 28.4 4.6 23.8 20.6 2.7 0.5 25.4 3.0
1956 29.9 5.1 24.8 21.5 2.8 0.5 26.8 3.1
1957 30.8 5.0 25.8 22.3 2.9 0.6 27.3 3.5
1958 32.1 5.2 26.7 23.6 2.8 0.5 28.3 3.8
1959 35.3 7.0 28.3 24.7 3.0 0.6 31.0 4.3
1960 39.0 8.8 30.8 25.0 3.1 0.6 34.5 4.5
α Million metric tons live weight.
b Approximately 70% shell weight.
Owing to the improvement in fishing technique and, to a large extent, the renewal of the fishing fleet, the productional potential of world fishery must be considered good.
Nevertheless, the total annual value of the world's fish products is less than 1.5 billion dollars. This is less than the total value of poultry and eggs being produced in the United States. In addition, meal, oil, and other industrial products account for another 200 million dollars.
2. Fresh-Water
In many countries, fresh-water fisheries supply a substantial part of the nation's protein food. Almost half of the world's fresh-water catch, approximately 1.8 million metric tons, refers to China, where raising of fish has been traditionally predominant. Fish is taken from an area no less than 16.5 million hectares, of which 70 lakes (6,000-500,000 hec
tares) constitute 6.28 million hectares. Although reduced relatively in importance, the fresh-water catch still maintains its absolute size and is even expanding, chiefly by resorting to full-scale utilization of more distant lakes and rivers and the simultaneous build-up of processing and distribution facilities in an obvious effort to move from a local sub-
272 GEORG BORGSTROM
sistence basis to procuring highly coveted animal protein for the millions in cities, for numerous industrial enterprises, and also for the communes.
Thus, the well-known salt lake Koko-Nor on the high plateau of Chinghin is said to be circumscribed by a road along which fishing villages have been erected, together with processing and icing establishments, and equipped with modern fishing craft. Its catches have increased many times and are stated as reaching 45,000 metric tons a year (Denisov, 1961; Sabürenkov, 1961).
The Soviet Union presumably ranks second. Its inland waters ac- count for 1.2 million metric tons, but the Caspian and Black Seas, Lake Aral, and a few others are all salt-water bodies. The expanding irrigation, together with the effects of the rapid industrialization (pollution, ascend- ing figures for water usage, hydroelectric plants), has drastically affected fresh-water fishing. Artificial waters (irrigation canals, reservoirs, dams, etc.) offer some compensations (see Volume I, Chapter 3). Official sup- port to maintain village ponds and special fish-raising areas in cities con- stitute another major endeavor to hold the fresh-water front. Fishing from natural fishing waters is greatly supported by stocking with fingerlings and feed organisms, transplanting, and other production-increasing measures. Proportionately the greatest expansion is taking place in the large Siberian rivers, the mouth of the Ob, however, being the largest source. This vast body of water is already delivering more fish than the entire Arctic Sea waterfront.
The fresh-water fisheries of the African continent are concentrated chiefly in three areas: Lake Victoria, Lake Nyasa and adjacent areas, the Nile basin, and Congo basin. Tanganyika and Uganda together ac- count for 100,000 metric tons. The Victoria waters are rich in fish. The major food catch consists of various Tilapia. Since time immemorial, they have been a great asset to the dense population living around these shores
(Worthington, 1953; Hickling, 1961).
The Great Lakes provide the United States and Canada with about 50,000 tons of fish a year, but in comparison to the immensity of these waters, yields are low. In northern Europe and Asia likewise, fresh- water fisheries are of considerable importance, although everywhere hampered by population growth and industrialization. Both Japan and Western Europe are also suffering from the damaging effects of extending use of chemical sprays, acting as fish poisoning agents in many nations' waters.
Inland fisheries are important as a food resource in Argentina, Brazil, and Venezuela. The Amazon River contains many fresh-water species, among them the "pirarucu." This gigantic fish, which weighs up to
7. FISH IN WORLD NUTRITION 273 200 lb. and is found only in the Amazon, is dried and shipped all over Brazil as a substitute for cod. This river also teems with turtles, whose meat, fat, and eggs are consumed throughout the region. In most of Latin America, however, fresh-water fisheries are operated by fishermen owning no more than a small canoe and a few hooks and lines. Lack of capital blocks the introduction of modern equipment.
3. Ponds and Fish Cultivation
Fish are reared in ponds in many countries. The practice originated in 437 B.C. in China, where it also expanded into the rice paddy fields.
On many Pacific islands, as well as in China, ponds near the sea or con- nected with it contain both fresh-water and salt-water species (see Volume I, Chapter 5 by Drews). The pond area of China is today 2.94 million hectares, of which approximately one-third are marine. Their average productivity is reported as 862 kg./hectare (Saburenkov, 1961).
Pond culture was introduced into central Europe during the four- teenth century, and later into the Balkans. In the European fish ponds, the principal species is the common carp; in Southeast Asia and Japan many other species are reared (see Volume I, Chapter 3 by Mann and Chapter 5 by Drews).
There are more than 2 million fish ponds in United States farms, chiefly in the southern states and largely built in the last 30 years.
They have been built with multipurpose aims in view: as a reliable source of water for stock and irrigation, for conservation, for recreation—
and not least, for fish raising (Compton, 1952). Initially, the farm pond evolved as a method of supplementing the daily food. Each acre of such water can be made to yield 150-450 lb. of pan-size fish each year. When well managed, they can support 400-600 lb. of fish. Fertilizing is required at regular intervals.
Recently attempts to produce river catfish (Ictalurus sp.) commer- cially in United States ponds have been initiated. The only food-fish culture enterprises in the United States are producers of rainbow trout (Salmo irideus)—see further Borgstrom (1961a). This fish is commer- cially produced and frequently in combination with freezing plants in Japan and Denmark. Most of their production enters international trade.
Rice-fish farming, patterned after Southeast Asia and with favorable results, is reported from Texas, Mississippi, Louisiana, and Arkansas, the latter being the major producing area. The principal species is the big- mouth buffalo fish, Megastomatobus cyprinelL·. This fish is preferred to carp by the United States public. Yields of more than 1,000 lb. per acre have been obtained in heavy delta soils; 500 lb. constitutes a good aver-
274 GEORG BORGSTROM
age when heavy stands of stubble have been left over from the preceding rice crop.
In the Far East, pond fish are raised in relatively small bodies of water; boglands, swamps, and ravines are utilized, as well as the waters of irrigation canals and reservoirs (Blanco and Villadolid, 1939). In many areas (China, Japan, Java, and others), fish are raised on flooded rice paddies. Annual yields of one or more tons to the acre are not in- frequent.
Israel started fish farming before World War II and introduced the carp from Yugoslavia into its fish ponds. The average annual production is at present 6,000 metric tons. The availability of dependable water re- sources is hampering further expansion.
Twelve years ago various Tilapia were introduced into the lakes and rivers of Madagascar. Pond cultivation started in the central part of the island and the number of ponds in 1960 was given as no less than 80,000 (Anonymous, 1960a).
4. Marine Cultivation
Only through oyster farming is it possible nowadays to meet the United States' market demands. Due to excellent estuarine habitats, Louisiana produces more oysters than all other Gulf states combined.
Cultivation of other marine organisms in salt-water ponds is subject to trial at various places, both along the Pacific and in the Gulf area. A well-known center for experiments of this nature is Bears Bluff Lab- oratories, Wadmalow Island, South Carolina. The raising of shrimp has been practiced in the Orient for five centuries or more. Ample tidal marshes exist along the South Atlantic and Gulf coasts where such ponds could readily be built. The question is whether such cultivation can suc- cessfully compete with trawling.
A modern, seagoing shrimp trawler costs between $20,000 and
$40,000. Shrimp ponds can be built for $250 to $600 an acre. Such a trawler can catch annually 20,000 to 50,000 lb. of shrimp. In India 350 to 1,000 lb. of shrimp are produced per acre of pond during a five-month season. Calculating these figures and, if the United States marshlands could produce shrimp at the same rate, the equivalent cost of a shrimp boat would yield annually between 12,000 and 160,000 lb. of shrimp.
Efforts are also under way to raise in cultivating ponds a large-size fresh-water shrimp, found in rivers and canals of Florida. A related species is widely eaten in Cuba, where they are called little lobsters.
Some difficulties are encountered in the continuous reproduction in cap- tivity. Species of smaller type, found in great numbers in the Mississippi and the Ohio rivers, are also tried for cultivating purposes.
7. FISH IN WORLD NUTRITION 275 5. Whaling
Although not fish, whales merit attention in a study of this nature.
Being so close to the primary photosynthetic production—with only two conversion chains—they belong to the most efficient converters, in gen- eral, and of the planktonic riches of the Antarctic, in particular. The suck- ling baby blue whale for two years grows approximately 150-200 lb. per day, the standard weight of a man. It is estimated that the mother con- sumes per day 2 metric tons of "krili" (a zooplancter belonging to the euphasids).
International control of the annual catch of whales has only been partially successful. At present the International Whaling Commission no longer functions, as two members have withdrawn. Germany has re- sumed whaling. Japan and the Soviet Union have both expanded their operations appreciably. No less than three newly built modern whaling factories (147.000 gross tons) have been added to the Soviet fleet in the period 1959-61. Norway is at present (1961) in the process of selling its major factory whalers to Japan.
Whaling is almost entirely concentrated in the Southern Hemisphere, since the chief stock outside Greenland is almost depleted. A few whales are caught off the Canadian Pacific Coast. Presumably, there are poten- tial possibilities of larger catches in this region. New whaling districts are centered around Cook Strait in New Zealand and off Durban in South Africa.
A new development is the utilization of whales for the production of fresh meat—chilled, canned, or frozen. Japan, the Soviet Union, Norway, and the United Kingdom are utilizing whale flesh for human consump- tion. Only a fraction of the potential amount of flesh available in whales is used. Estimates of the total of this has varied between 325,000 and 2 million metric tons, due to the possibility of using meat from all whales and the availability of facilities to save, handle, and transport the flesh.
Furthermore, seasonally the meat is so rancid that only extensive oil removal can make it edible for human beings. At any rate, 100,000 metric tons of whale meat is equivalent to the yield of 570,000 full-grown steers.
Whales are hunted especially for their oil. Oil-extraction methods have improved, thus substantially increasing the oil output per animal unit as much as 50-80%. This oil constitutes one-tenth of the world's consumption of animal fats (Kondrup, 1952).
Meal is also manufactured on the factory ships and in on-shore sta- tions (82,000 metric tons in 1955-56). Nevertheless, large quantities of offal are still thrown back into the sea as waste products.
The shortage of horse meat for mink food is making whale meat and meal of other mammalians (sea lions off Alaska) attractive. A revival of
276 GEORG BORGSTROM
East Pacific shore whaling took place in 1957 and is expanding. So is the whaling station near Paitu, Peru, now served by three killer vessels, secured from Europe. Currently the fur breeders of the Pacific North- west, especially the mink ranchers, use more than one million pounds of whale meat imported from Canada or Japan. The whale meat is, however, not as dependable for animal feeding in general as fish meal;
see further Chapter 2, Part I, of this volume.
6. Miscellaneous
The dugong (sea cow or sea pig) has a flesh similar to that of pork and is greatly relished by the coastal population where it abounds. It is an inhabitant in restricted areas in the Indo-Pacific from the Red Sea and east coast of Africa in the west to the Solomon, Marshall, and New Caledonia islands in the east (Jones, 1959).
The manatee (sea lion) feeds on the subterranean pastures of algae and grass. It is a food highly esteemed by many peoples in tropical America, including the Caribbean. To this category of grazing animals belong several turtles, the most famous of which is the green turtle of the Caribbean, which once astounded Columbus by its immense numbers.
As a food source, they paralleled the role of the prairie bison to North America (Carr, 1956). In many tropical areas—India, Indonesia, and Ceylon—turtles still provide supplemental protein, although they have been severely decimated in most regions.
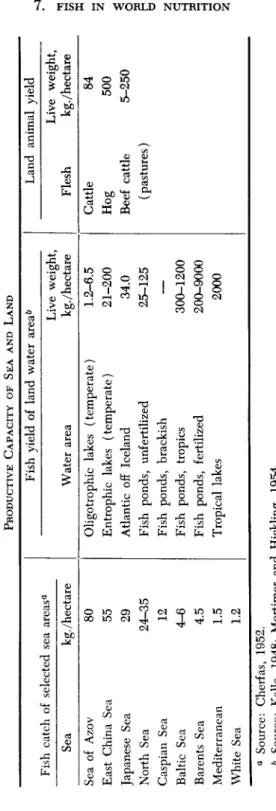
C. YIELDS
It is interesting to note that yields obtainable from catches through recent years give an indication in broad terms of the productive capacity of various waters, as influenced by latitude, climate, availability of nu- trients, etc. Largely they follow the findings of studies on primary pro- duction and benthos accumulation. Certain basic characteristics are obvious. The Baltic and the Mediterranean show low productivity, for different reasons. Temperate latitudes deliver more fish, and Arctic re- gions are sparse. Fresh waters are more readily fertilized than marine areas, and peaks in production are reached in controlled ponds. These latter come into the producing range of farm animals (Table III). There is still a great deal of argument as to the true potential of tropical waters
(see further Steemann-Nielsen, 1960).
D. SUBSISTENCE FISHING
What now has been depicted is the situation as it can be analyzed from available statistics. In many countries, fresh-water fish is not listed in the commercial statistics. Thus, it is known that families inland in the
TABLE III PRODUCTIVE CAPACITY OF SEA AND LAND Fish catch of selected Sea Sea of Azov East China Sea Japanese Sea North Sea Caspian Sea Baltic Sea Barents Sea Mediterranean White Sea
sea areasa kg./hectare 80 55 29 24-35 12 4-6 4.5 1.5 1.2
Fish yield of land water Water area Oligotrophic lakes (temperate) Entrophic lakes (temperate) Atlantic off Iceland Fish ponds, unfertilized Fish ponds, brackish Fish ponds, tropics Fish ponds, fertilized Tropical lakes
area0 Live weight, kg./hectare 1.2-6.5 21-200 34.0 25-125 300-1200 200-9000 2000
Land animal yield Flesh Cattle Hog Beef cattle (pastures)
Live weight, kg./hectare 84 500 5-250 « Source: Cherfas, 1952. & Source: Kalle, 1948; Mortimer and Hickling, 1954.
278 GEORG BORGSTROM
north of Sweden consume from local sources up to 100 kg. of fish per capita. The Lake Titicaca provides food for the adjacent indigenous populations of the Andes. Indirect evidence in dietary surveys show that individual fishing plays a major role in the United States (Borgstrom,
1961a).
According to Wilcox (1947), Thailand is the rice country of a "vast agricultural Venice. . . . It is a combination rice empire and fish pond.
Fish go a long way in supplementing a rice diet." Family subsistence is, in effect, taken from every stream, canal, lake, and swamp. Artificial fish ponds are common throughout the Bangkok region, with well-established rules for emptying the ponds.
In other words, it is most likely that large quantities of fish are caught for self-sustenance, the consumption of which never is registered. Recent surveys from Southeast Asia also confirms this. In these cases, the population depend largely on fish for their daily protein need, as other meat is not available.
Dietary surveys clearly show that in Africa the best-nourished peoples are frequently those living close to lakes and rivers and consuming the fish they themselves catch (Nicol, 1952; Hickling, 1961; Borgstrom, 1962b).
In some cases, the Food and Agriculture Organization has made an effort here to include estimates of such noncommercial catches, e.g., in the Philippines (60%) and Malaya (11.5%). The figures in parentheses indicate the percentage of the national catch attributed to such sub
sistence fishing.
These factors must be borne in mind particularly when analyzing the future prospects for expanded fish consumption. In other words, the 6sh resources of the world have already been tapped for food purposes to a greater extent than available statistics might indicate.
E. UTILIZATION
1. General
About two-thirds of the world's catch is used directly as human food in various forms—fresh, frozen, canned, or otherwise preserved. The remainder is reduced to oil and meal. In both cases these items contribute an additional amount of food to the human household. Whale and menhaden oils are raw products important to the oleomargarine industry of Europe and the Soviet Union.
National preferences and the final destination of the catch—whether for domestic consumption or for export—largely determine the form in which fish is marketed. In the United States, almost equal amounts of
7. FISH IN WORLD NUTRITION 279 fresh and canned fish are sold. Frozen fish is capturing more and more of the market, and about a fourth of the catch is reduced to oil and meal.
In contrast, the United Kingdom, with an annual catch half that of the United States, markets more fresh and frozen fish (850,000 tons as against 730,000 tons for the United States) but uses only small quantities for canning. In no country does the share of canned fish in the total catch even approach that of the United States. A clear distinction should, however, be made between the relative standing of each type of fish product and its absolute volume. This point will be further elucidated in Chapter 19, constituting a comprehensive review of present general trends in fish utilization.
2. Fish Meal
Certain species of nonedible fish and the waste from processing the edible kinds are reduced to meal and oil. Fish meal is increasingly used for feed, as the value of its high-quality concentrated protein has been recognized. The waste of fish species that contain little oil in their bodies, such as cod, haddock, and redfish, is converted into fish solubles, a kind of liquid protein. When fish is reduced to oil, the water remaining after the separation of the oil still contains some portions of fish and various minerals. The solids are screened and added to the meal. The water, known as stickwater, was formerly discarded, through ignorance of its value for feed. Years of research and experimentation have resulted in the development of processes for concentrating stickwater into a product with high vitamin B content—fish solubles (see Chapter 9). This product is greatly valued for inclusion in mixed feed and is considered to be a special factor in animal growth. Peru, the United States, and Norway are the chief producers of fish meal, followed by the United Kingdom, Japan, and Canada.
Meat meals from slaughterhouse waste have generally been found inferior to fish meals. Whale meal is becoming a good substitute for fish meal, but is more deficient in minerals and to some extent in B vitamins.
3. Fish Oils
Fish oils are interchangeable to some extent with vegetable oils.
Fish-liver oils have been employed for medicinal purposes for centuries;
they were prescribed for rickets in the Middle Ages. The discovery of their vitamin content has led to their use in vitamin oils and concentrates.
The world's output of fish oils averaged 350,000 metric tons a year during 1955-1959, 24% above the level of the nineteen-thirties. The United States leads in production, followed by Norway and Japan, in that order. During World War II, the annual output of the United States
280 GEORG BORGSTROM
declined about 25%, and that of Japan and Norway fell catastrophically.
In the United Kingdom, the fishing fleet was requisitioned for military purposes, and production of fish oil ceased altogether. Only Iceland is producing more fish oil than prior to the war.
The Marfleet refinery (United Kingdom) serves the 400 trawlers operating from Hull and Grimsby, equipped for preliminary oil rendering at sea. In this plant, 40% of the world's annual supply of liver oil
(30-35,000 tons) is manufactured, basically from 100 million codfish livers (Anonymous, 1961d).
The fish-liver oil industry is increasingly affected by the competition from synthetic vitamin A produced from ionone, coriander seed oil, etc.
Fisheries used to hold a monopoly in this field. Leading producers, chiefly of cod-liver oils, are the Soviet Union, followed by Norway (second), the United Kingdom (third), Iceland (fourth), and Japan (fifth). This declining trend has led to the development of a canned-liver industry in the Soviet Union and Japan, as well as the use of liver in porks, sausages, etc. Norway benefits from the fact that its fishing industry is carried on close to the coast at low temperatures that make it possible to process millions of fish livers in the shortest possible time.
F. INTERNATIONAL TRADE
1. General
When discussing the position of fish in world nutrition, its part of the international trade must not be overlooked. What is caught in the Northern Hemisphere is only partly consumed there. The bacaläo is especially cherished in the tropics of Latin America and Africa. Salted, dried cod was always considered an important part of their protein diet for several centuries, along with other fish prepared in a similar way.
As a whole, cured fish has long held an established place in the diet of these regions. In Jamaica, e.g., dried salted cod provided the chief source of animal protein for the poorer sections of the population. Cured cpd is also a staple item in the diet of the Brazilian population, on the average 60% of the fish protein intake (Borgstrom, 1958).
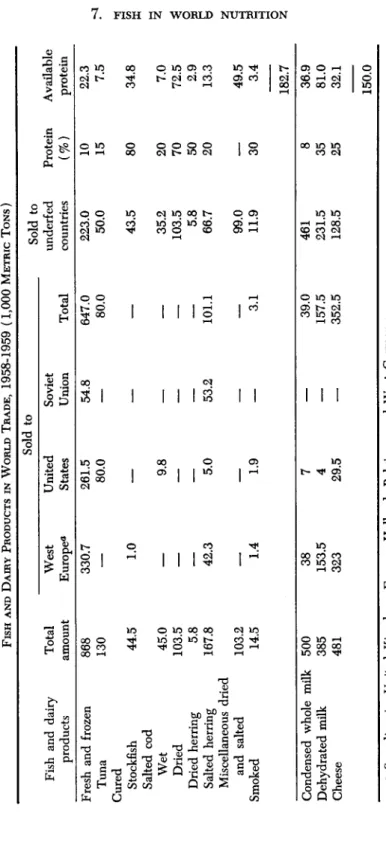
2. Fish and Milk Contending
Even when it comes to the international food trade, fish plays a proportionately greater role among the less-well-fed nations of the world than do other major food commodities. Table IVa lists the approximate amount of fish and milk protein that reaches the underfed countries of the world. As a provider of cheap animal protein, dried fish still holds the key position it has maintained through the centuries. In spite of the
TABLE IVa FISH AND DAIRY PRODUCTS IN WORLD TRADE, 1958-1959 (1,000 METRIC TONS) Fish and dairy products Fresh and frozen Tuna Cured Stockfish Salted cod Wet Dried Dried herring Salted herring Miscellaneous dried and salted Smoked Condensed whole milk Dehydrated milk Cheese
Total amount ~868 130 44.5 45.0 103.5 5.8 167.8 103.2 14.5 ~5ÖÖ 385 481
West Europe0 330.7 — 1.0
— — — 42.3 — 1.4 38 153.5 323
Sold to United States 261.5 80.0 — 9.8
— — 5.0 — 1.9 7 4 29.5
Soviet Union 54.8 — — — — — 53.
2 — — —
Total 647.0 80.0 — — — — 101.
1 — 3.1 3ÖÖ 157.5 352.5
Sold to underfed countries 223.0 50.0 43.5 35.2 103.5 5.8 66.7 99.0 11.9 461 231.5 128.5
Protein (%) 10 15 80 20 70 50 20 — 30 8 35 25
Available protein 22.3 7.5 34.8 7.0 72.5 2.9 13.3 49.5 3.4 182.7 36\9 81.0 32.1 150.0 α Scandinavia, United Kingdom, France, Holland, Belgium, and West Germany.
282 GEORG BORGSTROM
extensive nature of various international programs using dehydrated milk, fish on the average still surpasses milk on the world market with regard to the total amount of protein. In isolated years, when relief de
liveries are expanded, milk may exceed fish. In spite of the world pro
duction of milk being 2.5 times larger than that of fish, these two items are equally important to world feeding in supplementing the low protein diets of critical areas (see also Section IV, C ) .
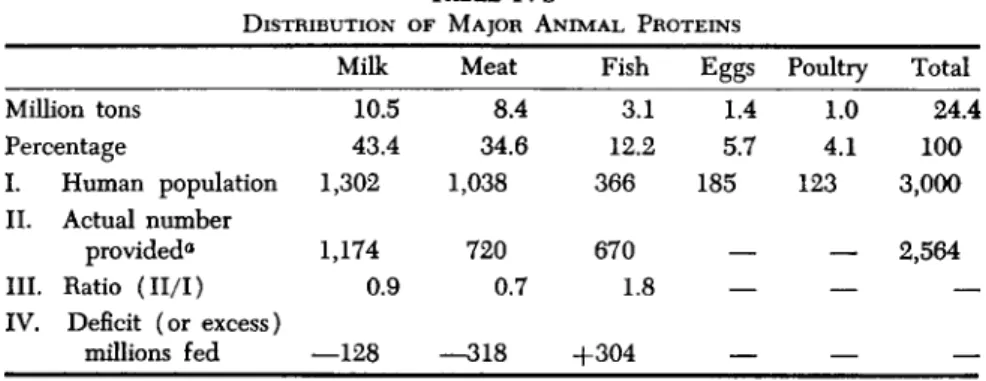
3. Fish Proportionately a Leader
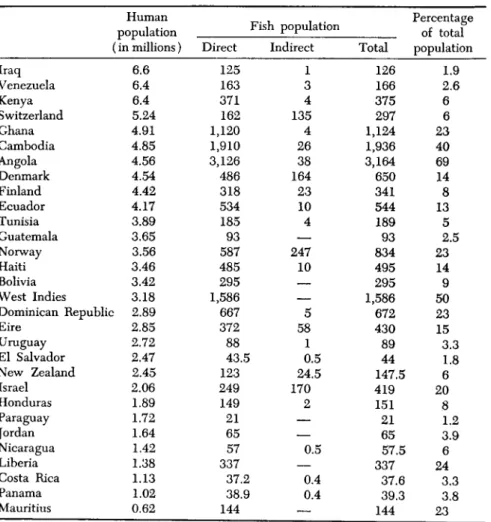
There is another way of gauging on a relative basis this effectiveness of world animal protein in terms of major commodities. Employing the figures indicating the proportionate share of major animal protein in the world's total population, the number of human beings who theoretically could be fed by each protein category can be calculated. In other words, this would be the number of individuals who would be provided with animal protein from each major source if these available protein sources were equally divided. By analyzing, insofar as available statistics allow, the actual consumption in individual countries the actual present dis
position of these proteins can be calculated in an approximate way (see line II in Table IVb; see also Borgstrom, 1962b).
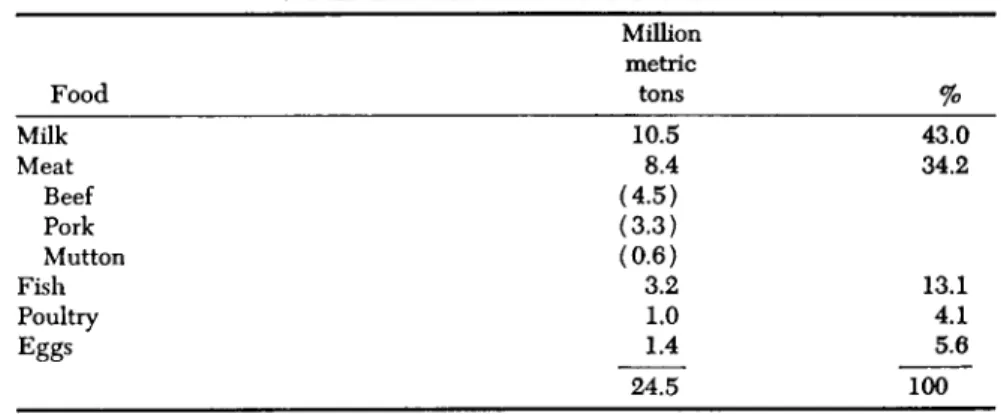
TABLE IVb
DISTRIBUTION OF MAJOR ANIMAL PROTEINS
Milk Meat Fish Eggs Poultry Total Million tons 1 0 5 8A 3Λ L4 LO 2ΛΛ Percentage 43.4 34.6 12.2 5.7 4.1 100 I. Human population 1,302 1,038 366 185 123 3,000 II. Actual number
provided« 1,174 720 670 — — 2,564 III. Ratio (II/I) 0.9 0.7 1.8 — — — IV. Deficit (or excess)
millions fed —128 —318 + 3 0 4 — — —
° Calculated on the basis of each individual country.
The discrepancies between these two sets of figures (lines I and II) clearly reveal that the overwhelming percentage of milk and meat is being consumed by a minority of the world's peoples and largely those that are favored with rich soil and water resources. More important in this context is the outstanding fact that fish constitutes the animal protein source of a much wider proportion of the world's total population. When analyzed in terms of distribution, the sphere of influence of both milk and meat shrinks, while that of fish greatly expands—almost twice what sheer quantity would lead one to anticipate.
7. FISH IN WORLD NUTRITION 283
G. NUTRITIONAL ROLE
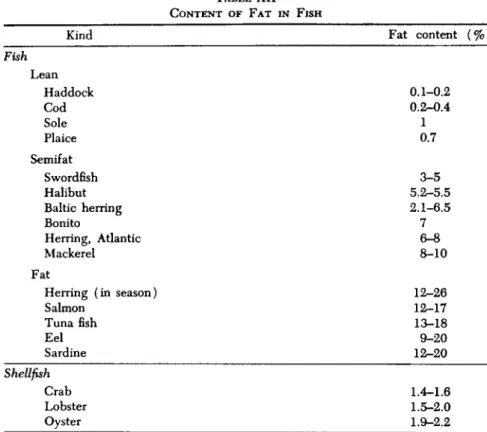
The biological or nutritional quality of the protein contained in various species and types of fish and shellfish compares very favorably with that of muscle meats of beef, veal, pork, lamb, mutton, and poultry (see further Chapter 2, Parts I and II, this volume). The relative content of essential amino acids is almost identical. A special advantage is the high degree of digestibility. In general lysine, methionine, and tryptophan are the three essential amino acids, deficiencies of which are frequently encountered in plant protein. Fish protein provides all these vital constituents.
This is the over-all picture, which clearly points toward the poten
tialities for increased use of fish. When analyzed further, the position of fish products is in reality even more significant than these actual figures reveal.
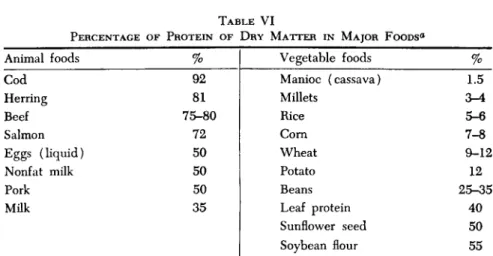
Fish maintains a unique position as a protein source, being the most potent in this respect whether the protein content is calculated on the basis of 100 calories (Table V) or merely in relation to total dry matter (Table VI). Even fatty fishes compare favorably with defatted milk powder, where lactose constitutes a filling bulk. For other factors influencing the protein content, see Chapter 2, Parts I and II. Small- sized fish generally carry less protein in relative weight than do large
TABLE V
GRAMS OF PROTEIN IN 100 CALORIES OF SELECTED FOODS0
Food Manioc (cassava) Banana
Sweet potato
(Ipomoea batata) Rice (white, milled) Taro
Millet (Eleusine sp.) Maize (whole-meal) Millet (Setaria sp.) Sorghum
Wheat flour (medium extract) Millet (Pennisetum sp.) Groundnut (peanut) Bean or pea
Soybean
g./100cal.
0.8 1.0 1.1 1.7 1.7 2.0 2.6 2.9 2.9 3.3 3.4 4.7 6.4 11.3
Food Cow's milk
(3.5% fat) Eggs
Beef (lean) Skim milk Nonfat milk solids Fish, fatty Fish, lean Fish, dried (cod) Fish flour (extract)
g./100 cal.
5.4 7.9 9.6 10.0 11.3 10.2-13.2 15.0-21.0
21.8 22.0-23.0
α Calculated by the author from standard reference books on food composition.
284 GEORG BORGSTROM
TABLE VI
PERCENTAGE OF PROTEIN OF DRY MATTER IN MAJOR FOODS0
Animal foods Cod
Herring Beef Salmon Eggs (liquid) Nonfat milk Pork Milk
%
92 81 75-80
72 50 50 50 35
Vegetable foods Manioc (cassava) Millets
Rice Corn Wheat Potato Beans Leaf protein Sunflower seed Soybean flour
%
1.5 3-4 5-6 7-8 9-12
12 25-35
40 50 55
a Source: Calculated by the author from standard reference books on food composition.
fish. For the calorie-conscious, it is valuable to know that 200 g. of cod fillets carry 140 calories, while beef, with the same amount of protein, has 170-220 calories and pork 500 calories (Kraut, 1957).
Through an average serving of 200 g. of fish fillet (or 300 g. of fish with bone), the percentages (Table VII) of the daily requirements of an adult (150 lb.) are provided. Lean fish differs somewhat from fatty fish. Only nutrients representing more than one-tenth of daily needs are included (Kraut, 1957).
TABLE VII
NUTRIENTS PROVIDED BY AN AVERAGE SERVING OF F I S H0
Nutrient Protein Fat Calories Phosphorus Iron
Fat fish Requirement (%)
75 g.
80 g.
2,600 1.5 g.
12 mg.
50 60 25 45 30
Lean fish
(%)
50
—
5 40 25
Vitamins A Bi B2
Niacin D
Requirement 5000 IE
1.7 mg.
1.8 mg.
12 mg.
400 IE Fat fish
(%)
100 15 30 75 1000
Lean fish
(%)
—
15 20 50
—
a From Kraut, 1957.
Based on the rule that at least one-third of the protein intake should be in animal protein, a fish serving readily fulfills this specification. To what degree this satisfies the amino acid requirement was analyzed in Chapter 2, Part I.
Fermented fish products go back to Roman days and their "garum."
This was presumably very similar to the so-called sauces manufactured
7. FISH IN WORLD NUTRITION 285 throughout Asia, constituting fish which is bacteriologically and enzy- matically broken down under the strict control of table salt. Proteolysis is the leading process, yielding amino acids which are readily available for supplementation. Because of their high lysine content, they are particularly valuable in an extreme vegetarian diet. These fish sauces also add to the amount of sulfur-containing amino acids (Rerat and Jacquot, 1956). The salt as such constitutes another beneficial asset of these very diets (Toury et al.y 1958) (see also this volume, Chapter 2, Part I, and Volume III, Chapter 20 by van Veen).
As pointed out by Deas and Tarr (1947) bread, prepared from flour, in the form of two 1-lb. loaves, furnishes as much tyrosine as is found in 1 lb. of fish flesh; three loaves are equivalent to this amount of fish with respect to tryptophan, and five loaves are needed to convey a comparable amount of threonine. The greatest discrepancy prevails with regard to lysine. It would take eight loaves of bread to supply as much lysine as occurs in 1 lb. of average fish flesh. This EAA is the chief limiting factor.
Pound for pound, fish can be said to be eight times more valuable than bread in supplying this essential dietary factor. Fish flesh, however, lacks almost completely the carbohydrate constituents so characteristic of many foods of plant origin.
H. CONSUMPTION
Despite the growing world population, the per capita consumption of fish is increasing more rapidly. Fish is unique in this respect when compared to other food commodities. This can be confirmed through available statistics. This shows the increasing dependence on fish in the feeding of the human family. It might also signify that the fishing industry is getting better organized. Because of this, the catches are more readily recognized in commercial statistics.
There are, nevertheless, some exceptions to this general rule. Declines in per capita figures are reported from such countries as the United Kingdom, Haiti, and other Caribbean islands. The causes are completely different: in the first case, ample provision with other animal foods and in the second, the extreme shortage of food chiefly due to excessive population growth.
The growing prevalence of fish in human diets does not necessarily mean that fishery is more successful than agriculture in keeping pace with the population growth. It may reflect the fact that the population pressure is inducing more efficient catching, largely by resorting to the exploitation of yet untapped resources. Paradoxically enough, it may also be the consequence of an accelerated urbanization—people moving to the cities, where fish in general is more readily available to more
286 GEORG BORGSTROM
people. Mankind's greater degree of dependency on fish as food con- stitutes a double challenge, on one hand, the need of better protection of fish resources, and on the other, improved methods of preservation.
In many countries (e.g., Korea) there is a marked discrepancy between the commercial catches and the actual consumption of fish. This is chiefly explained by the extensive spoilage of landed fish in peak seasons. This raises the very important question of the utilization of fish, which has a vital influence on the standing of fish in world nutrition.
Trends in this respect will be analyzed in Chapter 19 of this volume.
I. PRICE
In most countries, fish is cheap in comparison with other protein foods.
In 1950, the price to United States farmers for livestock varied from 18 cents per pound for pigs to 23 cents for beef cattle. The total of all fish in the United States was produced and sold by fishermen on the average at about one-third the price paid to farmers for competing meat protein (Taylor, 1953). Basically, this is explained by the absence of any productional costs. The investments and costs are limited to the capture, handling, and processing.
Over the entire globe the major common species of fish offer protein that is cheaper in price than most other animal products. Kraut (1957) established that the protein in marine fishes costs half that of beef and one-third that of pork. Milk protein was comparable in price. Employing a residual method, it was established that the price of fish protein was persistently less than that of other animal protein with the exception of milk, when attaching to the fat the retail price of oleomargarine and to carbohydrates the retail price of ordinary white sugar (Borgstrom and Almgren, 1953). Cod protein was approximately twice as expensive as herring protein, but all investigated fish protein was considerably below the price of eggs, pork, and beef. Meier (1956) also employed the sugar price, but for fat used the price of lard. Even in this case, fish belonged to the low-cost items in comparison with most other animal foods. Excep- tions were evaporated or dried milk and pork sausage. Hamburger was more expensive than fish fillets. A United States study established that expenditure varied inversely with the cost of proteins, fish being the least favored animal food in this respect (Ministry Agr. Fisheries and Food, 1960).
In most countries, herring and sardines are coveted foods. Dried cod is another very cheap item. Besides, the fish protein cost in man-hours are about half those of pork in a well-advanced agriculture—and still pork in most countries is the cheapest of the land-animal proteins when the hogs are not raised on skim milk. When computing the labor
7. FISH IN WORLD NUTRITION 287 involved, fish, even in this respect, stands out as among the least costly of animal protein foods.
II. Aquatic Production and World Feeding
A. GENERAL
Maritime nations long ago realized the importance of fish and seafood to human nutrition. In West Africa, the Far East, and some Pacific islands, population groups subsist almost exclusively on fish and plant products. No obvious nutritional deficiencies have been detected there.
The nutritive attributes of fish have, consequently, long been recognized and well established as empirical knowledge of the human race.
Nowadays this knowledge is firmly endorsed by chemical analyses, clinical findings, and nutritional experimentation. Fish is an important source of protein and in addition it provides essential minerals and vitamins and, in not a few cases, fat at low prices. It is of high value in the diet of human beings and livestock. Furthermore, the fish flesh has a delicate structure and is easily digested.
Considering the entire world population, the average yearly consump- tion of aquatic products at present amounts to 10 kg. per person. In addition, 3 kg. per person are utilized in other ways but usually end up as food via meal, as refined oils in the margarine industry, or as fer- tilizers.
In prewar days, British fish accounted for only about 10% of the animal and 5% of the total protein intake. Nevertheless, the United Kingdom fish catch, in amount of protein, exceeds its importation of meat from Argentina (92,000 as against 55,420 metric tons). The Norwegian herring catch in recent years equals the meat yield from 1.6 million cattle (it used to be 2.25 million) and the cod catch, 500,000 cattle. The cattle stock of Norway is 1.1 million units. The Pacific landings are equivalent to the meat from more than 51 million cattle (Borg- strom, 1962a).
Fish consumption has been analyzed above. Noteworthy here is the fact that most countries show a trend toward a higher per capita intake.
But in better-fed countries the situation has been rather stagnant and in a few, such as the United Kingdom, there is a decline in this respect.
In principle, a better utilization of the catches through preservation and improved handling should induce an enlargement of consumption. For various reasons, discussed in Section IV of this chapter, this has not always been the result. An earlier analysis of this aspect was given by Borgstrom (1951).
288 GEORG BORGSTROM
1. Asia
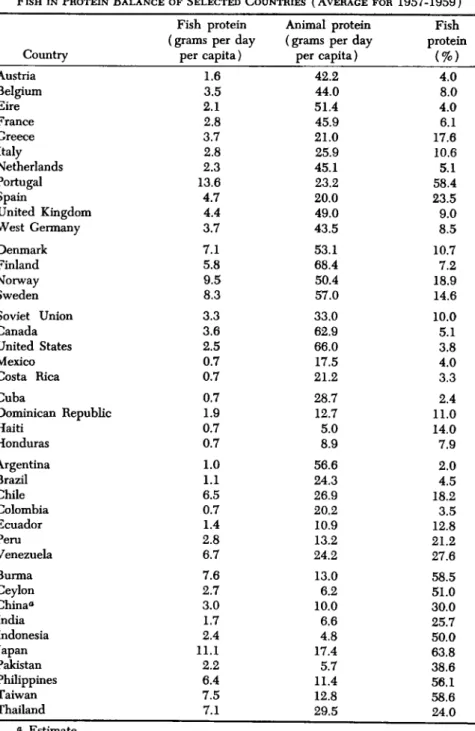
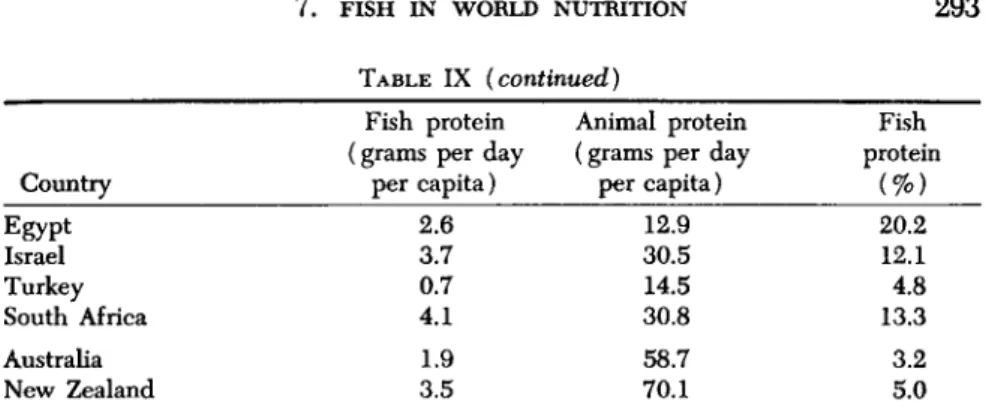
Dietary lack of high quality protein from animals sources constitutes one of the major nutritional problems in several areas of the world, e.g., large parts of the brim of Asia. A large number of people with limited means obtain their caloric requirements chiefly from rice and other similar cereals. Fish thus constitute a readily available source of cheap, supplementary protein.
Fish constitutes the principal protein food of a large majority of the people of the Philippines. Approximately 2,000 species of fish are found in these waters, most of which are edible (Valenzuela, 1928).
The highest number of calories per 100 g. of the fish was obtained from the fish called "mayamaya" (red snapper), which gives 145.5 calories, and the lowest, 72.7 calories, from "dilis" (Stolephorus commer- sonii) or long-jawed anchovy. Being cheap, this fish is available to all, irrespective of purchasing power. Sometimes it is made into a fish paste called "bangoong." The raw fish is commonly salted and dried and is either toasted or fried for food. Plain roasted bangos (milkfish), a common ingredient in daily food in the Philippines, contains protein in excess of 30% (Valenzuela, 1928).
Fish sauces are extremely important dietary supplements in the entire Southeast Asian region (Autret, 1948; see also Chapter 2, Part I, this volume, and Volume III, Chapter 20 by van Veen). Local raising of fish in ponds is another readily available source of fish which is regularly added to the daily diet—see Section I, B, 3.
2. Brazil
The mussel Mytilus munahenis, which is so common in brackish lagoons or lakes at several places along the Brazilian coast, constitutes the only source of cheap animal protein to the poor, economically weak group of the population. It is equal to casein in nutritional value (de Siqueira et al., 1954). It is preserved through drying.
3. Tropical Africa
Most of the dietary protein of Africans in Nigeria is supplied by maize. This is deficient in tryptophan and lysine, without which essential amino acids of the protein ingested cannot wholly be utilized by the body. Many are living on a diet grossly deficient in animal protein, and markedly lacking in non-animal protein. Clinical evidence also points to protein deficiencies as being very common among the general population of Nigeria. Dietary surveys indicate that pregnant women frequently receive only 1 oz. (28 g.) of meat or fish per day or even less (Nicol, 1952). Fish eating tribes are as a rule better nourished, their intake of
7. FISH IN WORLD NUTRITION 289 animal protein being greater than that of adjacent farming or trading groups. This also reflects the better state of general health (Nicol, 1952).
Similar findings are reported from Senegal when comparing fishing and farming villages in the Dakar region (Senecal et ah, 1956).
Similar conditions of protein deficiencies are reported from Ghana (Mayer, 1959). Fish appears to offer the best possibilities to meet this challenge.
The artificial raising of Tilapia mehnopleura has in recent years brought fish to the island of Madagascar where the protein-deficient diet was prevalent. In areas along the rivers and lakes stocked with Tilapia and in the central regions with its numerous cultivation ponds this fish is now consumed in substantial quantities—the intake per day is greater than the average European intake per week (Anonymous, 1960a).
4. The Arctic
For countless generations, Eskimos in the circumpolar area have fished Arctic lakes and coastal areas of northern oceans on a subsistence basis.
Seals, together with fish (pike, arctic char, etc.) were the basis of their food (Abs, 1959). The polar bear, also providing meat and vitamins, in turn feeds on fish.
B. PER CAPITA CONSUMPTION AND CALORIES
Based on the total world catch of approximately 39 million tons (1961) of fish and shellfish, this category of food commodity does not seem to be too important. Divided among the three billion people now living, fish amounts to approximately 11.7 kg. (23.4 lb.) of fish and 1.3 kg.
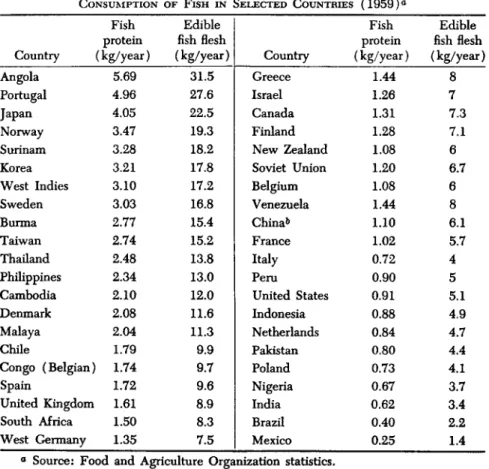
(2.91b.) of shellfish per capita per year. One-fifth (22.5%) of the total catch is utilized as feed and for purposes other than human food. In terms of edible flesh, this means 5.0kg. (11 lb.), 13% of which refers to fresh-water products. But it does not seem adequate to evaluate world supply of fish on such a sweeping basis. The regional differences are too large and the consumption habits vary too much to justify calculations of such a general nature.
The significance of fish to the national diet of each country is most frequently gauged on the basis of the annual per capita intake of edible fish in each country. Heading the list based on statistical data of 1960 (Table VIII) we find Angola and Portugal with 32-28 kg. Japan has overcome the decline of the war years and regained her prewar figures, now attaining 22.5 kg. The two Scandinavian countries, Norway and Sweden, are quite high and have for a number of years surpassed even the per capita figures for Japan. Nevertheless, it is obvious that fish is far more essential to Japan than to the Scandinavian countries. Other