Forest Ecology and Management 500 (2021) 119629
Available online 2 September 2021
0378-1127/© 2021 The Authors. Published by Elsevier B.V. This is an open access article under the CC BY license (http://creativecommons.org/licenses/by/4.0/).
Forest type matters: Global review about the structure of oak dominated old-growth temperate forests
J ´ anos B ¨ ol oni ¨
*, R ´ eka Aszal ´ os , Tam ´ as Frank , P ´ eter Odor ´
Centre for Ecological Research Institute of Ecology and Botany, H-2163 Vacr´ ´at´ot, Alkotm´any u. 2-4., Hungary
A R T I C L E I N F O Keywords:
Oak forests Old-growth forests Forest structure Dead wood Forest dynamics
A B S T R A C T
The structure and composition of temperate old-growth oak forests are reviewed based on 108 case studies about 175 stands. The stands were classified as dry, dry-mesic and mesic forest types and the variables (density, basal area, size distribution, dead wood volume) were compared among them.
Compared to the global range of this forest type, the United States was overrepresented, while West and Central Asia, Europe and Central America were underrepresented. In mesic oak forests the basal area and density of large trees were higher than in dry stands, while tree density and sapling density were lower. The proportion of oaks in tree and sapling layers were the highest in dry and lowest in mesic forests. The size distribution of trees followed negative exponential or rotated sigmoid types. In dry habitats all size categories are dominated by oaks, while in mesic type, only large ones followed the same trend. The volume of dead wood and the proportion of downed dead wood increased along the humidity gradient. In stands with repeated measurements, basal area and relative density of oaks decreased in the last decades.
The understanding of the structure and composition of temperate old-growth oak forests is necessary for their restoration and application of close to nature forestry principles.
1. Introduction
Earth’s forests have been affected by humans in many ways for thousands of years; most have long been exploited and altered. The area of forests has reduced, and this human impact on forest ecosystems is still intensifying. The estimated forest cover on Earth about 8000 years ago was at least 6000 million ha (Bryant et al., 1997; de Gouvenain and Silander, 2016), while currently it is 4006 million ha (FAO, 2020). The forest cover has been decreasing globaly, despite increases in cover in some regions due to afforestation and establishment of plantation forests (e.g. Europe, North America, East Asia, Keenan et al., 2015; FAO, 2020).
Human land-use does not mereley reduce forest area but also changes and influences the structure and composition of forest ecosystems. There has been timber production forestry for centuries that prefers certain tree species, represses others, eliminates shrub layers and removes dead wood (Parviainen, 2005; Garbarino et al., 2015; Kirby and Watkins, 2015). Prolonged, long-lasting human impact often simplifies the forest structure, reducing species richness and biodiversity (Badalamenti et al., 2018).
One-third of the remaining forests can only be considered as old-
growth (OG) forests, where human impact is minimal or negligible (FAO, 2020). However, these forests are highly underrepresented in temperate zone, e.g., their proportion is less than 1% in European forests (Bauhus et al., 2009; Sabatini et al., 2018). This is especially relevant for the remnants of temperate deciduous forests, which are more affected and reduced than any other forest types (de Gouvenain and Silander, 2016; Sabatini et al., 2020). OG forests are free from significant human activity and have been developed primarily by natural processes (Gilg, 2004; Barton, 2018). They maintain high biodiversity because many species are associated with their diverse structure, microhabitats and long continuity (Knorn et al., 2013; McGee, 2018). They provide indirect benefits through ecosystem services, store more carbon than production forests (Luyssaert et al., 2008; Knohl et al., 2009; Wirth et al., 2009;
Keeton et al., 2011, Keeton, 2018), and also contribute to human well- being through their recreational and spiritual effects (Proctor, 2009).
Besides their conservational importance, existing OG forests provide a unique open laboratory for studying natural processes and conditions of the forested landscape.
Although OG forests have been researched locally in the temperate zone for a long time (Jones, 1945), their general, global-scale
* Corresponding author.
E-mail addresses: boloni.janos@ecolres.hu (J. B¨ol¨oni), aszalos.reka@ecolres.hu (R. Aszal´os), frank.tamas@ecolres.hu (T. Frank), odor.peter@ecolres.hu (P. Odor). ´ Contents lists available at ScienceDirect
Forest Ecology and Management
journal homepage: www.elsevier.com/locate/foreco
https://doi.org/10.1016/j.foreco.2021.119629
Received 20 May 2021; Received in revised form 10 August 2021; Accepted 12 August 2021
investigation has begun only recently (Luyssaert et al., 2008; Keith et al., 2009; Burrascano et al., 2013). OG forests are reference stands for comparing the effects of different silvicultural systems and for under- standing natural forest structure, composition and processes. Observa- tion of OG forest dynamics is the basis of natural disturbance-based (Franklin et al., 2002; North and Keeton, 2008; Keeton et al., 2018) or
‘close-to-nature’ (Bauhus et al., 2009, 2013; Schütz et al., 2016) forest management systems. To establish ecologically sustainable forest man- agement systems, it is essential to know the structure, composition and dynamics of the reference OG stands. This knowledge is crucial for the development of the managed, secondary stands towards a more natural state.
In the northern temperate deciduous forest Quercus is one of the most important arboreal genus (Nixon, 2006). It has approx. 400 species (e.g.
Schwarz, 1964; Nixon, 1997; Menitsky, 2005), most of which are found in North America (cc. 240 species), but China is also a significant hot spot of the genus with approx. 100 species (Nixon, 2006; Huang et al., 2013; Denk et al., 2017). Oaks are predominant participants in a wide variety of forest types, including temperate deciduous oak forests and evergreen stands from temperate to tropical zones. About half of the oak species are deciduous trees or shrubs. Oak species play a significant role in biodiversity as many are related to the structural and compositional diversity of oak forests (Dey, 2014; L¨of et al., 2016; Molder et al., 2019). ¨ Oak-dominated forests are common in Eurasia, where they are also valuable for their ecosystem services (Johnson et al., 2019). Half of the forest area in the United States is also dominated by oaks (78.5 million ha), with the largest extent of oak-hickory stands (48.5 million ha) in the eastern region (Smith et al., 2009). Oaks have always been important in human culture; their wood has been used in a wide variety of ways. E.g., in the 19th century the main timber for construction was supplied by oaks both in America and Europe (Gil-Pelegrín et al., 2017; Johnson et al., 2019). OG oak forests are still under significant human impact in many places and their area is currently declining (e.g. Gutierrez et al., 2009; Knorn et al., 2013); thus, it is necessary to study the structure and composition of OG oak forests based on the remaining stands. In spite of the importance of their role and territory, a comprehensive review on the main forest stand characteristics of temperate OG oak forests has never been compiled.
The aim of this review is to give a general description of the structure and composition of existing oak dominated OG forests. We collected standardized data from different published case studies, and compared the structure (density, basal area, regeneration, dead wood, size
distribution) and composition of OG oak forests among main habitat types (dry, dry-mesic and mesic). We hypothesized different growth, production, dynamics and, accordingly, different structural and compositional characteristics among the habitat types. We generalised their dynamics (structural and compositional changes) based on repeated measurements of long-term studies. We evaluated the repre- sentativeness of the existing data, explored gaps in our knowledge and, thus, formulated future research directions. This information is essential for the strategies of conservation and management of these forest types, as reference data on relevant forest stand compositional and structural characteristics, including the dominant trends in them is crucial to implement effective conservation-oriented or close-to-nature manage- ment in oak dominated forests
2. Material and methods 2.1. Selection of case studies
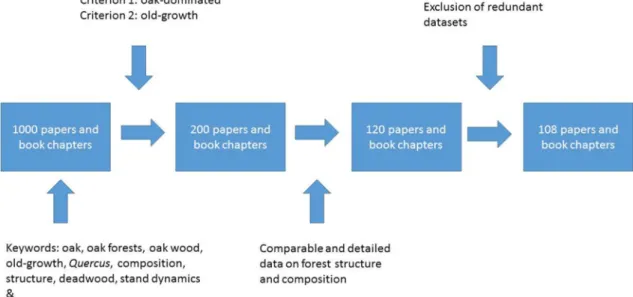
During the literature search, many scientific papers and book chap- ters were scanned for relevant information based on combinations of keywords such as ‘Quercus / oak / oak forest / oak wood, old-growth, composition, structure, dead wood, stand dynamics’ on ISI Web of Sci- ence and Google Scholar (Fig. 1). We also reviewed the reference list of selected papers for additional articles (snowballing technique). First an extensive reference list was made, with approximately 1000 papers and book chapters, which also included literature found with the keywords and also the snowballing technique. For the present review, papers were selected from the original list that contained comparable compositional and structural data for “oak dominated” and “old-growth” forests. For this decision it was necessary to specify (1) which habitat types are included in the study (criterion: oak dominated forests) and (2) which forests can be considered as ‘old-growth’ (old-growthness criterion).
Based on the composition of the canopy layer, temperate deciduous forests where oaks play a significant role were included in the study. We considered a forest as an oak forest if the overall relative basal area of the Quercus species reached 25% and (1) relative basal area of oaks is larger than of any other genus, or (2) the total relative basal area of any other genus does not exceed 30%. We excluded stands where the pro- portion of conifers exceeded that of deciduous tree species. Floodplain forests were also excluded.
Old-growthness has been defined in several ways (Peterken, 1996;
Pesklevits et al., 2011; Spies, 2004; Buchwald, 2005; Wirth et al., 2009).
Fig. 1.The schematic view of the literature search.
For this study we accepted the North American old-growth concept (Parker, 1989; Goebel and Hix, 1996; Tyrrell et al., 1998) defining the following criteria:
1. the presence of large, old (>150 years) tree individuals;
2. mixed age and size structure appearing in fine-scale horizontal pattern;
3. multi-layered canopies, with scattered gaps as a result of natural stand dynamics;
4. presence of large sized standing and downed dead wood in various stages of decomposition;
5. minimal or complete lack of human intervention (e.g. roads, stumps, signs of grazing and cutting) for the past 80–100 years.
Following the ‘oak dominance’ and ‘old-growthness’ criteria, 200 papers and book chapters were studied in detail. We found representa- tive data for composition and structure in 108 papers (App. A, Fig. 1) but occasionally the same data occurred in multiple papers. Repeated measurements from at least two time points was found in 19 stands.
Finally, we used density, basal area, diameter at breast height (DBH) distribution, composition and dead wood data from a total of 175 stands in 117 forests (App. B).
The oak forests were divided based on forest site conditions along moisture gradient into three forest types: dry, dry-mesic and mesic. We hypothetized that the production, dynamics, structural and composi- tional characteristics differ by forest type. The classification was based on (1) total relative basal area or importance value of mesophytic (shade tolerant and other mesic) tree species, (2) classification of plant com- munities or (3) site classification, which is referred to in that paper. We considered species of the genera Acer, Aesculus, Carpinus, Fagus, Frax- inus, Juglans, Liquidambar, Liriodendron, Platanus, Tilia, Tsuga and Ulmus to be mesophytic species. Dry stands were identified on the basis ref- erences to dry ecoregion (“Cross Timbers”, “Glade Region”), open and low canopy or dry soil conditions. Stands were considered mesic, in which total relative basal area or importance value (arithmetic mean of relative density and relative basal area) of mesophytic tree species reached 20 or 25%, respectively. We also considered mesic those stands that are mesic according to the plant community classification in the paper, and those where the site description clearly indicates mesic stands. Stands that could not be clearly classified on the basis of the available data as either dry or mesic were considered as dry-mesic. Thus we were able to classify 119 stands based on data (relative basal area or importance value), for the remaining 56 stands we referred to what was written in the text of the papers. If more than one paper was found for one stand, the data were used to classify the stand into forest type. The classification of 8 stands was considered uncertain, so they were clas- sified as dry-mesic (App. A, B).
2.2. Data analysis
The following variables were used to describe the structure of the stands: density of trees, basal area (BA) of trees, density of large living trees (LLT, DBH >50 cm) and sapling density. Trees were defined as arboreal species larger than 10 cm DBH. The DBH threshold of the canopy layer (trees) differed between investigations. In case studies that used different DBH thresholds, the general structural variables were recalculated for a 10 cm DBH threshold based on the DBH distribution of trees. Arboreal individuals between 2 and 10 cm DBH were considered as saplings. The proportion of oaks within the stands was described by relative density and basal area in the canopy and sapling layers. Dead wood was characterised by total, standing and downed dead wood volume (TDW, SDW, DDW respectively) and relative DDW volume (DDW*100/TDW). DBH distribution of trees based on their relative density in different categories of 5 cm intervals was calculated for each forest type separately. When we found composition data from at least two time points, changes in density, density of oaks, relative density of
oaks, basal area, basal area of oaks and relative basal area of oaks were calculated.
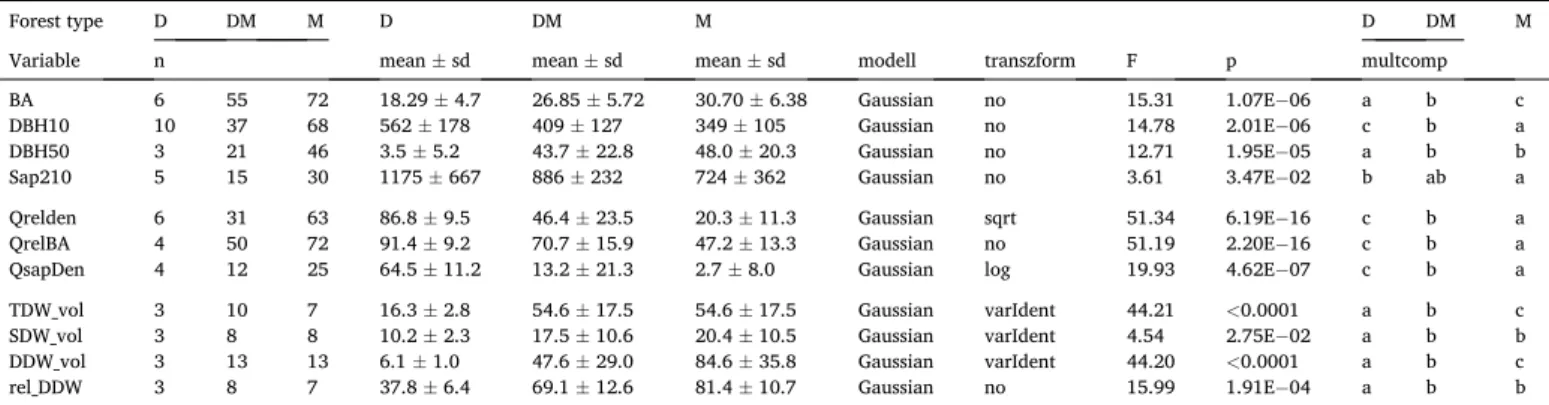
The effect of forest type (as fixed factor with three levels) was ana- lysed on the studied structural variables (as dependent variables) by general linear models, using Gaussian error distribution and F statistics (Faraway, 2005). In some cases, we used square root (relative oak density) and log (relative oak sapling density) transformation to provide the normal distribution of the model residuals. In order to provide the variance homogeneity assumption of the models for total, standing and downed dead wood variables general least squares linear regression (GLS) method were used weighted with unique variance structure of the factor levels (Zuur et al., 2009). The normality and homoscedasticity of residuals were visually checked for all models. In case of significant forest type effect the differences among the levels were tested by Tukey- type multiple comparisons at 0.05 significance level based on the esti- mated marginal means of all comparisons (Lenth, 2020). All analyses were made in an R 3.6.3 statistical environment (R Core Team, 2020), for the GLS linear regression the nlme (Pinheiro et al., 2020); for mul- tiple comparisons the emmeans (Lenth, 2020) packages were used. The number of stands varied by variables and forest type because not all studies reported all variables. Details of the statistical analyses are found in Table 2.
3. Results
3.1. Number and distribution of the selected papers
Most of the selected papers were studies on forests of eastern U.S., containing data on 147 stands in 96 forest sites. Most data were from Illinois, Ohio and Virginia (Table 1). We found representative data in only 10 papers from Europe (22 stands of 17 forest sites), and three additional papers on oak forest stands of Asia (1–1 stand in China and Japan, respectively). We found few data (15 stands based on six papers) about the typically dry forest type, and much more data on dry-mesic Table 1
Number of investigated stands in different regions (continents and countries) and forest types.
Locality Number of stands
Dry Dry-mesic Mesic Total
Asia, China 1 1
Asia, Japan 2 2
Europe, Austria 2 1 3
Europe, Poland 4 4
Europe, Italy 2 2
Europe, Portugal 12 12
Europe, Romania 1 1
Europe, Slovakia 3 3
USA, Alabama 1 1
USA, Arkansas 2 2
USA, Georgia 1 1
USA, Illinois 9 11 20
USA, Indiana 4 8 12
USA, Kentucky 8 2 10
USA, Maryland 2 2 4
USA, Massachusetts 3 3
USA, Michigan 1 1
USA, Minnesota 10 10
USA, Mississippi 2 2
USA, Missouri 5 5 1 11
USA, New Jersey 4 5 9
USA, North Carolina 3 4 7
USA, Ohio 11 10 21
USA, Oklahoma 7 7
USA, Pennsylvania 2 3 5
USA, Tennessee 3 3 6
USA, Virginia 4 3 7
USA, West Virginia 1 5 6
USA, Wisconsin 2 2
Total 14 79 82 175
and mesic forest types.
3.2. Structure: Basal area, density and DBH distribution
The average basal area significantly differed among forest types; it
was the smallest in the dry and the largest in the mesic stands (Fig. 2A, Table 2). Tree density was higher in dry stands than in the other two types (Fig. 2B). Opposite to tree density, the density of large trees was significantly lower in dry stands than dry-mesic and mesic types (Fig. 2C, Table 2). Sapling density was significantly higher in dry stands Table 2
Main statistics of stands. Forest type: D – dry, DM – dry-mesic, M – mesic oak forests. n – number of stands, Variables: BA – basal area, m2/ha, DBH10 - stem density of DBH >10 cm trees, stem/ha, DBH50 - stem density of DBH >50 cm trees, stem/ha, Sap210 - density of DBH 2–10 cm saplings, stem/ha, Qrelden - relative density of oaks, %, QrelBA - relative basal area of oaks, %, QsapDen - relative density of oak saplings, %, TDW_vol - volume of total dead wood, m3/ha, SDW_vol - volume of standing dead wood, m3/ha, DDW_vol - volume of downed dead wood, m3/ha, rel_DDW - relative volume of downed dead wood, %; n – number of stands analysed, sd – standard deviation; modell – modell type; transform – transformation of the dependent variable (sqrt – square root transformation, varIdent – GLS modell weighted with unique variance of the factor levels); multcomp – result of the multiple comparisons, the letters indicate differences or identities based on p <0.05 level.
Forest type D DM M D DM M D DM M
Variable n mean ±sd mean ±sd mean ±sd modell transzform F p multcomp
BA 6 55 72 18.29 ±4.7 26.85 ±5.72 30.70 ±6.38 Gaussian no 15.31 1.07E−06 a b c
DBH10 10 37 68 562 ±178 409 ±127 349 ±105 Gaussian no 14.78 2.01E−06 c b a
DBH50 3 21 46 3.5 ±5.2 43.7 ±22.8 48.0 ±20.3 Gaussian no 12.71 1.95E−05 a b b
Sap210 5 15 30 1175 ±667 886 ±232 724 ±362 Gaussian no 3.61 3.47E−02 b ab a
Qrelden 6 31 63 86.8 ±9.5 46.4 ±23.5 20.3 ±11.3 Gaussian sqrt 51.34 6.19E−16 c b a
QrelBA 4 50 72 91.4 ±9.2 70.7 ±15.9 47.2 ±13.3 Gaussian no 51.19 2.20E−16 c b a
QsapDen 4 12 25 64.5 ±11.2 13.2 ±21.3 2.7 ±8.0 Gaussian log 19.93 4.62E−07 c b a
TDW_vol 3 10 7 16.3 ±2.8 54.6 ±17.5 54.6 ±17.5 Gaussian varIdent 44.21 <0.0001 a b c
SDW_vol 3 8 8 10.2 ±2.3 17.5 ±10.6 20.4 ±10.5 Gaussian varIdent 4.54 2.75E−02 a b b
DDW_vol 3 13 13 6.1 ±1.0 47.6 ±29.0 84.6 ±35.8 Gaussian varIdent 44.20 <0.0001 a b c
rel_DDW 3 8 7 37.8 ±6.4 69.1 ±12.6 81.4 ±10.7 Gaussian no 15.99 1.91E−04 a b b
Fig. 2. Mean (points) and standard deviation (whiskers) of basal area (A), tree density (B), large tree density (C) and sapling density (D) in different forest types (dry, dry-mesic and mesic). The forest type effect is indicated by the statistics of linear models (F and p values), the small letters indicate the statistical similarities and differences based on multiple comparisons.
than in mesic stands while dry-mesic stands had intermediate values (Fig. 2D, Table 2).
The diameter distribution of trees showed some similarities to the reverse J-shaped (negative exponential) distribution in all forest types, with some differences (Fig. 3, App. C). The proportion of the smallest category (10–15 cm) was higher in dry stands (43%) than in dry-mesic and mesic ones (circa 30%). Generally, the proportion of larger DBH categories (above 40 cm) was much smaller in dry oak forests than in others. The DBH distribution of dry-mesic and mesic stands were rather similar.
3.3. Composition
Canopy and sapling layers were dominated by oaks to varying de- grees in the studied stands. Mesic oak forests were no longer always dominated by oaks, but their presence was still determining according to the criteria for designation. The relative density of oaks in the canopy layer was also highest in the dry stands and lowest in the mesic stands (Fig. 4A). The relative density of oaks in the dry stands was rarely less than 80%, while in the mesic oak forests it remained below 50% in all the studied stands. The trend was similar for relative basal area of oaks (Fig. 4B). In this case, however, the difference between the dry and dry- mesic was not significant. The trend in the sapling layer was similar with significant differences between the forest types (Fig. 4C). While this layer was also dominated by oaks in dry oak forests, in the sapling layer of the dry-mesic and mesic stands oaks often played a subordinate role, and in 25 and 38% of the stands they were completely absent.
The relative density of oak was above 80% in all DBH categories in the dry forest type (Fig. 3, App. C). In dry mesic forest types it was lower in smaller categories (32% in 10–20 cm DBH) and high in larger cate- gories (above 90% in trees above 50 cm). In mesic forest type the oak proportion was only 7.5% in 10–20 cm DBH categories and 50–60% for trees larger than 50 cm DBH.
3.4. Changes of forest stands
Stands with repeated measurements were characterized by a decrease in total density (9 times in 13 cases) and an increase in basal area (19 times in 24 cases) during the studied time periods. Density and relative density of oaks decreased in all seven cases when data were available, and the relative importance values of oaks also declined.
However, the basal area and relative basal area of oaks increased frequently, in half of the dry-mesic stands and more than half of the mesic stands (Table 3).
3.5. Dead wood
The volume of dead wood was significantly lower in dry stands than in the other two types (Fig. 5A, Table 2). Although dry-mesic and mesic stands did not differ significantly due to the large standard deviance of dead wood, the mean values in the mesic stands were closer to double than in the dry-mesic (circa 110 versus 55 m3/ha, respectively). The volume of standing dead wood was also higher in dry-mesic and mesic types than in dry ones (Fig. 5B). The volume of downed dead wood increased from the dry to mesic forest types, resulting in significant differences (Fig. 5C). The proportion of downed dead wood had a similar trend than its volume (Fig. 5D); while less than 40% in dry oak forests was downed dead wood (standing exceeded its amount), its proportion was 80% in mesic stands.
4. Discussion 4.1. Structure
Tree density was higher but large tree density was lower in the dry stands than in the other two types. Consistent with the report by Bur- rascano et al. (2013), basal area increases and density decreases as the stands become more mesic. The whole stand structure changes along the humidity gradient, the density of trees decreases, the DBH distribution shifts from smaller to larger DBH classes and density of large trees and the basal area increases.
Partly such changes in the most important structural elements can be directly or indirectly linked to the characteristics of the site quality.
Mesic oak stands occur on more optimal sites as they receive more water (precipitation), which is also reflected in the composition and structure of the canopy and sapling layer. Better site quality generates a higher basal area compared to dry and dry-mesic oak forest types. This is also Fig. 3.The diameter at breast height (DBH) distribution of the trees in dry (A),
dry-mesic (B) and mesic (C) forest types. Bars indicate the mean, while whiskers the standard deviation of the relative density of trees in DBH categories of 5 cm intervals. The grey parts show the proportion of oaks in the different categories.
supported by the finding of a globally positive correlation between precipitation and basal area in wet-mesic temperate OG forests (Bur- rascano et al., 2013). In drier oak forests where the forest interior is rich in light, the density of saplings and lower canopy layers appears to be higher (Fralish et al., 1991; Martin, 1992; Hart et al., 2012; Barton, 2018) than in more mesic and often shaded stands. In mesic forest all dynamic processes, such as self-thinning in the lower layers, establish- ment of new trees, lateral crown expansion, are faster, because the better water supply results better growing conditions. In principle, seedling establishment and survival are also more likely under mesic conditions due to infrequent or absent drought periods.
However, the horizontal spatial structure of OG stands is commonly described by a mosaic of developmental stages (Johnson et al., 2019).
Spatial and temporal extent of stages is variable, e.g., the stand initiation stage is short and the area is smaller (Lorimer and Halpin, 2014).
Obviously, basal area may be influenced by the spatial proportion of stages - if there are more stand initiation or stem exclusion stages, BA is lower, if there are more others, basal area is higher (Lorimer and Halpin, 2014). A survey of spatial patterns over a larger area would be a good way to detect the spatial proportion of phases.
The high variance of density variables is remarkable, which may be related to the fact that tree mortality in OG stands is often influenced by density-independent factors (Franklin et al., 2002). Firstly, the role of natural disturbances, such as wind events, ice storms, insect outbrakes or fire, can vary greatly from region to region and from different forest types (Greenberg and Collins, 2015; Senf and Seidl, 2018). An additional source of variety in density of trees may be an environmental factor (precipitation) along with factors influencing germination and coloni- zation such as seed source, seedbed presence, wildlife density and competition with herb layer.
OG forests have more biomass and store more carbon than mature managed or unmanaged forests, which is mainly manifested in large living trees (LLT) and dead wood (Burrascano et al., 2013). They provide a habitat to many endangered or ecologically important organisms as the density of LLT is related to the number of cavities, bark pockets and other microhabitats (Kraus et al., 2016) and through this to the biodi- versity of certain groups of organisms (Paillet et al., 2018, 2019). The significant density of LLTs is one of the best indicators of OG forests (Burrascano et al., 2013). LLTs grow for a long time due to their longevity, so their role in carbon accumulation is also prominent (Sist et al., 2014; Keeton, 2018). Also, referring to the site productivity and in this context (the slower growth rate of the trees), the LLT density is lower in the drier oak forests than in the mesic stands (e.g. Fralish et al., 1991; Hart et al., 2012). Their density positively correlates with the average age of the dominant trees and the age of the oldest trees (Bur- rascano et al., 2013), supporting the theory of carbon accumulation in the later stages of stand development (Keeton et al., 2011). However, it is clear that in drier sites where trees grow slowly, they need more time to reach a large size. The previously proposed 30 stem/ha LLT for wet- mesic temperate forests (Burrascano et al., 2013) would be supple- mented by 20–25 stem/ha for dry and dry-mesic and 25–30 stem/ha for mesic oak forests.
LLT density is directly related to the volume of dead wood and contributes to long-lasting dead wood, as the degradation of dead wood is highly dependent on climate, tree species, density and resilience of dead wood on size at death (Cornwell et al., 2009; Kahl et al., 2017).
Some of these stands may be burned frequently and fire would also play a role. Although large dead wood is not often consumed in low intensity fires that occur in some oak stands, repeated low intensity fires can accelerate decomposition of logs. Previous studies have also demon- strated (Goebel and Hix, 1996; Lombardi et al., 2010; Burrascano et al., 2013; B¨ol¨oni et al., 2017) that significantly more dead wood is found in OG than in managed forests, confirming the role of an indicator of dead wood in identifying OG conditions (Paletto et al., 2012). In the majority of European managed forests, most of the merchantable timber is har- vested, thereby the volume of dead wood is low (B¨ol¨oni et al., 2017;
Fig. 4. Relative density (A) basal area (B) and sapling density (C) of Quercus (Q.) species in dry, dry-mesic and mesic forest types. The forest type effect is indicated by the statistics of linear models (F and p values), the small letters indicate the statistical similarities and differences based on multiple comparisons.
Keren and Diaci, 2017) as it reaches only 10–20% of the OG stands of the same forest type (Stokland et al., 2012; Puletti et al., 2019). However, in European forests that have not been managed for a long time but have not or only partially achieved OG characteristics, the volume of dead wood can reach the values of OG forests (Rahman et al., 2008; Vande- kerkhove et al., 2009; Aszalos et al., 2017; B´ ¨ol¨oni et al., 2017). It is known that the volume of dead wood in OG forests increases in direct proportion to forest productivity (Harmon et al., 1986; Spetich et al., 1999; Nilsson et al., 2002). This is also supported by the dead wood data from the literature on OG oak forests. Fundamentally lower site pro- ductivity is the cause of dry and dry-mesic oak forests typically con- taining less dead wood than mesic oak stands despite the decomposition being faster in more mesic conditions. In wet-mesic OG forests, fewer dead trees were found in warmer places (Burrascano et al., 2013);
however high variability may also be related to different decay rates. If the proportion of dead wood is taken into account, differences in pro- ductivity could be eliminated. However such data for oak OG forests is very limited. In Europe, the proportion varies between 11 and 31%.
Dead wood is an important long-term carbon storage, so forest man- agement that maintains or increases OG characteristics can also increase carbon storage capacity of the forest (Bauhus et al., 2009; Keeton, 2018).
Furthermore, many dead trees and LLT increase the habitats of late successional species. Dead wood is a key factor that enhances biodi- versity by providing habitat for a wide variety of specialized, saproxylic and other organisms (Stokland et al., 2012; Roth et al., 2019), proving that it has become one of the most important indicators of forest biodiversity and OG forests in Europe (Paletto et al., 2012).
The DBH distribution of OG forests was typically considered negative exponential (reverse J-shaped), but on further examination it was found that a rotated sigmoid-type curve with a second peak also occurs (Pio- vesan et al., 2005; Westphal et al., 2006) and may even be more common (Schmelz and Lindsey, 1965; Goff and West, 1975). In the DBH distri- bution of OG oak forests, we also found that a pronounced, well-visible secondary peak is often seen in the DBH distribution and that multiple secondary peaks rarely occur (e.g. McCune et al., 1988; Hicks and Holt, 1999; Ford et al., 2017). DBH distribution in OG oak forests revealed a reverse J-shaped distribution from small size classes to large size classes less frequently in the studied oak forests, but the diameter frequency distribution of the rotated-sigmoid form, where a small peak can be found in DBH distribution in size classes between 30 and 50 cm proved to be more common. In addition, the distribution curve of DBH is often difficult to type. There are many curves of other types than reverse-J and rotated sigmoid. In 38 of the 67 OG oak stands examined, the shape of the DBH distribution curve is not reverse J. The peak or peaks no longer appears on the average DBH distribution, as it varies greatly from stand to stand.
The plot size can influence the DBH distribution of the studied oak OG forests. In the present study, the mean total sampled area was 2.9 ha in stands having reverse J-distribution, while total sampled area was 0.7 ha for rotated sigmoid or other distribution type. The total sampled area reached 2 ha in 13 studied OG oak stands, 11 of which had a reverse J- shaped DBH distribution curve, whether one large or many small plots scattered through the same stand. Although the reverse J-shaped curve is traditionally considered to be a characteristic of equilibrium OG Table 3
Data of changes in composition. BA - basal area.
Wood Country Reference Years Changes in
Density,
stem/ha BA, m2/
ha Oak
density Oak relative
density Oak
BA Oak
relative BA Dry-mesic oak
forests
Boky EU, Slovakia Saniga et al. 2014 1974–2004 10 0.40 − 97 −16 − 2.10 −7
Lilley Cornett Woods,
Oak USA,
Kentucky Chapman & McEwan 2016 1979–2010 78 9.84 − 38 −13 4.38 −7
Hutcheson Memorial
Forest USA, New
Jersey Sulser 1971 1950–1969 8 0.44 − 8 −2 0.35 0
Coweeta HL, II - Q.
prinus USA, N
Carolina Elliott et al. 1969 1969–1993 0.20 − 0.27 −1
Coweeta HL, VI - dry-
mesic oak USA, N
Carolina Elliott et al. 1969 1969–1993 −2.80 − 3.66 −8
Coweeta HL, III -
mixed USA, N
Carolina Elliott et al. 1969 1969–1993 3.30 1.87 3
Brush Mt., lower
stand USA,
Virginia Rhoades 1992 1971–1991 217 3.57 82 −7 3.08 2
Brush Mt., upper
stand USA,
Virginia Rhoades 1992 1971–1991 −245 6.80 − 305 −11 5.91 0
Mountain Lake BS,
MLBS plot USA,
Virginia Redmond et al. 2012 1984–2008 −0.70 0 − 1.30 −2
Mesic oak forests
Brownfield Woods USA, Illinois Miceli et al. 1977 1925–1975 7.44 −5 3.42 5
Kaskaskia Woods USA, Illinois Zaczek et al. 2002 1935–1997 11.65 −15 4.16 −2
Radrick Forest USA,
Michigan Hammitt & Barnes 1989 1968–1988 −104 − 58 −4
Weaver’s Woods USA, Illinois Shotola et al. 1992, Weaver &
Ashby 1971 1956–1983 29 6.57 − 5 −12 0.12 −11
Davis-Purdue
Research Forest USA,
Indiana Parker et al. 1985, Leopold et al.
1985, Lowney et al. 2016 1926–1976 7.30 −26 4.37 −2
1926–2011 293 5.00
Donaldson’s Wood USA,
Indiana Barton & Schmelz 1987,
Lowney et al. 2016 1954–1984 −43 2.10 − 29 −6 − 0.15 −5
1954–2011 −103 2.51
Hemmer Woods USA,
Indiana Lowney et al. 2016 1992–2011 −35 −0.80
Schnabel Woods USA,
Missouri Richards et al. 1995 1982–1992 −175 0.00 1.26 4
Coweeta HL, V - mesic
mixed-oak USA, N
Carolina Elliott et al. 1969 1969–1993 0.10 0.55 1
Mountain Lake BS, TS
plot USA,
Virginia Redmond et al. 2012 1983–2008 4.00 −1 2.30 −4
stands, it has been found that other types may also be typical (Schmelz and Lindsey, 1965; Goff and West, 1975; Westphal et al., 2006).
Previously the rotated sigmoid-type DBH distribution was mostly detected from relatively small plots because they do not necessarily represent the structural heterogeneity of the whole stand (Westphal et al., 2006). A similar conclusion was reached by Rubin et al. (2006), who stated that if the total sampling area was too small, it was likely that the observed DBH distribution will be a rotated sigmoid, even if the sample was from a stand with a DBH distribution of reverse J-shaped.
This suggested that reverse J is one of the expected shapes of the DBH distribution in OG oak forests.
Beside plot size, there could be other explanations of the presence of a second peak in the DBH distribution. (1) Intermediate severity dis- turbances generate periodic regeneration events that result peaks of cohorts in DBH distribution (Sano, 1997) and the return interval based on Hart and Cox (2017) of these disturbances in oak stands may be either 20–50 years. (2) Although these OG forests are in the old late succes- sional stages and have been undisturbed for 100–200 years, they may have been considerably disturbed in the past, and this former impact can still be seen in the DBH distribution (e.g. Aldrich et al., 2005; McClain et al., 2006); (3) the disturbance regime has changed in the last decades or century (Abrams and Copenheaver, 1999; Shumway et al., 2001;
Buchanan and Hart, 2012; Lowney et al., 2016). For example, 100–200 years ago there was an ‘initial’ state, a more open forest, the structure of which was developed by earlier, more intense disturbances, e.g., grazing
or fires. This state is gradually replaced by a stand with a different structure connected to small-scaled gap dynamics which is due to the changing disturbance regime, e.g., previous disturbances have dis- appeared, the internal dynamics of the forest are more prevalent and all these changes are reflected in the structure.
4.2. Composition
Other tree species play a significant role in OG oak forests, most notably the species of genera Acer, Carya, Fraxinus, Fagus, Carpinus, Tilia, Ulmus, Liriodendron, Betula, Castanea, Oxydenrum and Pinus. Relative density and relative basal area of non-oak species is the smallest in dry oak forests and largest in mesic stands. The relative basal area of admixed trees also reaches 10% in dry stands. These data draw attention to the fact that the relatively high presence of other tree species than oak is very important, especially in dry-mesic and mesic stands. The density of other tree species is independent from the number of species of the region; in Europe, there are usually far fewer tree species in a given area than in the United States or East Asia. Relevant forest ecology papers from Europe also suggest the presence of a higher cover of admixed tree species (e.g. Chytrý, 1997; Vera, 2000; Roleˇcek, 2005; Nov´ak et al., 2020).
The larger relative basal area of non-oak species in mesic oak OG forests is a characteristic feature of the review selection in this study. We classified all stands as oak forest where the relative basal area of oaks Fig. 5. Volume of total (A), standing (B) and downed (C) dead wood, as well as the relative volume of downed deadwood in dry, dry-mesic and mesic forest types (D). The forest type effect is indicated by the statistics of linear models (F and p values), the small letters indicate the statistical similarities and differences based on multiple comparisons.
reached 25% and the relative basal area of mesophytic tree species, mainly beech, hornbeam and some maples were smaller than that of oaks or total relative basal area of any other genus does not exceed 30%.
Thus, in stands with low oak relative basal area, the proportion of other species is inherently high. The studied oak forests where the total rela- tive basal area of non-oak tree species is above 50% are almost all mesic forests, which may be related to site conditions. Oak regeneration have relatively high light requirement, that results a narrow regeneration window for them on mesic sites (Hodges and Gardiner, 1993; Johnson et al., 2019). Shade tolerant and other mesophytic tree species regen- erate better partly because of their lower light requirement and partly because of the favourable growing conditions on mesic site. The competitiveness of other tree species is usually stronger than that of oaks, so their growth rate remains faster, which helps to maintain a relatively high basal proportion of them in later development stages.
Drier conditions are more conducive to oak regeneration, oaks can regenerate across a much wider range of light conditions on drier site (Hodges and Gardiner, 1993; Johnson et al., 2019), where regeneration of mesophytic tree species is more difficult due to the low moisture availability.
The changes in species composition based on repeated measurements have a common general trend – the proportion of oaks is decreasing, while total basal area increasing, i.e., large trees become more pro- nounced in the DBH distribution. Recently, owing to the invasion of shade-tolerants, especially maple species, the concomitant decline of oaks is often indicated in the oak OG forests of the US as a dominant characteristic of ‘mesification’ (e.g. Sulser, 1971; Abrams and Downs, 1990; Shotola et al., 1992; Abrams, 1998; Abrams and Copenheaver, 1999; McCarthy et al., 2001; McClain et al., 2006), but the process has also been reported in Europe (Vera, 2000; Thomas et al., 2002; Rohner et al., 2012; Saniga et al., 2014; Aszal´os et al., 2017). This mesification phenomenon is complex. The remaining old oak individuals continue to grow and reach increasingly larger sizes. The density of other species, especially maples, increases, but these other tree species are mostly in lower DBH classes of sapling to understorey layers and their growth in the basal area are not significant.
Several authors conclude that the species composition of oak forests is in a transition stage (e.g. Sulser, 1971; Abrams and Downs, 1990;
Shotola et al., 1992; Spetich and Parker, 1998; McCarthy et al., 2001;
McClain et al., 2006; Pierce et al., 2006; Hart et al., 2012; Redmond et al., 2012; Chapman and McEwan, 2016). This shift in tree species composition is clearly revealed by long-term datasets; however, there is no clear evidence that this trend will continue and that the relative density and basal area of oaks will never return to previous levels at least in some of the stands (Hett and Loucks, 1976; Glitzenstein et al., 1986).
Furthermore the spread of shade-tolerants affects mesic oak forests more than dry ones. The few stands where continuous oak regeneration was recorded and the relative density of shade tolerance hardly changed are dry and dry-mesic oak forests. Hence, some studies suggest that oaks can maintain their proportions at dry and dry-mesic sites (Ross et al., 1982;
Abrams et al., 1997, 1998; Heeter et al., 2019), a phenomenon also emphasized for European oak forests by Bobiec et al. (2000). This findings can also be related to the oak “regeneration window” along light and moisture gradients, which refers how can oaks regenerate across a much wider range of light conditions on drier, than in mesic sites (Hodges and Gardiner, 1993; Johnson et al., 2019).
4.3. Representativity of OG oak forest studies
Based on our literature search, we can identify areas and forest types where there are few or no data available on OG oak forests. Deciduous oak species mainly occur in parts of North-America, Europe and Asia, but we found papers mainly from the United States, supplemented by some articles from Europe and East Asia. Papers from Russia, West and Central Asia and Eastern Europe are completely absent from the litera- ture in English, but there is also probably little data from East Asia and
usable, detailed data were not found for Central America either.
Furthermore, there is hardly any data from Central and Western Europe.
Gaps in data are expected in part as OG oak forests may have remained in few stands and in a very small area in Europe. The oak-dominated regions of Europe have been used by humans for a very long time and the vegetation is mostly heavily changed. We also have very little data on dry OG oak forests.
There are also shortcomings in the completeness of the structural elements discussed in the papers. Papers often do not include all the structural features that are useful for understanding the structure and dynamics of OG forests, such as dead wood data, vertical and horizontal heterogeneity indices, gaps and tree species diversity indices. It is common that only derived data are reported and the original variables are missing. The volume of standing, living and dead trees is very often missing as well. All these observations support that further studies are necessary, with detailed, well documented and standardized structural variables.
5. Conclusions
Obviously, temperate OG oak forests have many globally important ecosystem services, so conserving the Earth’s remaining OG oak forests is an important task. Moreover, the restoration of OG forests would also be required. For restoration of oak forests, it is necessary to know the most important characteristics of the remaining natural OG stands.
‘Management for OG‘ can be incorporated into forest management practices (Bauhus et al., 2009). Forest managers should quantify the targets and thresholds of some structural and compositional variables within this framework. One key element is the volume of dead wood, both for carbon accumulation and habitat development. It is suggested to maintain 30–40 m3/ha dead wood in dry-mesic and 50 m3/ha in mesic oak forests if we want to develop close-to-nature stands. The volume of dead wood can be increased relatively easily with basic forestry techniques, e.g. by felling and girdling trees and maintain dying trees rich in microhabitats (Vítkov´a et al., 2018). Mesic oak forests are clearly characterized by a higher relative volume of downed dead wood, so it is recommended that at least 2/3 of all dead wood be downed. Dry and dry-mesic oak forests are better characterised by standing dead wood, in which the relative volume of downed dead wood seems to be ideal between 50 and 75%. However, it should also be mentioned that we can only increase the volume of dead wood relatively quickly in the short term with these techniques. However, the development of rotten, decomposed dead wood, which is also characteristics of OG stands, is a more time-consuming task.
The quantity and quality of the other key elements are more difficult and slower to increase and improve. Additional key elements based on the review are the LLT (DBH >50 cm). In dry and dry-mesic oak forests, we consider 20–25 stem/ha and in mesic oak forests 25–30 stem/ha LLT acceptable, but these densities should be used as a kind of minimum in
‘disturbance-based‘ or ‘close-to-nature silviculture‘. For example, stands that already contain OG structural elements are capable of maintaining a larger density of LLT. Crown release is one of the silvicultural techniques that can be used to increase the density of large trees. Unfortunately, the most difficult thing is to increase the number of old, large trees due to their age and longevity. Therefore, every effort should be made to pro- tect such existing trees as well as those that could potentially become large.
A low density of admixed tree species is a considerable difficulty in Europe. The relative basal area and density of admixed tree species can be increased by tree species-selective interventions, where we save in- dividuals of admixed trees and bring them to a larger growing space. The DBH distribution can also be improved slowly by observing the char- acteristic density data of each size class. Since the forests are also constantly changing as a result of interventions and natural distur- bances, shifting a (homogeneous) Gaussian DBH distribution toward a natural-like distribution is not an easy task. The goal is for the 10–20 cm
DBH classes to have a relative density of about 35–55% of total density in mesic and 45–60% in dry-mesic oak forests. These are obviously target numbers – individual stands may be different, and smaller or larger densities may be acceptable. Ideally, relative density of large trees (DBH >50 cm) is min. 5–10% of the total density.
Our study advances the science by gathering and reviewing relevant forest stand data on the temperate OG oak forest habitats. Our results contributed to a better understanding of the structure and composition of temperate oak OG forests at the continental and forest type level. This knowledge on reference number is essential to improve conservation- poriented or close-to-nature forestry practices to maintain biodiversity and emulate natural forest structures and processes.
CRediT authorship contribution statement
Janos B´ ¨ol¨oni: Conceptualization, Data curation, Formal analysis, Investigation, Methodology, Writing – original draft. R´eka Aszal´os:
Writing – original draft. Tam´as Frank: Writing – original draft. P´eter Odor: Formal analysis, Methodology, Writing – original draft. ´ Declaration of Competing Interest
The authors declare that they have no known competing financial interests or personal relationships that could have appeared to influence the work reported in this paper.
Acknowledgements
Our research is supported by the LIFE 4 Oak Forests project (LIFE16NAT/IT/000245), the National Science and Innovation Found (NKFIH K128441) and the Hungarian Academy of Sciences (KEP Ecol- ogy for Society project). We are grateful for the two anonymous re- viewers for their helpful comments and suggestions that substantially improved the manuscript.
Appendix A. Supplementary material
Supplementary data to this article can be found online at https://doi.
org/10.1016/j.foreco.2021.119629.
References
Abrams, M.D., 1998. The red maple paradoxon. What explains the widespread expansion of red maple in eastern forests? Bioscience 48, 355–364.
Abrams, M.D., Copenheaver, C.A., 1999. Temporal variation in species recruitment and dendroecology of an old-growth white oak forest in the Virginia Piedmont, USA. For.
Ecol. Manage. 124, 275–284.
Abrams, M.D., Downs, J.A., 1990. Succesional replacement of old-growth white oak by mixed mesophytic hardwoods in southwestern Pennsylvania. Can. J. For. Res. 20, 1864–1870.
Abrams, M.D., Orwig, D.A., Dockry, M.J., 1997. Dendroecology and successional status of two contrasting old-growth oak forests in the Blue Ridge Mountains, U.S.A. Can. J.
For. Res. 27, 994–1002.
Abrams, M.D., Ruffner, C.M., DeMeo, T.E., 1998. Dendroecology and species co-existence in an old-growth Quercus–Acer–Tilia talus slope forest in the central Appalachians, USA. For. Ecol. Manage. 106, 9–18.
Aldrich, P.R., Parker, G.R., Romero-Severson, J., Michler, C.H., 2005. Confirmation of oak recruitment failure in Indiana old-growth forest: 75 years of data. Forest Sci. 51, 406–416.
Aszal´os, R., Horv´ath, F., M´azsa, K., Odor, P., Lengyel, A., Kov´ ´acs, G., B¨ol¨oni, J., 2017.
First signs of old-growth structure and composition of an oak forest after four decades of abandonment. Biologia 72, 1264–1274.
Badalamenti, E., Pasta, S., La Mantia, T., La Mela Veca, D.S., 2018. Criteria to identify old-growth forests in the Mediterranean: A case study from Sicily based on literature review and some management proposals. Feddes Repertorium 129, 25–37.
Barton, A.M., 2018. Introduction: Ecological and historical context. In: Barton, A.M., Keeton, W.S. (Eds.), Ecology and recovery of eastern old-growth forests. Island Press, Washington D.C., pp. 1–19
Bauhus, J., Puettmann, K., Messier, C., 2009. Silviculture for old-growth attributes. For.
Ecol. Manage. 258, 525–537.
Bauhus, J., Puettmann, K.J., Kühne, C., 2013. Close-to-nature forest management in Europe. Compatible with managing forests as complex adaptive forest ecosystems?, in: Messier, C., Puettmann, K.-J., Coates, K.D. (Eds.), Managing forests as complex
adaptive systems: building resilience to the challenge of global change. The Earthscan Forest Library Publisher, Routledge Editors, pp. 187–213.
Bobiec, A., van der Burgt, H., Meijer, K., Zuyderduyn, C., Haga, J., Vlaanderen, B., 2000.
Rich deciduous forests in Bialowieza as a dynamic mosaic of developmental phases:
premises for nature conservation and restoration management. For. Ecol. Manage.
130, 159–175.
Barton, J.D., Schmelz, D.V., 1987. Thirty years of growth records in Donaldson’s Woods.
P. Indiana Acad. Sci. 96, 209–214.
B¨ol¨oni, J., Odor, P., ´ Ad´am, R., Keeton, W.S., Aszal´ ´os, R., 2017. Quantity and dynamics of dead wood in managed and unmanaged dry-mesic oak forests in the Hungarian Carpathians. For. Ecol. Manage. 399, 120–131.
Bryant, D., Nielsen, D., Tangley, L., 1997. The last frontier forests: ecosystems and economies on the edge. World Resources Institute, Washington.
Buchanan, M.L., Hart, J.L., 2012. Canopy disturbance history of old-growth Quercus alba sites in the eastern United States: Examination of long-term trends and broad-scale patterns. For. Ecol. Manage. 267, 28–39.
Buchwald, E., 2005. A hierarchical terminology for more or less natural forests in relation to sustainable management and biodiversity conservation, Proceedings:
Third expert meeting on harmonizing forest-related definitions for use by various stakeholders Food and Agriculture Organization of the United Nations. FAO, Rome.
Burrascano, S., Keeton, W.S., Sabatini, F.M., Blasi, C., 2013. Commonality and variability in the structural attributes of moist temperate old-growth forests: A global review.
For. Ecol. Manage. 291, 458–479.
Chapman, J.I., McEwan, R.W., 2016. Thirty years of compositional change in an old- growth temperate forest: The role of topographic gradients in oak-maple dynamics.
PLoS ONE 11 (7), e0160238.
Chytrý, M., 1997. Thermophilous oak forests in the Czech Republic: Syntaxonomical revision of the Quercetalia pubescenti-petraeae. Folia Geobot. 32, 221–258.
Cornwell, W.K., Cornelissen, J.H.C., Allison, S.D., Bauhus, J., Eggleton, P., Preston, C.M., Scarff, F., Weedon, J.T., Wirth, C., Zanne, A.E., 2009. Plant traits and wood fates across the globe: rotted, burned, or consumed? Glob. Change Biol. 15, 2431–2449.
de Gouvenain, R.C., Silander, J.A. Jr., 2016. Temperate forests, in: Reference Module in Life Sciences, Elsevier, ISBN: 978-0-12-809633-8, https://doi.org/10.1016/B978-0- 12-809633-8.02310-4 - Authors’ copy.
Denk, T., Grimm, G.W., Manos, P.S., Deng, M., Hipp, A.L., 2017. An updated infrageneric classification of the oaks: review of previous taxonomic schemes and synthesis of evolutionary patterns, in: Gil-Pelegrín, E., Peguero-Pina, J., Sancho-Knapik, D.
(Eds.), Oaks physiological ecology. Exploring the functional diversity of genus Quercus L. Tree Physiology, vol. 7., Springer, Cham, Switzerland, pp. 13–38.
Dey, D.C., 2014. Sustaining oak forests in eastern North America: Regeneration and recruitment, the Pillars of Sustainability. For. Sci. 60, 926–942.
Elliott, K.J., Vose, J.M., Swank, W.T., Bolstad, P.V., 1969. Long-term patterns in vegetation-site relationships in a Southern Appalachian Forest. J. Torrey Bot. Soc.
126, 320–334.
FAO, 2020. Global Forest Resources Assessment 2020: Main report. Rome. https://doi.
org/10.4060/ca9825en.
Faraway, J.J., 2005. Linear models with R. Chapmann and Hall, London.
Ford, S.A., Kleinman, J.S., Hart, J.L., 2017. Spatial patterns of canopy disturbance, structure, and species composition in a multi-cohort hardwood stand. Forests 8, 93;
doi:10.3390/f8030093.
Fralish, J.S., Crooks, F.B., Chambers, J.L., Harty, F.M., 1991. Comparison of presettlement, second-growth and old-growth forest on six site types in the Illinois Shawnee Hills. Am. Midl. Nat. 125, 294–309.
Franklin, J.F., Spies, T.A., Van Pelt, R., Carey, A.B., Thornburgh, D.A., Berg, D.R., Lindenmayer, D.B., Harmon, M.E., Keeton, W.S., Shaw, D.C., Bible, K., Chen, J.Q., 2002. Disturbances and structural development of natural forest ecosystems with silvicultural implications, using Douglas-Fir forests as an example. For. Ecol.
Manage. 155, 399–423.
Garbarino, M., Marzano, R., Shaw, J.D., Long, J.N., 2015. Environmental drivers of dead wood dynamics in woodlands and forests. Ecosphere 6, 1–24.
Gilg, O., 2004. Old-growth forests. Characteristics, conservation and monitoring. Habitat and species management. Technical report 74. Cahiers Techniques de l’ATEN, Montpellier.
Gil-Pelegrín, E., Peguero-Pina, J., Sancho-Knapik, D., 2017. Oaks and people: A long journey together, in: Gil-Pelegrín, E., Peguero-Pina, J., Sancho-Knapik, D. (Eds.), Oaks physiological ecology. Exploring the functional diversity of genus Quercus L.
Tree physiology, vol. 7., Springer, Cham, Switzerland, pp. 1–11.
Glitzenstein, J.S., Harcombe, P.A., Streng, D.R., 1986. Disturbance, succession, and maintenance of species diversity in an east Texas forest. Ecol. Monogr. 56, 243–258.
Goebel, P.C., Hix, D.M., 1996. Development of mixed-oak forests in southeastern Ohio: a comparison of second-growth and old-growth forests. For. Ecol. Manage. 84, 1–21.
Goff, F.G., West, D., 1975. Canopy-understorey interaction effects on forest population structure. For. Sci. 21, 98–108.
Greenberg, C.H., Collins, B.C. (Eds.), 2015. Natural disturbances and historic range of variation type, frequency, severity, and post-disturbance structure in Central Hardwood Forests USA. Springer.
Gutierrez, A.G., Armesto, J.J., Aravena, J.C., Carmona, M., Carrasco, N.V., Christie, D.A., Pena, M.P., Perez, C., Huth, A., 2009. Structural and environmental characterization of old-growth temperate rainforests of northern Chiloe Island, Chile: regional and global relevance. For. Ecol. Manage. 258, 376–388.
Harmon, M.E., Franklin, J.F., Swanson, F.J., Sollins, P., Gregory, S.V., Lattin, J.D., Anderson, N.H., Cline, S.P., Aumen, N.G., Sedell, J.R., Lienkaemper, G.W., Cromack Jr., K., Cummins, K.W., 1986. Ecology of coarse woody debris in temperate ecosystems. Adv. Ecol. Res. 15, 133–302.
Hammitt, W.E., Barnes, B.V., 1989. Composition and structure of an old-growth oak- hickory forest in Southern Michigan over 20 years. In: Rink, G., Budelsky, C.A.