Manuscript Details
Manuscript number JFCA_2019_612
Title Biofortification of green bean (Phaseolus vulgaris L.) and lettuce (Lactuca sativa) with iodine in a plant-calcareous sandy soil system irrigated with KI containing water
Article type Research Paper
Abstract
Iodine uptake and translocation of uptake and lettuce (Lactuca sativa) and green bean (Phaseolus vulgaris L.) were investigated in a calcareous sandy soil-plant system. Green bean and lettuce plants were cultivated in calcareous candy soil applying irrigation water with the iodide concentration of 0.10, 0.25 and 0.50 mg/L. The growth of these plants was stimulated at the iodine concentration of 0.10 and 0.25 mg/L and hampered at 0.50 mg/L. In the edible parts of green bean and lettuce plants irrigated with 0.25 mg/L iodide containing water, the iodine concentration amounted to 0.6 and 5.2 mg/kg DW, respectively. In lettuce the uptake and translocation of micro and macro nutrients were also stimulated (20-260%) by iodide treatment, however, in green bean fruits this phenomenon was negligible.
Considering the iodine (5.2 mg/kg DW) and water concentrations (81%) of the fresh lettuce leaves, the consumption of 100 g fresh vegetable covers about 66% of the recommended dietary allowance (150 μg), The green bean plants, due to their low iodine translocation from the roots to the fruits are not suitable for biofortification with iodine.
Keywords green bean, lettuce, biofortification, iodine deficiency, micro nutrients, calcareous sandy soil
Corresponding Author Gyula Zaray Corresponding Author's
Institution
Cooperative Research Centre of Environmental Sciences, Eötvös Loránd University
Order of Authors Péter Dobosy, Krisztina Kröpfl, Mihály Óvári, Sirat Sandil, Kitti Németh, Attila Engloner, Tünde Takács, Gyula Zaray
Submission Files Included in this PDF
File Name [File Type]
Cover letter_JFCA.docx [Cover Letter]
Highlights.docx [Highlights]
Title page.docx [Title Page (with Author Details)]
Manuscript_JFCA.docx [Manuscript (without Author Details)]
Figures.docx [Figure]
Tables.docx [Table]
To view all the submission files, including those not included in the PDF, click on the manuscript title on your EVISE Homepage, then click 'Download zip file'.
Cover letter
May 03, 2019
Prof. Dr. James M. Harnly
Editor-in-Chief, Journal of Food Composition and Analysis United States Department of Agriculture
Agricultural Research Service
Dear Prof. Dr. James M. Harnly
I am submitting a manuscript for consideration of publication in Journal of Food Composition and Analysis.The manuscript is entitled “Biofortification of green bean (Phaseolus vulgaris L.) and lettuce (Lactuca sativa) with iodine in a plant-calcareous sandy soil system irrigated with KI containing water”.
It has not been published elsewhere and it has not been submitted simultaneously for publication elsewhere.
Thank you very much for your consideration.
Yours Sincerely, Péter Dobosy Ph.D.
MTA Centre for Ecological Research Danube Research Institute
Karolina út 29-31.
H-1113, Budapest
Tel.: +36-1-279-3100/ext.209 E-mail: dobosy.peter@okologia.mta.hu
HIGHLIGHTS
Iodine achieved its highest concentration in the roots of both plants
Essential element transport of lettuce was stimulated by adding 0.25 mg/L iodine
Lettuce plant was more suitable for biofortification with iodine
Biofortification of green bean (Phaseolus vulgaris L.) and lettuce (Lactuca sativa) with iodine in a plant-calcareous sandy soil system irrigated with KI containing water
Péter Dobosya, Krisztina Kröpfla, Mihály Óvária, Sirat Sandilb Kitti Németha, Attila Englonera,Tünde Takácsc, Gyula Záraya,b*
a MTA Centre for Ecological Research, Danube Research Institute, Karolina út 29-31, H-1113 Budapest, Hungary
bCooperative Research Centre of Environmental Sciences, Eötvös Loránd University, Pázmány Péter sétány 1/A, H-1117 Budapest, Hungary
cMTA Centre for Agricultural Research, Institute for Soil Sciences and Agricultural Chemistry, Herman Ottó út 15, H-1022 Budapest, Hungary
*Corresponding author: Gyula Záray, zaray@chem.elte.hu, +36 1 3722500
1 1. INTRODUCTION 2
3 Iodine is an essential micronutrient present in the human body in minute amounts (15 – 20 mg) 4 almost exclusively in the thyroid gland. It is an essential component of the thyroid hormones, 5 which regulate the metabolic processes in most cells, as well as play a dominant role in the 6 process of early growth and development of most organs especially that of the brain.
7 Consequently, iodine deficiency, if severe enough to affect thyroid hormone synthesis during 8 the above mentioned critical periods, will result in hypothyroidism and brain damage 9 (Andersson et al. 2007; Delange 2002). The recommended daily iodine intake is 90 g, 120 g 10 and 150 g for the age groups of 0-59 months, 6 – 12 years, as well as adolescents and adults, 11 respectively. During pregnancy and lactation, 250 g daily intake is recommended (WHO 12 2004). However, both in the developing and the developed countries, the daily iodine intake of 13 the people is insufficient which leads to iodine deficiency disorders(Delange et al. 2002). The 14 main intervention strategy for iodine deficiency monitoring and prevention is the “universal”
15 salt iodization. (Andersson et al. 2007) It means that all salt products intended for human 16 consumption, including that used in processed foods, and that used for animal feeding, are 17 iodized. Iodine can be added to table salt as potassium iodide, potassium iodate or sodium 18 iodide. Potassium salts are the most frequently used compounds, and iodate is more preferred 19 due to its higher stability and lower solubility than that of iodide. The iodized table salt as a 20 simple prophylaxis tool has been successfully introduced in several countries in spite of 21 possible iodine losses during transportation, storage or cooking itself (Kaputsa-Duch et al.
22 2017; Rana & Raghuvanshi 2013) Another possibility to eliminate the iodine deficiency is the 23 consumption of iodized oils, like the most commonly used Lipiodol, a poppy seed oil containing 24 40% iodine per weight(Azizi 2007; Wolff 2001). In addition to these relatively efficient and 25 worldwide applied methods, different experiments were also carried out in different countries
26 e.g., production of bread fortified with iodine, application of iodized drinking water or iodized 27 sugar(Andersson et al. 2007). However, their efficiency and applicability were not comparable 28 with those of the table salts. Due to new policies adopted by many countries to reduce salt 29 consumption by 50% to 5 g/day in order to prevent hypertension and cardiovascular diseases, 30 the indirect iodization of food materials have been receiving a growing attention. One way is 31 the fortification of animal fodder and the iodine content of foods derived from animal sources 32 and the second is the fortification of iodine content of different edible plants applying iodine 33 containing irrigation water.
34 On basis of literature data the agronomic biofortification of crops with iodine seems to be a 35 promising way to increase the iodine intake of the population of different countries (Azizi 36 2007). Approximately 80% of the iodine in the human body and animals originating from 37 plants, and 99% of this iodine is bioavailable and can be easily assimilated (Gonzali et al. 2017).
38 Therefore plant-based foods with increased iodine content offer an attractive and cost-effective 39 approach to decrease the iodine deficiency.
40 Recently, hydroponic (Kato et al. 2013; Landini et al. 2011; Li et al. 2016;; Voogt et al. 2010;
41 Weng et al. 2008; Zhu et al. 2003; Zhu et al. 2004) pot (Blasco et al. 2008; Blasco et al. 2012;
42 Caffagni et al. 2011; Dai et al. 2006; Hong et al. 2008; Hong et al. 2009; Voogt et al. 2014;
43 Weng et al; 2008) and field (Lawson et al. 2015; Smoleń et al. 2011) experiments were carried 44 out to produce iodine enriched crops applying iodine containing nutrient solutions or irrigation 45 water, as well as solid fertilizers (e.g. algal-based). In addition to the iodine doses the chemical 46 form of iodine (iodide or iodate) was also investigated. For these experiments different 47 vegetables were selected such as lettuce (Lactuca sativa L.)(Blasco et al. 2008; Blasco et al.
48 2012; Hong et al. 2008; Lawson et al. 2015; Voogt et al. 2010),spinach (Spinacia oleracea) 49 (Dai et al. 2006; Weng et al., 2008; Zhu et al. 2003; Zhu et al. 2004), packhoi (B. Chinensis L.) 50 (Hong et al. 2009), cabbage (Brassica oleracea) (Weng et al. 2008), Chinese cabbage (B.
51 chinesis L.)(Hong et al. 2008), tomato (Solanum lycopersicum) (Caffagni et al. 2011; Hong et 52 al. 2008; Landini et al. 2011), strawberry (Fragaria ananassa) (Li et al. 2016), pepper 53 (Capsicum annuum L) (Hong et al. 2009), cucumber (Cucumis sativus)(Voogt et al. 2014), 54 carrot (Raphanus sativus L.) (Hong et al. 2008), celery (Graveolens L. var. dulce DC)(Hong et 55 al. 2009), radish (Raphanus sativus L.)(Hong et al. 2009; Lawson et al. 2015), potato (Solanum 56 tuberosum)(Caffagni et al. 2011), rice (Oryzasativa L.)(Kato et al. 2013), barley (Hordeum 57 vulgare), wheat (Triticum aestivum), ryegrass (Lolium perenne), buckwheat (Fagopyrum 58 esculentum), flax (Linum usitatissimum), tobacco (Nicotiana tabacum)(Hong et al. 2007; Hong 59 et al. 2009; Umaly & Poel 1971; Xie et al. 2007; Yu et al. 2011)
60 On basis of these the experimental results, the following statements were established:
61 low amounts of iodine can be beneficial for plant growth. Positive effect have been observed 62 e.g. in barley, ryegrass, tomato, buckwheat, flax, strawberry, tobacco(Hong et al. 2007; Hong 63 et al. 2009; Umaly & Poel 1971; Xie et al. 2007; Yu et al. 2011). However, over a certain 64 threshold concentration, iodine becomes toxic, resulting in reduced biomass production(Herret 65 et al. 1962; Hong et al. 2009; Kiferele 2013; Weng et al. 2008)
66 the iodide effect on plant growth is more detrimental than the effect of iodate. This 67 phenomenon can be attributed to the greater uptake of iodide than iodate(Blasco et al.
68 2008)
69 iodine concentrations in plants decrease from root to leaf, stem and fruit, being iodine 70 transport mainly xylematic (Hong et al. 2009; Li et al. 2016;; Weng et al. 2008).
71 Although a phloematic way has also been described in case of lettuce and tomato.
72 (Landini et al. 2011; Smoleń et al. 2014)
73 due to their accumulation capacity the leafy vegetables such as lettuce (Blasco et al.
74 2008; Blasco et al. 2012; Hong et al. 2008; Lawson et al. 2015; Voogt et al. 2010), 75 spinach (Dai et al. 2006; Weng et al. 2008; Zhu et al. 2003; Zhu et al. 2004), Chinese
76 cabbage (Hong et al. 2008) are the best candidates for biofortification with iodine. It 77 should be mentioned, however, that some fruit or tuber vegetables (strawberry, tomato, 78 potato) (Caffagni et al. 2011; Landini et al. 2011; Li et al. 2016) can also store iodine in
79 higher amount.
80
81 Summarizing the observations and published data it can be established, that the role of physico- 82 chemical properties of soils has not been deeply studied and evaluated for biofortification of 83 crops with iodine. It is well known that the highest iodine contents were found in soils rich in 84 organic content, however, considerable part of arable land has sandy soil with low organic 85 content (<1%) and low water retention ability (Whitehead 1984). Therefore it is necessary to 86 clarify the applicability of irrigation with iodine containing water in case of different plants- 87 sandy soil systems for biofortification of vegetables with iodine.
88 To study the uptake and translocation of iodine and essential elements in different plants and 89 their distribution among the plant parts (root, stem, leaf, fruit) mono- or multielemental 90 analytical methods can be applied. However, monoelemental techniques such as iodiometric 91 titration(Rana & Raghuvashi 2013), colorimetric analyses via Sandell-Koldhoff reaction(Li et 92 al. 2016), or spectrophotometry using ferric-tiocyanate-nitric acid catalytic method (Hong et al 93 2008; Hong et al 2009) offer only restricted information on plant physiological processes 94 mentioned above. Using neutron activation analyses (Dai et al. 2006; Zhu et al. 2003;) 95 inductively coupled plasma atomic emission spectrometry (ICP-AES) (Blasco et al. 2012;
96 Caffagni et al. 2011; Kapusta et al. 2017;) or inductively coupled plasma mass spectrometry 97 (ICP-MS) (Landini et al. 2011; Lawson et al. 2015; Kato et al. 2013; Voogt et al. 2014), the 98 obtained multielemental information help us to find the most favorable concentration range of 99 added iodine for its efficient biofortification in the edible plant parts and simultaneously 100 minimizing the loss of essential elements and biomass reduction.
101 In this paper the uptake and translocation of iodine in a leafy vegetable lettuce (Lactuca sativa) 102 and a fruit vegetable, green bean (Phaseolus vulgaris L.) were studied in framework of pot 103 experiments applying a calcareous sandy soil-plant system. The KI containing irrigation water 104 with iodine concentration of 0.10, 0.25 and 0.50 mg/L was led to the soil surface. The iodine 105 concentration of different plant parts and the iodine distribution within the plants were 106 investigated by ICP-MS following their MW-assisted acid digestion. In addition to these 107 measurements, the iodine effect on the plant growth, the morphological and anatomical 108 parameters of plants as well as the uptake and translocation of essential elements (P, Mg, Mn, 109 Fe,Cu, Zn, K, B) were also studied.
110 2. MATERIALS AND METHODS 111
112 2.1. Chemicals
113 All chemicals used during the experiments were of analytical grade. The ultra-pure water 114 (resistivity: 18 MΩ cm-1) was taken from an ELGA Ultra Purelab unit (ELGA LabWater/VWS 115 Ltd., High Wycombe, UK). For quantitative determination of iodine, standard solution was 116 prepared using solid KIO3 (Sigma Aldrich Ltd., Hungary), and for analyses of P, Mg, Mn, Fe, 117 Cu and Zn an ICP-MS multi-element standard solution (110580 Merck Ltd., Hungary) was 118 applied. To check the accuracy of the analytical method the NIST 1573a Tomato leaf (National 119 Institute of Standards and Technology, Gaithersburg, MD) certified reference material was 120 analysed.
121
122 2.2. Characterization of soil
123 The pH was measured according to the Hungarian Standard (MSZ-08-0206/2:1978)in 1:2.5 124 soil:water suspension after mixing for 12 hours. The CaCO3 content was measured using the 125 Scheibler gas-volumetric method (MSZ-08-0206/2:1978). The organic matter (OM) content 126 was determined using the modified Walkley-Black method (MSZ-08-0452:1980). Plant- 127 available P and K concentrations were determined after extraction with ammonium-acetate 128 lactate (AL-P2O5 and AL-K2O) (Egnér et al. 1960). The total N content was measured by the 129 Kjeldahl method (ISO 11261:1995). The NH4-N and NO3-N concentrations were measured 130 from KCl extracts according to the Hungarian Standard (MSZ 20135:1999).
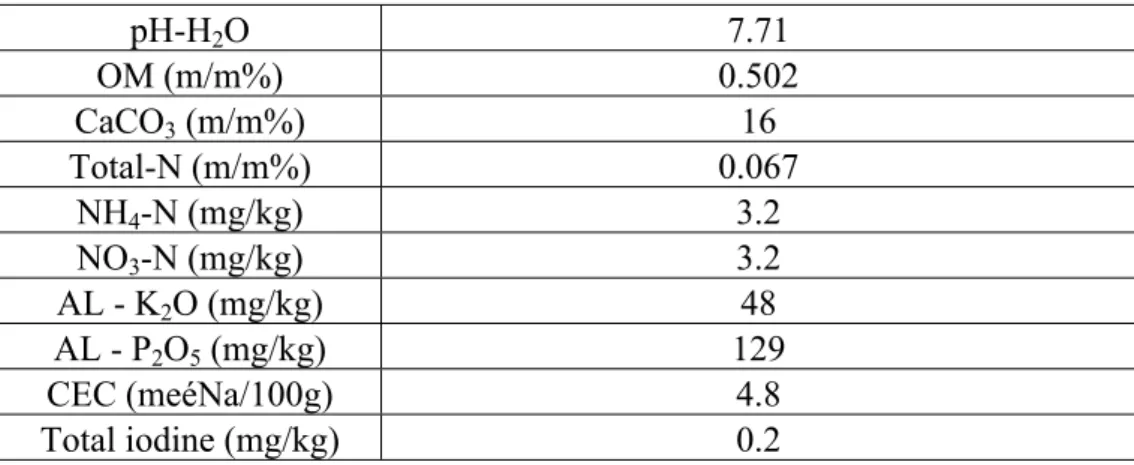
131 The cation exchange capacity (CEC) values were measured applying the modified method of 132 Mehlich (MSZ-08-0215:1978)43. The iodine concentrations were determined by ICP-MS 133 following microwave assisted aqua regia extraction (Table 1).
134
135 2.3. Plant material and treatments
136 Pot experiments were carried out in a climatic chamber at controlled temperature and light 137 conditions (25-27 °C/17 °C for day/night and 16 h lighting at 500 μmol/m2/s photon flux 138 density). Cylindrical, transparent rhizoboxes were filled with calcareous sandy soil (0.87 139 L/1000 g) and watered until 60 % of field capacity. The transparent plastic walls of the pots 140 were appropriate to follow root growth of seedlings in the first weeks.
141
142 2.4 Plant growing
143 A pregerminated bean (Phaseolus vulgaris L., variety: Golden Goal) seed were planted in each 144 rhizobox. Pots were weighed (±1 g) and irrigated with tap water three times a week to maintain 145 the water status of soil (60 % of field capacity). Irrigation was supplemented by modified 146 nutrient Hoagland solution (Table 2.) and KI solution (0.00, 0.10, 0.25 and 0.50 mg/L), from 147 the third week. The same amount of nutrients and KI solution were added to each pot. The total 148 added volume of Hoagland solution was 760 ml per plant during the whole plant growth period 149 (180 ml, 520 ml, 760 ml until the end of first (2-3 trifoliolate leaves of plants [Vn]), second 150 (flowering [R1]) and third (pods 2-3 inches long [R4]) developmental stage respectively), while 151 the added KI solution was 2.31L (0.18 L, 1.16 L, 2.31 L until the end of first, second and third 152 stage respectively). A random experimental design was applied with Three pregerminated 153 lettuce (Lactuca sativa L., variety: “Mályus királya”) seeds were planted in each rhizobox.
154 Plants were thinned to 1 plant per pot after 1 week. Irrigation process was the same as in case 155 of bean plants. The total added amount of Hoagland solution was 780 ml per plant during the 156 whole plant growth period (500 ml and 780 ml until the end of the first and the second stage 157 respectively), while the added KI solution was 0.92 L (0.46 L, 0.92 L until the end of first (7-8 158 leaves) and the second (head development) stage respectively). A random experiment design 159 was applied with 10 parallel plants in all treatments (5 pots harvested at the end of all stages).
160 2.5. Sample preparation and elemental analysis of plants
161 At the end of different phenophases, the plants were harvested and cleaned with deionized 162 water, then the root, stem, leaf and fruit parts of the green bean, and the root and leaves of 163 lettuce were separated. Samples were dried in laboratory oven at 40°C for two days to achieve 164 a constant weight, after that the dry mass of different plant organs were measured. The dried 165 and homogenized samples were mineralized applying a microwave-assisted acid digestion 166 system (TopWave, Analytik Jena, Germany). Twelve PTFE vessels were used, one for the 167 blank, and eleven for the samples. Blank analysis was carried out every time. 100-500 mg dried 168 samples were digested in a mixture of 7 cm3 67% HNO3 and 3 cm3 30% H2O2 using the MW- 169 heating program detailed in Table 3. After digestion the internal standards were added to the 170 solutions and filled up to 15 cm3 with deionized water. The concentration of iodine, macro and 171 micro nutrients were determined by inductively-coupled plasma mass spectrometer (Plasma 172 Quant MS Elite, Analytik Jena, Germany). The operating conditions of the ICP-MS are listed 173 in Table 4. The recovery values for the investigated nine elements changed between 90 and 174 111% analyzing the NIST Tomato leaf CRM sample (Table 5).
175
176 2.6 Morphological and anatomical measurements
177 Morphological and anatomical investigations were performed on the plant grown under control 178 conditions or treated with irrigation water containing iodide in concentration of 0.50 mg/L. For 179 all plants, the total leaf biomass and the total leaf number were determined. Leaf widths and 180 lengths and the anatomical features of the mesophyll were measured in the oldest leaves of 181 lettuce and in the terminal leaflets of the oldest leaves of green bean plants. Cross sections were 182 taken from the middle part of each leaf or leaflet. Plant materials were embedded with polar 183 resin (Historesin, Leica Biosystems) and sections were made by Leica microtome RM2265 184 (Leica Microsystems) equipped with a glass knife. After computerization by means of Olympus
185 BX43 light microscope and Canon EOS 1200D digital camera, the following mesophyll 186 characteristics were measured: total thickness of mesophyll; total thickness at the midrib;
187 thicknesses of parenchyma, spongy and palisade mesophyll layers; area of the main vascular 188 bundle and area of xylem(Rashband et al. 2012)(Fig. 1).
189
190 2.7. Statistical analysis
191 Statistical differences between iodine concentrations of the control and treated plant parts were 192 determined by one-way analysis of variance (ANOVA) and Tukey’s test at a significance level 193 of 0.05 using R 3.5.3 and RStudio 1.1.463 (R Core Team 2019, R Studio Team 2015) 194 Morphological and anatomical data were analyzed by standardized Principal Components 195 Analysis (PCA)using SYN-TAX 2000 computer program package (Podani 2001).
196 3. RESULTS AND DISCUSSION 197
198 3.1. Effect of iodide on the growth of green bean and lettuce plants
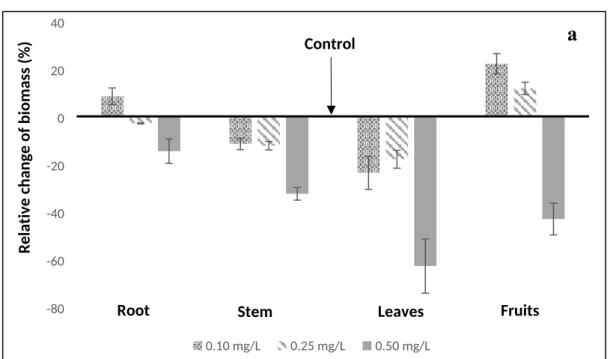
199 In the first and second phenophase of green bean plants the addition of iodide to the irrigation 200 water in concentration of 0.10-0.50 mg/L practically had no influence on the dry mass of leaves 201 and stems, furthermore the mass distribution among the plant parts changed only within a small 202 range. The dry mass of aerial parts for both the control and the treated plants amounted to about 203 60-64% and 67-71% of the total mass in the first and second phenophase, respectively. It means 204 there were only moderate observable differences in the mass distributions. However, in the third 205 phenophase the development of fruits resulted in considerable changes in the mass of green 206 bean plant parts related to the control plants (Fig. 2/a) and the inhibitory effect of iodide was 207 well detectable. The mass ratio of aerial parts of green bean plants increased to 77% for the 208 control and 73-75% for the plants irrigated with iodide containing water having concentration 209 of 0.10 and 0.25 mg/L. At iodide concentration of 0.5 mg/L the mass of all plant parts decreased 210 and the mass ratios shifted to the roots and stems. Considering this reduced biomass production, 211 it is recommended to irrigate bean plants cultivated on calcareous sandy soil with water 212 containing iodide in concentration less than 0.50 mg/L to avoid the reduction of plant growth.
213 In case of lettuce plants the presence of iodide in the irrigation water resulted in a lower root 214 and higher leaf-mass production (Table 6). However, it should be mentioned, that the increment 215 of leaf-mass values at iodide concentration of 0.50 mg/L decreased considerably to the level of 216 control plants (Fig. 2/b).
217 When comparing the effect of iodide concentration on the growth of bean and lettuce plants a 218 similar phenomenon can be observed. At concentration of 0.10 and 0.25 mg/L the iodine has a 219 stimulating effect on the growth, while at concentration of 0.50 mg/L an inhibitory effect with 220 different degrees can be observed. A moderate stimulating effect of iodine on the lettuce growth
221 was also observed by Hong et al (2008) but some other authors did not find significant 222 differences in biomass production applying iodine containing fertilizers(Lawson et al. 2015;
223 Smoleń et al. 2011). These different observations can be traced back to the deviations of the 224 experimental and environmental conditions.
225
226 3.2. Uptake and translocation of iodine
227 The iodine concentration of the various plant parts (root, leaves, stem and fruits) was 228 determined immediately after the harvest. The iodine content increased in all plant tissues of 229 both plants by increasing iodide concentration of the irrigation water. (Fig. 3/a,b)
230 Based on the dry mass and iodine concentration values of different plant parts, the distribution 231 of iodine among the plant parts were calculated (Table 7). In case of green bean plants the 232 iodine was accumulated first of all in the roots. For example in iodide treated green bean plants 233 83-87% of iodine accumulated in the roots and only 1.0% was translocated to the fruits. The 234 leafy vegetable lettuce showed a different picture. In the root of lettuce plants a lower amount 235 (42-56%) of iodine was accumulated than in the green bean plants and 44-58% of iodine was 236 translocated to the leaves.
237 The highest iodine concentrations in the green bean fruit (1.8 mg/kg) and in the lettuce leaves 238 (5.6 mg/kg) were achieved at 0.50 mg/L iodide concentration of the irrigation water, however, 239 as it was described in subchapter 3.1, the biomass production was hampered at this iodine 240 concentration. Therefore, 0.25 mg/L iodide concentration can be recommended for 241 biofortification, where the plant growth was moderately stimulated and the iodine concentration 242 in bean fruits and lettuce leaves amounted to 0.6 mg/kg and 5.2 mg/kg, respectively.
243 It should be mentioned, that in the literature there is not experimental data for green bean plants, 244 however, the uptake and translocation of iodine was widely studied in lettuce under different 245 environmental conditions and fertilization technologies. In lettuce leaves the iodine
246 concentrations changed in the range of 3-30, 5-40, 12-18 and 12-54 mg/kg DW (Voogt et al.
247 2010; Hong et al. 2008; Smoleń et al. 2011)cultivated the plants in greenhouse or in field trials 248 applying different fertilization technologies. It means that in lettuce leaves even ten times higher 249 iodine concentration can be achieved compared to our results. However it is necessary to find 250 an equally favorable solution for all, the biomass production the iodine content and the chemical 251 load of soil and groundwater.
252
253 3.3 Effect of iodine on the essential element transport
254 The relative concentration changes of some macro and micro nutrients in the edible parts of 255 green bean and lettuce plants related to the control plants are listed in Table 8. It can be seen, 256 that the concentration changes caused by iodide addition are much higher in case of lettuce 257 leaves, than in the green bean fruits. At iodide concentration of 0.10 and 0.25 mg/L where the 258 lettuce growth was stimulated, the concentration of macro and micro nutrients increased nearly 259 to the same extent. At iodide concentration of 0.50 mg/L where the lettuce growth was slightly 260 inhibited the P and Zn concentration further increased, while the concentration of Mg, Mn, Fe 261 decreased to a lower level. It is should be noted, that the Cu concentration was practically not 262 influenced by the increasing iodide concentration.
263 In case of green bean fruits at iodide concentration of 0.10 mg/L only a moderate reduction of 264 Mg, Mn, Fe, P, and Zn concentrations was observed in spite of the fact that the plant growth 265 was considerably stimulated. Increasing iodide concentration resulted in a continuous 266 increment of element content for these macro and micronutrients, however, the Fe translocation 267 became extremely high at the iodide concentration of 0.50 mg/L, where the plant growth was 268 significantly inhibited. Similarly to the lettuce leaves the concentration of Cu in the green bean 269 fruit was not influenced by the iodide treatment.
270
271 3.4 Evaluation of morphological and anatomical measurements
272 The experimental data obtained by morphological and anatomical investigations of plant leaves 273 were evaluated applying PCA method (Fig. 4-5). In case of green bean, all of the investigated 274 characteristics (total leaf biomass; the number, length and width of leaves; thickness and area 275 of mesophyll tissues) gained the greatest value in control plants (Fig. 4). This separation was 276 less strong in case of lettuce leaves. Although the leaf thickness and the majority of mesophyll 277 tissues were the largest in plants grown in control conditions, the total leaf number was the 278 highest in plants treated with irrigation water containing iodide in concentration of 0.50 mg/L.
279 Furthermore, the total leaf biomass, as well as the length and width of leaves did not differ 280 significantly compared the control and treated plants (Fig. 5).
281 As a result of iodide treatment, the biomass and the number and size of the green bean leaves 282 decreased. When lettuce plants were irrigated with 0.50 mg/L iodide containing water, the size 283 of leaves decreased, but the number of leaves increased. As a results, the total leaf biomass of 284 the control and treated lettuce plants remained practically the same (Fig. 2/b).
285 CONCLUSION 286
287 Addition of iodide in the concentration of 0.25 mg/L to the irrigation water resulted in a 288 stimulated growth of green bean and lettuce plants cultivated in calcareous sandy soil. In case 289 of leafy vegetable the uptake and translocation of micro and macronutrients were also 290 stimulated (e.g. Zn +26% and Fe +215%) at this iodine concentration, while in the green bean 291 fruit only moderate concentration changes (e.g. P -13% and Mg +8%) were measured.
292 Considering the iodine content (5.2 mg/kg DW) and water concentration (81%) of the fresh 293 lettuce leaves, eating 100 g of this fresh vegetable about 66% of the recommended daily intake 294 (150 μg) would be covered for adults. Due to the low translocation from the root to the green 295 bean fruits (root/fruit concentration ratio=76) this plant is not suitable for biofortification with 296 iodine. The addition of iodide to the irrigation water seems to be a realistic way to increase the 297 iodine intake for humans, however it is necessary to check what is the long term effect of iodine 298 on the biological organisms (nematodes, worms, bacteria, etc.) of soils.
299
300 Figure captions 301
302 Fig. 1 Investigated tissue features in a green bean leaflet (A) and a lettuce leaf (B, C).
303 A5, C5: total mesophyll thickness; A6, C7: palisade mesophyll layer; A7, C6: spongy 304 mesophyll layer; A8, B8: total thickness at the midrib; A9-10, B9, 11-12: parenchyma layer;
305 A11: rib hight; B10: schizogenous intercellular space; A12, B13: total area of the main vascular 306 bundle; A13, B14: area of the xylem. The numbering refers to variables in Fig. 3-4.
307
308 Fig. 2 Effects of iodine concentrations of the irrigation water on the dry biomass production of 309 green bean (a) and lettuce (b) plant parts related to the control plants
310
311 Fig Iodine concentration in different parts of green bean (a) and lettuce (b) plants. Different 312 letters indicate significant difference (p < 0.05, Tukey's test).
313
314 Fig. 4 PCA ordination of green bean leaves based on the morphological and anatomical 315 measurements. Objects enclosed by polygons are green bean leaves grown in control conditions 316 (b_c) or treated by irrigation water with the iodide concentration 0.50 mg/L (b_0.5). Variables 317 are 1) total leaf biomass; 2) number of leaves; 3-5) length, width and thickness of terminal 318 leaflet; 6-13) anatomical features of leaflet mesophyll (for details, see Fig.1.A).
319
320 Fig. 5 PCA ordination of lettuce leaves based on the morphological and anatomical 321 measurements. Objects enclosed polygons are lettuce leaves grown in control conditions (l_c) 322 or treated by irrigation water with the iodide concentration 0.50 mg/L (l_0.5). Variables are 1) 323 total leaf biomass; 2) number of leaves; 3-5) length, width and thickness of leaf; 6-14) 324 anatomical features of leaf mesophyll (for details, see Fig.1.B-C).
325 Table captions:
326
327 Table 1. Major physical-chemical properties of the calcareous sandy soil 328
329 Table 2. Macro- and micro element concentrations in the modified Hoagland-solution 330
331 Table 3. Microwave-assisted acid digestion program for mineralization of plant samples 332
333 Table 4. Operating conditions of the ICP-MS 334
335 Table 5. Certified and measured concentration values of the tomato leaf CRM and the 336 recoveries obtained by ICP/MS
337
338 Table 6. Effects of iodine concentrations of the irrigation water on the distribution of biomass 339 among the plant parts of green bean and lettuce plants in percent (n=5)
340
341 Table 7. Effects of iodine concentrations of the irrigation water on the distribution of iodine 342 among the plant parts of bean and lettuce plants in percent (n=5)
343
344 Table 8. Relative concentration changes (%) of some macro and micro nutrients in the edible 345 part of green bean (A) and lettuce (B) related to the control samples (RSD%)
346 ACKNOWLDGEMENT 347
348 This research was supported by the National research development and Innovation Office 349 (Grant No. NVKP16-1-2016-0044).
350 REFERENCES 351
352 Andersson, M., Benoist, B., Darnton-Hill, I., Delange, F. (2007). Iodine deficiency in Europe - 353 World Health Organization. WHO UNICEF report.
354
355 Azizi, F. (2007). Iodized Oil: Its Role in the Management of Iodine Deficiency Disorders.
356 International Journal Endocrinology and Metabolism, 2, 91–98.
357
358 Blasco, B., Rios, J. J., Cervilla, L. M., Sánchez-Rodrigez, E., Ruiz, J. M., Romero, L. (2008).
359 Iodine biofortification and antioxidant capacity of lettuce: potential benefits for cultivation and 360 human health. Annals of Applied Biology, 152, 289–299.
361
362 Blasco, B., Ríos, J. J., Sánchez-Rodríguez, E., Rubio-Wilhelmi, M. M., Leyva, R., Romero, L., 363 Ruiz, M. J. (2012). Study of the interactions between iodine and mineral nutrients in lettuce 364 plants. Journal of Plant Nutrition, 35, 1958–1969.
365
366 Caffagni, A., Arru, L., Meriggi, P., Milc, J., Perata, P., Pecchioni, N. (2011). Iodine 367 Fortification Plant Screening Process and Accumulation in Tomato Fruits and Potato Tubers.
368 Communications in Soil Science and Plant Analysis, 42, 706–718.
369
370 Dai, J. L., Zhu, Y. G., Huang, Y. Z., Zhang, M., Song, J. L. (2006). Availability of iodide and 371 iodate to spinach (Spinacia oleracea L.) in relation to total iodine in soil solution. Plant and 372 Soil, 289, 301–308.
373
374 Delange, F. (2002). Iodine deficiency in Europe anno 2002. Thyroid, 5, 3–18.
375 Denage, F., Bürgi, H., Chen, Z. P., Dunn, J. T. (2002). World status of monitoring iodine 376 deficiency disorders control programs. Thyroid, 12, 915–924.
377
378 Egnér, H., Riehm, H., Domingo, W. R. (1960). Investigations on chemical soil analysis as the 379 basis for estimating soil fertility. II. Chemical extraction methods for phosphorus and potassium 380 determination. Kungl Land. Annaler, 26, 199–215.
381
382 Gonzali, S., Kiferle, C., Perata, P. (2017). Iodine biofortification of crops: agronomic 383 biofortification, metabolic engineering and iodine bioavailability. Current Opinion in 384 Biotechnology, 44, 16–26.
385
386 Herrett, R. A., Hatfield, H. H., Crosby, D. G., Vlitos, A. J. (1962). Leaf abscission induced by 387 the iodide ion. Plant Physiology, 37, 358–363.
388
389 Hong, C. L., Weng, H. X., Qin, Y. C., Yan, A. L., Islam, E. (2009). The fate of exogenous 390 iodine in pot soil cultivated with vegetables. Environmental Geochemistry and Health, 31, 99–
391 108.
392
393 Hong, C. L., Weng, H. X., Yan, A. L., Xie, L. L. (2007). Characteristics of iodine uptake and 394 accumulation by vegetables. Chinese Journal of Applied Ecology, 18, 2313–2318.
395
396 Hong, C., Weng, H., Yan, A., Islam, E. (2009). The fate of exogenous iodine in pot soil 397 cultivated with vegetables. Environmental Geochemistry and Health, 31, 99–108.
398
399 Hong, C. L., Weng, H. X., Yan, A. L., Xie, L. L. (2009). Dynamic characterization of iodine 400 uptake in vegetable plants. Acta Ecologica Sinica, 29, 1438–1447.
401
402 Hong, C. L., Weng, H. X., Qin, Y. C., Yan, A. L., Xie, L. L. (2008). Transfer of iodine from 403 soil to vegetables by applying exogenous iodine. Agronomy for Sustainable Development, 28, 404 575–583.
405
406 ISO 11261:1995 (1995). Soil quality - Determination of total nitrogen - Modified Kjeldahl 407 method.
408
409 Kato, S., Wachi, T., Yoshihira, K., Nakagawa, T., Ishikawa, A., Takagi, D., Tezuka, A., 410 Yoshida, H., Yoshida, S., Sekimoto, H., Takahashi, M. (2013). Rice (Oryza sativa L.) roots 411 have iodate reduction activity in response to iodine. Frontiers in Plant Science, 4, 1–11.
412
413 Kapusta-Duch, J., Bieżanowska-Kopeć, R., Smoleń, S., Pysz1, M., Kopeć, A., Piątkowska, E., 414 Rakoczy, R., Koronowicz, A., Skoczylas, L., Leszczyńska, T. (2017). The effect of preliminary 415 processing and different methods of cooking on the iodine content and selected antioxidative 416 properties of carrot (Daucus carota L.) biofortified with (potassium) iodine. Folia 417 Horticulturae, 29, 11–24.
418
419 Kiferle, C., Gonzali, S., Holwerda, H. T., Ibaceta, R. R., Perata, P. (2013). Tomato fruits: a 420 good target for iodine biofortification. Frontiers in Plant Science, 4, 1–10.
421
422 Landini, M., Gonzali, S., Perata, P. (2011). Iodine biofortification in tomato. Journal of Plant 423 Nutrition and Soil Science, 174, 480–486.
424 Lawson, P. G., Daum, D., Czauderna, R., Meuser, H., Härtling, J. W. (2015). Soil versus foliar 425 iodine fertilization as a biofortification strategy for field-grown vegetables. Frontiers in Plant 426 Science, 6, 1–11.
427
428 Li, R., Liu, H. P., Hong, C. L., Dai, Z. X., Liu, J. W., Zhou, J., Hua, C. Q., Wenga, H. X. (2016).
429 Iodide and iodate effects on the growth and fruit quality of strawberry. Journal of the Science 430 of Food and Agriculture, 1, 231–235.
431
432 MSZ-08-0206/2:1978 (1978). Evaluation of some chemical properties of the soil. Laboratory 433 tests (pH value, phenolphtalein alkalinity expressed in soda, total water soluble salt content, 434 hydrolytic (y1 value) and exchangeable acidity (y2 value). Hungarian Standard Association 435 Budapest, Hungary.
436
437 MSZ-08-0452:1980 (1980). Use of high-capacity analyser systems for soils analyses.
438 Quantitative determination of the organic carbon content of the soil on Contiflo analyzer 439 system. Hungarian Standard Association Budapest, Hungary.
440
441 MSZ 20135:1999 (1999). Determination of the soluble nutrient element content of the soil.
442 Hungarian Standard Association Budapest, Hungary.
443 MSZ-08-0215:1978 (1978). Determination of the Cation Adsorption Capacity of the Soil.
444 Modified Mechlich Technique. Hungarian Standard Association Budapest, Hungary.
445
446 Podani, J. (2001). SYN-TAX 2000 Computer Programs for Data Analysis in Ecology and 447 Systematics. User’s Manual. Scientia, Budapest.
448
449 Rana, R., Raghuvanshi, R. S. (2013). Effect of different cooking methods on iodine losses.
450 Journal of Food Science and Technology, 50, 1212–1216.
451
452 Rasband, W. S. (2012). ImageJ, U.S. National Institutes of Health, Bethesda, Maryland, USA, 453 imagej.nih.gov/ij/, 1997—2012.
454
455 R Core Team (2019) R. A language and environment for statistical computing. R Foundation 456 for Statistical Computing, Vienna, Austria.
457
458 RStudio Team (2015) RStudio. Integrated Development for R. RStudio, Inc. Boston, MA.
459 Smoleń, S., Ledwożyw-Smoleń, I., Rożek, S., Strzetelski, P. (2011). Preliminary evaluation of 460 the influence of soil fertilization and foliar nutrition with iodine on the efficiency of iodine 461 biofortification and chemical composition of lettuce. Journal of Elementology, 16, 275–285.
462
463 Smoleń, S., Kowalska, I., Sady, W. (2014). Assessment of biofortification with iodine and 464 selenium of lettuce cultivated in the NFT hydroponic system. Scientia Horticulturae, 166, 9–
465 16.
466
467 Umaly, R. C., Poel, L. W. (1971). Effects of iodine in various formulations on the growth of 468 barley and pea plants in nutrient solution culture. Annals of Botany, 35, 127–131.
469
470 Voogt, W., Steenhuizen, J., Eveleens, B. (2014). Uptake and distribution of iodine in cucumber, 471 sweet pepper, round, and cherry tomato. Wageningen UR Greenhouse Horticulture, Reports 472 Wageningen UR Greenhouse Horiculture, 1329, 1–72.
473
474 Voogt, W., Holwerda, H. T., Khodabaks, R. (2010). Biofortification of lettuce (Lactuca sativa 475 L.) with iodine: the effect of iodine form and concentration in the nutrient solution on growth, 476 development and iodine uptake of lettuce grown in water culture. Journal of the Science of 477 Food and Agriculture, 90, 906–913.
478
479 Weng, H. X., Yan, A. L., Hong, C. L., Xie, L. L., Qin, Y. C., Cheng, C. Q. (2008). Uptake of 480 Different Species of Iodine by Water Spinach and Its Effect to Growth. Biological Trace 481 Element Research, 125, 184–194.
482
483 Weng, H., Weng, J., Yan, A., Hong, C., Yong, W., Qin, Y. (2008). Increment of iodine content 484 in vegetable plants by applying iodized fertilizer and the residual characteristics of iodine in 485 soil. Biological Trace Element Research, 123, 218–228.
486
487 Weng, H. X., Hong, C. L., Yan, A. L., Pan, L. H., Qin, Y. C., Bao, L. T., Xie, L. L. (2008).
488 Mechanism of Iodine Uptake by Cabbage: Effects of Iodine Species and Where It is Stored.
489 Biological Trace Element Research, 125, 59–71.
490
491 Whitehead, D. C. (1984). The distribution and transformation of iodine in the environment.
492 Environment International, 10, 321–339.
493
494 WHO/FAO (2004). Vitamin and mineral requirements in human nutrition: joint FAO/WHO 495 Expert Consultation in Human Vitamin and Mineral Requirements 2nd ed. Genova.
496
497 Wolff, J. (2001). Physiology and pharmacology of iodized oil in goiter prophylaxis. Medicine, 498 80, 20–36.
499 Xie, L. L.,Weng, H. X., Hong, C. L., Yan, A. L. (2007). Iodine uptake by bok-choy and Ipomoea 500 aquatica Forsk. Plant Nutrition and Fertilizer Science, 13, 123–128.
501
502 Yu, W. J., Yao, Y., Wei, H. M., Long, M., Hand Tang, X. F. (2011). Absorption of exogenous 503 iodine in rhizosphere and its effects on physiological parameters of cherry tomato plants.
504 Guihaia, 31, 513–519.
505
506 Zhu, Y. G., Huang, Y. Z., Hu, Y., Liu, Y. X. (2003). Iodine uptake by spinach (Spinacia 507 oleracea L.) plants grown in solution culture: effects of iodine species and solution 508 concentrations. Environment International, 29, 33–37.
509
510 Zhu, Y. G., Huang, Y., Hu, Y., Liu, Y., Christie, P. (2004). Interactions between selenium and 511 iodine uptake by spinach (Spinacia oleracea L.) in solution culture. Plant and Soil, 261, 99–
512 105.
Fig. 1
Fig. 2
-80 -60 -40 -20 0 20 40
0.10 mg/L 0.25 mg/L 0.50 mg/L
Relative change of biomass (%)
Root Stem Leaves Fruits
Control
-60 -50 -40 -30 -20 -10 0 10 20
0.10 mg/L 0.25 mg/L 0.50 mg/L
Relative change of biomas (%)
Root Leaf
Control
a
b
Root Leaf Stem Fruit 1
10 100 1000 10000 100000 1000000
Control 0.10 0.25 0.50
Iodine concetration in irrigation water (mg/L)
Io di ne con cent rat io n in pla nt ( µg/kg)
a b c d
a a a b
a a a
b
a a a b
Fig. 3
a
Root Leaf
0 2000 4000 6000 8000 10000 12000 14000 16000
Control 0.10
Iodine concetration in irrigation water (mg/L)
Io di ne con cent rat io n in pla nt ( µg/kg)
a
b b c
c
a a b
a
b b
b
Fig. 4
Fig. 5
Table 1
pH-H2O 7.71
OM (m/m%) 0.502
CaCO3 (m/m%) 16
Total-N (m/m%) 0.067
NH4-N (mg/kg) 3.2
NO3-N (mg/kg) 3.2
AL - K2O (mg/kg) 48
AL - P2O5 (mg/kg) 129
CEC (meéNa/100g) 4.8
Total iodine (mg/kg) 0.2
Table 2.
Macronutrients Micronutrients
Component Concentration
(mmol/L) Component Concentration (μmol/L)
KNO3 1.25 H3BO3 11.6
Ca(NO3)2 1.25 MnCl2∙4H2O 4.60
MgSO4 0.50 ZnSO4∙7H2O 0.19
KH2PO4 0.25 Na2MoO4∙2H2O 0.12 CuSO4∙5H2O 0.08
Fe-citrate 100
Table 3.
Temperature (°C) Ramp (min) Holding time (min)
90 10 10
160 5 10
200 5 10
Table 4.
Plasma power 1290 W
Outer gas (Ar) 7.5 L/min
Intermediate gas (Ar) 1.5 L/min Aerosol carrier gas (Ar) 1.0 L/min Reaction gas (He) 90 mL/min Reaction gas (H2) 110 mL/min
Sample uptake 0.30 mL/min
Nebulizer Meinhard
Spray chamber double pass
Sampler cone Ni. 1.1 mm orifice Skimmer cone Ni. 0.5 mm orifice
Analytical isotopes 11B;26Mg; 31P;39K; 55Mn; 56Fe; 63Cu;66Zn; 127I Internal standards 45Sc; 89Y;115In;159Tb
Data acquisition peak jumping
Dwell time 30 ms
Replicates 5x20
Table 5 .
Certified (mg/kg) Measured (mg/kg) Recovery (%)
I (0.85)* 0.93 ± 0.07 (110)
Mg (12000)* 10800 ± 200 (90)
P 2160 ± 40 2080 ± 60 96
Mn 246 ± 8 230 ± 2 94
Fe 368 ± 7 365 ± 14 99
Cu 4.70 ± 0.14 4.57 ± 0.13 97
Zn 30.9 ± 0.7 32.8 ± 0.3 106
K 27000 ± 500 25900 ± 200 97
B 33.3 ± 0.7 36.9 ± 0.4 111
*indicative values
Table 6
Root Leaves Stem Fruit
Iodide concentration
(mg/L) green
bean lettuce green
bean lettuce green bean green bean
Control 24±10 40±15 36±11 60±16 16±3 25±5
0.10 27±2 48±16 28±6 52±14 14±2 31±7
0.25 25±6 44±17 31±6 56±11 15±1 29±5
0.50 35±12 60±18 23±8 40±6 18±4 24±7
Table 7.
Root Leaves Stem Fruit
Iodide concentration
(mg/L) green
bean lettuce green
bean lettuce green bean green bean
Control 64±9 28±4 22±3 72±18 9±4 5±1
0.10 83±16 42±12 7±3 58±15 8±2 1±0.2
0.25 86±14 49±2 6±2 51±11 7±4 1±0.2
0.50 87±13 56±6 5±1 44±10 7±3 1±0.2
Table 8.
Relative concentration changes (%)
A 0.10 mg/L 0.25 mg/L 0.50 mg/L
Mg -3 (7) +8 (7) +27 (14)
P -27 (14) -13 (14) -11 (3)
Mn -26 (8) -1 (29) +8 (11)
Fe -4 (14) +3 (28) +210 (3)
Cu +8 (20) +6 (22) +7 (11)
Zn -14 (12) -4 (13) +24 (19)
K +2 (15) +170 (20) +128 (18)
B -24 (12) -18 (16) +4 (11)
Relative concentration changes (%)
B 0.10 mg/L 0.25 mg/L 0.50 mg/L
Mg +70 (32) +72 (26) +30 (7)
P +143 (14) +147 (15) +192 (26)
Mn +106 (21) +108 (22) +57 (6)
Fe +260 (24) +215 (30) +138 (33)
Cu +50 (37) +53 (28) +51 (33)
Zn +20 (18) +26 (19) +29 (37)
K +52 (21) +58 (18) + 68 (15)
B +9 (22) +12 (12) +5 (25)