Nanostructured micronized solid dispersion of crystalline-amorphous metronidazole embedded in amorphous polymer matrix prepared by nano spray drying Mirella Mirankó1, László Trif2, Judit Tóth1,2*, Tivadar Feczkó1,2
1 University of Pannonia, Faculty of Engineering, Research Institute of Biomolecular and Chemical Engineering, 8200 Veszprém, Egyetem u. 10., Hungary
2Research Centre for Natural Sciences, Institute of Materials and Environmental Chemistry, 1117 Budapest, Magyar tudósok körútja 2., Hungary, e-mail: toth@mukki.richem.hu, tel.:
+3688624032
* Corresponding author Abstract
In this study metronidazole drug was encapsulated by hydroxypropyl methylcellulose and polyvinylpyrrolidone polymers from solutions using nano spray drying technology. The influence of the process parameters and formulation variables were investigated on product morhology and structure, production yield and entrapment efficiency. The use of surface active admixtures (polyvinyl alcohol, Tween80 and Pluronic F68) increased the product yield substantially. The entrapped metronidazole was partially in crystalline and amorphous state in both amorphous polymers as confirmed by DSC and powder X-ray diffraction measurements.
In the composites with hydroxypropyl methylcellulose the degree of crystallinity was between 50.2 and 81.0 %, and with polyvinylpyrrolidone between 35.0 and 50.0 % (with respect to the drug content). Melting point decrease phenomena was observed by differential scanning calorimetry between bulk metronidazole and spray dried products. Peak broadening was indicated by powder X-ray diffraction measurements, which could be the result of formation of small drug crystallites. The TEM images showed beside the larger crystals (200 – 400 nm) a fraction of smaller crystals (20 – 50 nm in diameter), which are in good correlation with the
Manuscript Click here to view linked References
1 2 3 4 5 6 7 8 9 10 11 12 13 14 15 16 17 18 19 20 21 22 23 24 25 26 27 28 29 30 31 32 33 34 35 36 37 38 39 40 41 42 43 44 45 46 47 48 49 50 51 52 53 54 55 56 57 58 59 60
calculated coherent scattering domain sizes of 19 – 87 nm based on X-ray data. The drug- polymer composites produced by nano spray drying process were identified as crystalline- amorphous nanostructured micronized solid dispersions.
Keywords: nano spray dryer, solid dispersion, crystalline-amorphous nanocomposite, melting point decrease, peak broadening
1. Introduction
The spray drying process for producing powders from different fluids is well known with applications ranging from powdered milk to bulk chemicals and pharmaceuticals [1]. The use of spray drying in the pharmaceutical industry has several targets, for example manufacturing of active pharmaceutical ingredients, excipients and different solid formulations, microencapsulation, drying of heat sensitive materials and production of amorphous solid dispersions (ASD) and nanocomposites [2]. Drug nanocomposites are nano crystal based particulate systems in which the drug is usually dispersed in a polymeric matrix as a secondary phase in the form of nanocrystals [3]. Nanocomposites are often produced by one or more consecutive steps: 1) nanosuspensions preparation by high-pressure homogenization, wet media milling or nanoprecipitation, 2) drying of nanosuspension to obtain solid particles [4].
Spray drying is one of the process used for stabilization of nanosuspensions. Spray drying is a continuous process in which the drug and the excipients (stabilizers as polymers, polyelectrolites and surface active agent) are dissolved or suspended in a common solvent and the resulting solutions or nanosuspensions as well as emulsions are atomized into a drying chamber [5]. Generally, nanosuspension based drying results in nanocomposites, and solution based drying provides amorphous solid dispersion formation, although the process conditions and the composition of the suspension/solution affect the solidification process, i.e. the solid state of composite particles. Rahman et al. [6] prepared different composites with polymer
1 2 3 4 5 6 7 8 9 10 11 12 13 14 15 16 17 18 19 20 21 22 23 24 25 26 27 28 29 30 31 32 33 34 35 36 37 38 39 40 41 42 43 44 45 46 47 48 49 50 51 52 53 54 55 56 57 58 59 60 61
carriers (hydroxypropyl cellulose and Soluplus) of griseofulvin by spray drying. Spray drying process was in parallel carried out with nanosuspension and solution of gresofulvin using the same concentration of drug and excipients (polymers and surface active agent sodium dodecyl sulphate). The experiments resulted in ASD products as a consequence of solution based drying.
They found that the drying from nanosuspension produced partially amorphous products, so called hybrid nanocrystal–amorphous solid dispersions (HyNASDs). The amorphous part was increased by elevated polymer content and was dependent on the polymer type [6].
To produce nanoparticle by spray drying, the Nano Spray Dryer B-90 is an innovative equipment introduced to the market by Büchi Labortechnik AG [7, 8]. Comparing the main characteristics between conventional and nano spray dryer, some features are particularly relevant for expensive drug material formulations in the early development phase. The total yields in a traditional spray dryer is up to 50%–70%, at least 30 mL of the solution/suspension is required for a feasibility study. The forming particle size using ultrasonic nozzle is between 10-60 µm [5]. The nano spray dryer works with the two following unique features:
a) The droplets are generated through a piezoelectric driven actuator operating at a specific ultrasonic frequency. A perforated stainless steel membrane with micron-sized holes (4.0, 5.5 or 7.0 μm) is vibrated producing sprayed droplets with very narrow size distribution, and then submicron size products.
b) The submicron or micron sized particles are collected by an electrostatic collector on the electrode surface, from which the fine powder product can be removed using a rubber spatula.
In contrast to the common cyclone technology in which the particles smaller than 2 μm are typically not captured [9], this new technology enables the production of submicron- and nanosized particles from 300 nm and small amount of samples (from 2 ml liquid) even with 90
% yield.
1 2 3 4 5 6 7 8 9 10 11 12 13 14 15 16 17 18 19 20 21 22 23 24 25 26 27 28 29 30 31 32 33 34 35 36 37 38 39 40 41 42 43 44 45 46 47 48 49 50 51 52 53 54 55 56 57 58 59 60
The main process parameters of the nano spray dryer are the inlet gas temperature and flow rate, the spray membrane mesh size, the feeding rate (controlled by spraying % and pump rate) [7]. As formulation variables, the main properties of materials are the solvent and excipient type, concentration and composition of the solutions, solubility of the active ingredient and excipients. The particle size, morphology, solvent residue, solid state (crystallinity and amorphous phase), entrapment efficiency and yield can be controlled by these process parameters [10]. The structure and thus the stability and the biological activity of dried products can be altered by changing the process conditions and formulation variables (solution properties) [5, 7].
Metronidazole (MTZ), 2-(2-methyl-5-nitro-1H-imidazol-1-yl) as model drug and hydroxypropyl methylcellulose (HPMC) and polyvinylpyrrolidone (PVP) water soluble polymers were selected for spray drying experiments. The selected carrier polymers were significantly different in chemical structure and viscosity. MTZ is an active agent of the imidazole group drugs with wide range of bactericide effect [11]. Presently, MTZ is available in tablets, infusion and suppositories dosage forms [12]. Conventional spray drying process was used for preparing MTZ containing drugs for different administration routes [13-24].
Spray drying is an energy intensive process with a very short drying time, which facilitates the generation of ASDs. However, it is also a process with several adjustable parameters, which have a determinate impact on the product quality. Dependent on the process- (drying gas properties, feed rate, nozzle type) and formulation parameters (excipients, concentration, viscosity, surface tension) and the solidification characteristics of the components, different type of amorphous and/or crystalline solid dispersion can be obtained [25, 26]. Formation of a crystalline form of the active ingredient can be attributed to its high crystallization tendency.
MTZ exists in stable crystalline form [27], polymorphism has not been reported for the metronidazole base [28]. However, some authors reported partially amorphous products
1 2 3 4 5 6 7 8 9 10 11 12 13 14 15 16 17 18 19 20 21 22 23 24 25 26 27 28 29 30 31 32 33 34 35 36 37 38 39 40 41 42 43 44 45 46 47 48 49 50 51 52 53 54 55 56 57 58 59 60 61
obtained by spray drying. Noheman et al. [14] prepared floating MTZ containing microparticles using chitosan/HPMC/sodium bicarbonate in aqueous dispersion by a MSD 1.0 model mini spray dryer (LMLabmaq, Brazil). The particle size (according to the SEM images) was between 1-10 µm, entrapment efficiency 26-43 % depending on the composition of the solutions.
According to XRD pattern, the microparticles was in a semi-amorphous state, but the MTZ was crystalline. Lee et al. [15] prepared Arabinoxylan microspheres by spray drying and ionotropic gelation to retard the drug release of metronidazole. The drug loading was between 29.3 and 32.5 %, the obtained microspheres were aggregated with an individual particle size under 50 µm (according to SEM images). The X-ray diffraction pattern showed the MTZ peaks disappeared indicating the amorphous state of the drug. Oh et al. [24] microencapsulated MTZ in polyethylene glycol 3350 (PEG) using hydroxypropyl methylcellulose K15M as additive in spray congealing experiment carried out in Mobile Minor™ 2000 (GEA Niro, Denmark) apparatus. The author investigated the influence of K15M on the crystallinity of MTZ and together with other formulation additives on drug release. They found that spray-congealing with PEG reduced the crystallinity of MTZ and addition of K15M strengthened this effect. The authors stated that MTZ in the microparticles (size range 33-275 µm) existed in different solid state, as crystalline or amorphous particles, as well as a molecular dispersion dependent on the composition of the samples. The MTZ content was rather low under 10% in the experiments.
The amorphous or crystalline state of the drug and carrier and the arrangement, i.e. the structure of the dispersion are very important to understand the solubility and bioavailability of the spray- dried products. In the sited publications the amorphous state of MTZ in composites was reported but not in detail concerning the structure of the microparticles and the effect of process and formulation variables on the crystalline/amorphous state of the drug. Our aim was to study the nano spray drying products concerning the possible nanostructured composition and the effect of process parameters and formulation variables on the structure of MTZ–polymer solid
1 2 3 4 5 6 7 8 9 10 11 12 13 14 15 16 17 18 19 20 21 22 23 24 25 26 27 28 29 30 31 32 33 34 35 36 37 38 39 40 41 42 43 44 45 46 47 48 49 50 51 52 53 54 55 56 57 58 59 60
dispersions (nanocomposites, amorphous solid dispersion). Beside the amorphous or crystalline state of the active ingredient, particle size and morphology were also investigated to get information about the structure of the obtained micronized solid dispersions. The production yield and entrapment efficiency were determined from economic point of view.
2. Experimental
2.1. Materials
Metronidazole (Tm: 159–163 °C) [29] was a kind gift from Egis Pharmaceuticals PLC, Hungary. Hydroxypropyl methylcellulose (Methocel E5, Tg: 154 °C) [30] and polyvinylpirrolidone (Mw = 40,000, Tg: 168 °C) [30] were purchased from Colorcon Ltd and Alfa Aesar, respectively. Tween 80 was a product of Merck Schuchardt OHG. Pluronic F68 (Tg: 63.4°C and Tm: 54°C) [31] and polyvinyl alcohol (Mw = 30,000-70,000, Tg: 70°C) [32]
were delivered by Sigma-Aldrich Inc, Hungary.
2.2. Drying experiments
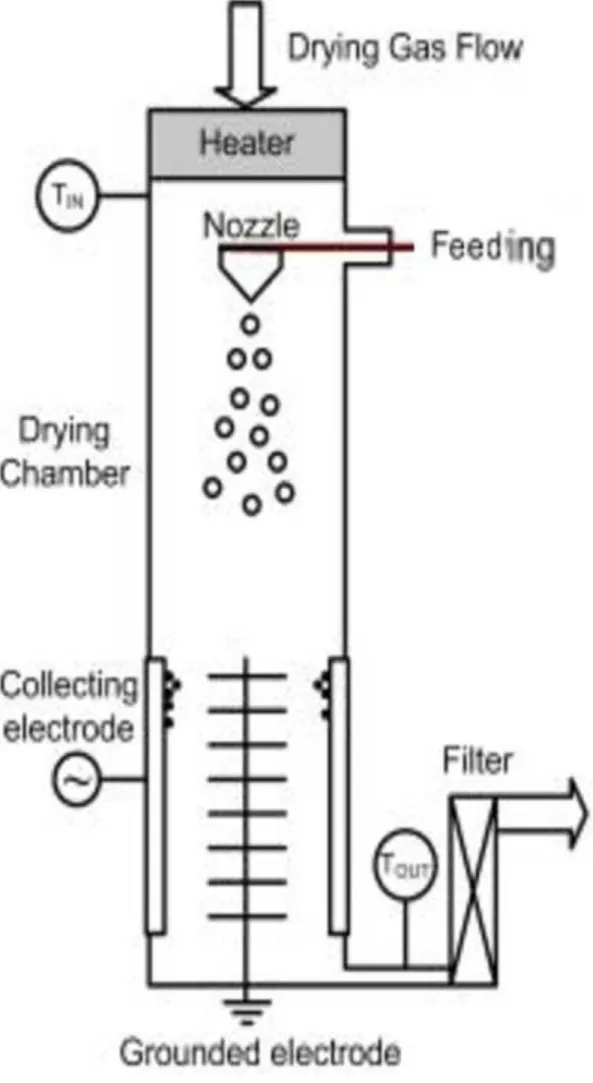
The drying experiments were carried out using a Nano Spray Dryer B-90 (Büchi Labortechnik AG, Flawil, Switzerland). The basic principle of the operation of the dryer is detailed elsewhere [33], the schematic setup can be seen in Fig. 1.
Briefly: The preheated gas enters on the top of the chamber. The solution, nanosuspension or nanoemulsion are pumped to the spray head where the ultrasonic driven atomization takes place via vibrating metal membrane providing ultrafine droplets of the liquid. The droplets solidify via solvent evaporation and the dried particles are collected by the electrostatic collector from the leaving gas.
The operation conditions were as follows: inlet temperature was 100, 110 or 120 °C, at a flow rate of 90, 100 or 120 L/min, and mesh of the membrane was 7 µm (except experiment M where
1 2 3 4 5 6 7 8 9 10 11 12 13 14 15 16 17 18 19 20 21 22 23 24 25 26 27 28 29 30 31 32 33 34 35 36 37 38 39 40 41 42 43 44 45 46 47 48 49 50 51 52 53 54 55 56 57 58 59 60 61
it was 5.5 µm), the recirculation pump rate was adjusted to 1. The spraying rate was not independent from the solution viscosity, surface tension, the drying temperature and flow rate of the air. Generally, its ratio was chosen for 30 % but in some cases, it had to be modified to reach stable drying conditions, i. e. atomization of the solution. The drying experiments were carried out in aqueous solutions using the tall set-up constructed for water based samples ensuring enough retention time for evaporation of water. For the experiments 100 ml of solutions were prepared as followed: the solid components and the MilliQ water were weighed on analytical scale and the solutions were prepared by magnetic stirring and used without filtering. The operation conditions, the composition of the solutions to be dried are summarized in Table 1.
2.3. Characterization of powders
Morphology
Surface morphology of the samples (M, MH1 and MH2) was examined by a Philips XL30 ESEM (Fei Company: Hillsboro, Oregon, USA) scanning electron microscope. The images were taken using 20 kV accelerating voltage after the samples were sputter coated with gold.
Samples MH3, MH4 and MPP1 were investigated with a FEI Thermofisher Apreo S (Thermo- Fisher Scientific, Waltham, Massachusetts, USA) scanning electron microscope. In this case, the samples were not gold coated and 5 kV accelerating voltage was used.
Viscosity measurements of the solutions
Viscosity was measured on an A&D Vibro Viscosimeter (Tokyo, Japan) at 25 °C. The compositions of the solutions can be seen in Table 1 and the viscosity of the solutions in Table 2.
1 2 3 4 5 6 7 8 9 10 11 12 13 14 15 16 17 18 19 20 21 22 23 24 25 26 27 28 29 30 31 32 33 34 35 36 37 38 39 40 41 42 43 44 45 46 47 48 49 50 51 52 53 54 55 56 57 58 59 60
Active ingredient content and entrapment efficiency
The active ingredient content in the dried samples was determined by spectrophotometric method. For the investigations a T80 + UV-VIS spectrophotometer from PG Instruments Ltd (Leicestershire, UK) was used. To determine the amount of active ingredient content in the samples containing HPMC, standard solutions were prepared in distilled water as follows: 0.025 g of MTZ was dissolved in 100 mL distilled water. 5 mL of this solution was diluted to 25 mL and further dilutions were made to concentrations of 2.5; 5; 10; 20; 30 and 40 µg/mL. The absorbance at 319 nm was measured and used for the calibration. In case of PVP containing samples, this calibration curve was not applicable because the MTZ content cannot be determined with sufficient accuracy in the presence of this polymer. To overcome this, another calibration was made in hydrochloric acid medium [34]. The solutions for the calibration were prepared in the same concentration as previously using 0.1 mol/L concentration HCl solution.
The absorbance maximum at 276 nm was used for the calibration curve. For spray dried sample analysis, 10 mg product was dissolved and diluted to a concentration of 40 µg/mL. To calculate the concentration of MTZ in the dried samples, the following equations (1, 2) were used:
for samples containing HPMC: 𝐶𝑀𝑇𝑍 =(A319+0.0019)/0.0518
40 ∙ 100 (1)
for samples containing PVP: 𝐶𝑀𝑇𝑍 = (A276+0.0008)/0.0381
40 ∙ 100 (2)
where CMTZ: MTZ content (w/w %) in the dried samples, A319: absorbance at λ = 319 nm, A276: absorbance at λ = 276 nm.
The entrapment efficiency (EE%) was calculated by equation 3 [35]:
𝐸𝐸% =𝐶𝐶𝑀𝑇𝑍
𝑀𝑇𝑍,𝑡. 100 (3)
where CMTZ,t: MTZ amount in percentage relative to the whole solid content in the solution to be dried, i.e. the theoretical MTZ content.
1 2 3 4 5 6 7 8 9 10 11 12 13 14 15 16 17 18 19 20 21 22 23 24 25 26 27 28 29 30 31 32 33 34 35 36 37 38 39 40 41 42 43 44 45 46 47 48 49 50 51 52 53 54 55 56 57 58 59 60 61
Particle size and distribution
The particle size and distribution were determined by laser diffraction method. The calculation requires knowledge of the optical properties, such as refractive index (RI) and the imaginary component (Ab) of the refractive index of the solid sample being measured. The dried products are different in composition thus for the calculation RI = 1.5 and Ab = 0.1 were used as assumed data because they provided eligible fit between the calculated and measured data (residual shows the measured scattering data and the data predicted by the scattering model was under 1
% according to the Malvern Instruments Operators Guide [36]). The particle size was reported as a volume equivalent sphere diameter marked as d(4,3) and the distribution with d10, d50 and d90 data. The measurements were carried out in wet dispersion in 100 mL of cyclohexane containing 0.1 % soy lecithin by a Malvern Mastersizer 2000 (Malvern Instruments, Malvern, UK) using the SM dispersion unit with a stirring rate of 2000 rpm. 10 mg of sample was weighed in 1 mL of cyclohexane solutions containing 0.1 % soy lecithin and sonicated for 40 s at 30 % of power with 6 mm probe by Sonics VCX 130 instrument, then the obtained suspension was poured into the dispersion unit for measurement.
Thermal measurements
Thermal measurements were performed on a Setaram LabsysEvo thermal analyser (Setaram Instrumentation, Caluire-et-Cuire, France), in flowing (90 mL/min) high purity helium (99.9999%), with a heating rate of 20 °C/min. On average, 5-6 mg of sample was weighed into 100 μL aluminium crucible and was analysed in the 25-300 °C temperature interval. The results were evaluated by using Calisto Processing (version 2.0, AKTS, Switzerland) software, and every measurement was baseline corrected before processing.
1 2 3 4 5 6 7 8 9 10 11 12 13 14 15 16 17 18 19 20 21 22 23 24 25 26 27 28 29 30 31 32 33 34 35 36 37 38 39 40 41 42 43 44 45 46 47 48 49 50 51 52 53 54 55 56 57 58 59 60
X-ray diffraction measurements
X-ray diffraction images were recorded using a Philips PW 3710 diffractometer (Philips Analyical, Almelo, Netherlands) with CuKα radiation with a tube current of 40 mA and a voltage of 50 kV at a scanning rate of 0.02 ° 2θ / s. Control of the device and data collection was done with Philips X’Pert Data Collector software.
Transmission electron microscopy (TEM)
Samples for TEM were prepared by depositing a drop of hexane suspension of sedimented particles on copper TEM grids covered by lacey carbon amorphous support film. TEM analyses were performed using a Talos F200X G2 instrument (Thermo Fisher, Waltham, MA, US), operated at 200 kV accelerating voltage, equipped with a field-emission gun and a four-detector Super-X energy-dispersive X-ray spectrometer, and capable of working in both conventional TEM and scanning transmission (STEM) modes. Low-magnification bright-field (BF) images were obtained in TEM mode.
3. Results and discussion
3.1. Entrapment efficiency, yield and particle morphology
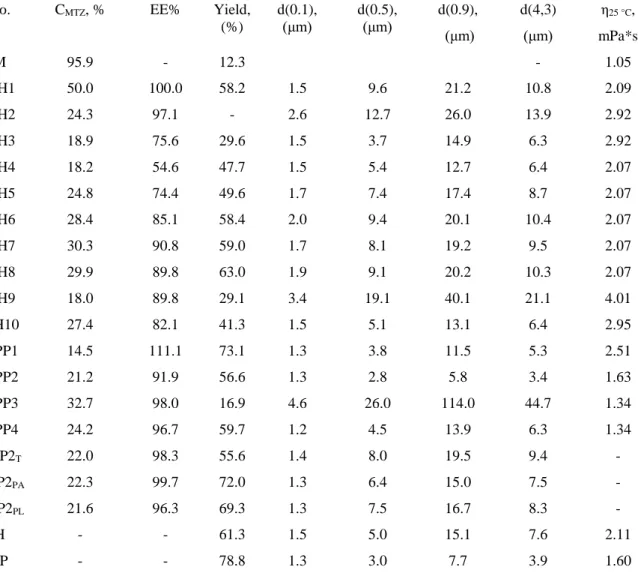
The drying process variable parameters were the inlet temperature and flow rate of the drying air, the concentration of the active ingredient, polymer and admixtures in the solutions to be dried. The process parameters are given in Table 1 and the entrapment efficiency, yield, the active ingredient content, the volume equivalent sphere diameter (particle size) of products and the viscosity of the solutions are shown in Table 2.
The solubility of metronidazole in water is 10.6 mg/mL at 25 °C[27]. In experiment M the metronidazole was dried without carrier and additives, and its concentration was 1.0 % (w/w) close to its solubility limit. The yield was very low, and the product couldn’t be removed from
1 2 3 4 5 6 7 8 9 10 11 12 13 14 15 16 17 18 19 20 21 22 23 24 25 26 27 28 29 30 31 32 33 34 35 36 37 38 39 40 41 42 43 44 45 46 47 48 49 50 51 52 53 54 55 56 57 58 59 60 61
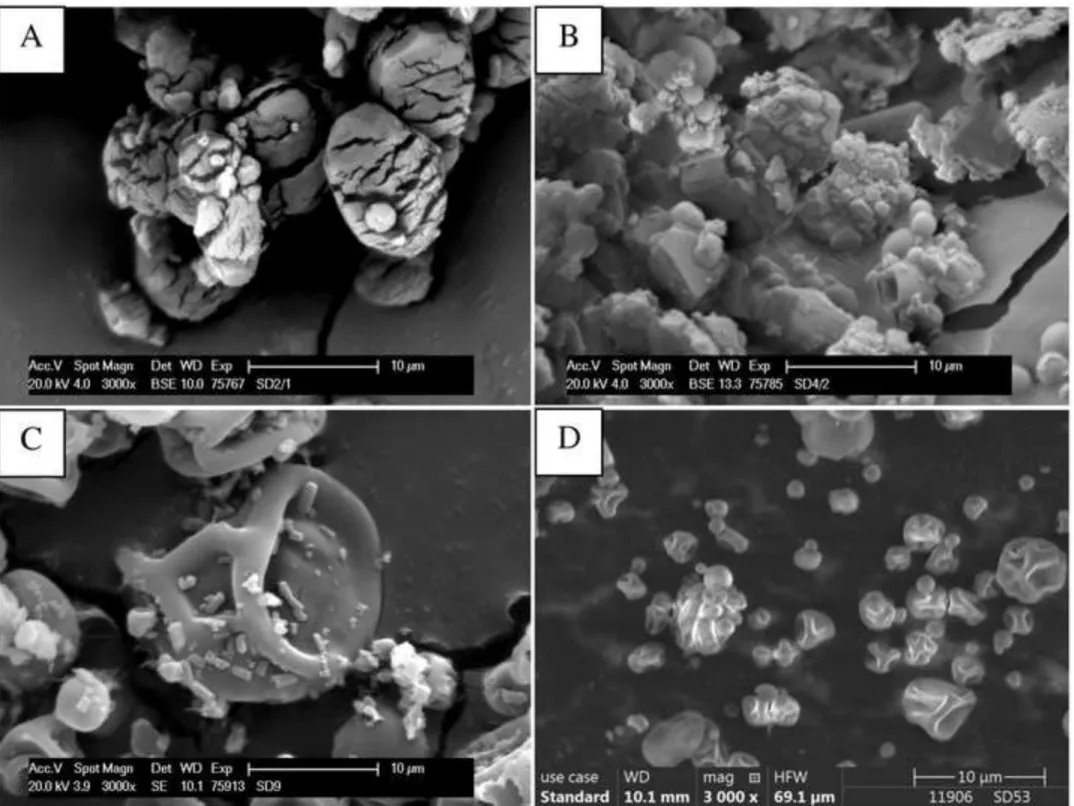
the collecting electrode, since it was very sticky. The SEM image showed (Fig. 2A) that dried active ingredient is electron beam sensitive. Excipients are often used to facilitate the manufacture process of the drug or modify its biological activity. In the drying experiments HPMC and PVP as different polymer carriers were used for encapsulation of the MTZ.
The concentration of HPMC in MH1 – MH10 experiments was adjusted to 1.0, 1.5 and 2.0 % (w/w). The particles morphology was investigated using different operational parameters in the experiments MH1 – MH3 (detailed data of experiment conditions are given in Table 1). The particle shape and morphology are important for further processing to get a drug formula, and additionally for the drug pharmacokinetics [37]. Particles with active ingredient crystals on the capsule surface can suffer from a burst release, which under some circumstances can be preferred or in contrary, even unwanted. In the experiment MH1 the concentration of the MTZ and HPMC was similar, i.e. 1.0 % (w/w). In Fig. 2B well developed MTZ crystal size around 10 µm and spherical polymer particles can be seen. During the drying process, the water evaporation enhanced the concentration of the solid materials in the solution. Solidification and diffusion took place simultaneously, and the product morphology depended on the ratio of these processes, i.e. on the solubility of materials and the viscosity of solution [33, 38]. In our case, the used concentration of the MTZ was its solubility limit in water, which means that supersaturation was reached suddenly during the evaporation causing crystallization of the MTZ before the polymer solidified, thus the MTZ was not really encapsulated in the polymer matrix. The polymer acted more as drying aid to mask the unfavourable drying characteristics of MTZ. The evaporation rate is dependent also on the drying temperature. In the experiment MH2 and MH3 different drying temperature was used, 120 °C and 100 °C, respectively. MTZ concentration was 0.5 % (w/w), i. e. under its solubility limit and HPMC:MTZ ratio was also higher than in experiment MH1. In Fig. 2C (MH2) small MTZ crystals are also observable on the microcapsules surface, while in Fig. 2D (MH3) only polymer microcapsules can be seen,
1 2 3 4 5 6 7 8 9 10 11 12 13 14 15 16 17 18 19 20 21 22 23 24 25 26 27 28 29 30 31 32 33 34 35 36 37 38 39 40 41 42 43 44 45 46 47 48 49 50 51 52 53 54 55 56 57 58 59 60
suggesting that the MTZ was encapsulated successfully. In case of 120 °C drying air temperature, the evaporation rate is higher than using 100 °C, which resulted also in a faster crystallization of the active ingredient from the solution droplets, and did not give enough time for the diffusion of MTZ inside the polymer.
The yield and entrapment efficiency are important for economical point of view of the process.
In the experiments MH4 – MH8 the drying temperature and flow rate were used in different combinations: Tin = 100 and 120 °C, Vair = 120, 100 and 90 L/min. The concentration of the solutions was fixed (see details in Table 1). Using 120 °C inlet temperature, the entrapment efficiency and yield increased by decreasing the air flow rate (samples MH4 – MH6, Table 2.).
Particle size also increased from 6.36 to 10.38 m. Experiments with 100 °C drying air temperature did not show substantial difference in the two efficiencies using 90 or 120 L/min flow rate (samples MH7 and MH8). In experiment H the HPMC polymer was also dried at a concentration of 1 % (w/w). The highest yield and the lowest particle size was very close to the values obtained for the dried sample H, i.e. the pure polymer.
The polymer concentration range in the solutions is limited because of the maximum viscosity of the solutions, which can be atomized by the piezoelectric generated spraying. In experiment MH9 the operational limit was reached with 2.0 % HPMC concentration, i. e. 4.01 mPa*s viscosity at 25 °C, the temperature also had to be adjusted to 120 °C, which resulted in higher spray head temperature in accordance with decreased viscosity during spraying. In experiment MH10 the MTZ concentration was increased to 0.75 % (w/w), the entrapment efficiency and yield were even higher than using 0.5 % (w/w) MTZ in experiment MH3. The operational parameters did not show real effect on particle size except for MH9 in which particle size above 20 µm was generated due to the high viscosity of the solution. The experiments with HPMC indicated that an inlet temperature of 100 °C, flowing rate of drying air of 90 L/min ensured the
1 2 3 4 5 6 7 8 9 10 11 12 13 14 15 16 17 18 19 20 21 22 23 24 25 26 27 28 29 30 31 32 33 34 35 36 37 38 39 40 41 42 43 44 45 46 47 48 49 50 51 52 53 54 55 56 57 58 59 60 61
highest entrapment efficiency and yield (see Table 2), that’s why the experiments with PVP were carried out at fixed inlet temperature (100 °C) and drying air flow rate (90 L/min).
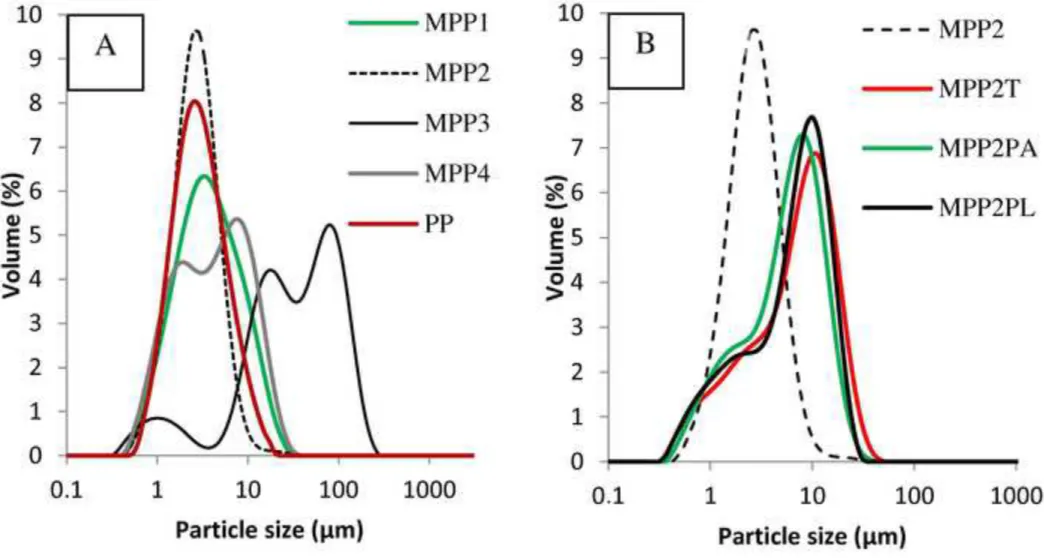
PVP has a wider polymer concentration range taking into account its applicable viscosity during spraying. In the experiments MPP1 – MPP4, the concentration of PVP was 5.0, 2.5 and 1.5 % (w/w) and that of MTZ was 0.75 and 0.5 % (w/w). It is also important to take into consideration not only the total concentration of solution but also the PVP:MTZ ratio in the solutions to be dried. The entrapment efficiency was above 90 % in all cases. Surprisingly, in the MPP1 product this value was higher than 100 %, which means the MTZ enriched in the powder. The reason of this anomaly is the used high polymer ratio, from which higher amount of polymer left with the drying air without being isolated by the electrostatic collector. The yield in experiment MPP3 was only 16.9 %, and the particle size was particularly large (44.7 µm, see in Table 2). The PVP:MTZ ratio was 2:1 which was not sufficient for masking the MTZ’s unfavourable drying characteristics as experienced in the experiment M. In the experiment MPP4, by increasing the PVP:MTZ ratio to 3:1, the yield was similar to MPP2. Taking into account also the particle size distribution (Fig. 3A), some differences could be observed compared to the experiments carried out with PVP polymer. The samples with a lower PVP:MTZ ratio gave a bimodal distribution showing the influence of MTZ (samples MPP3 and MPP4). The higher polymer concentration resulted in higher yield.
Additives such as surface active agents are capable of changing the solution characteristics significantly during drying, moreover, they can influence also the dissolution profile of the drug. The same composition were used in the experiments MPP2, MPP2T, MMP2PA and MPP2PL with different admixtures of 0.1% (w/w), namely Tween 80, PVA and Pluronic F68, respectively. Using surface active agents, the entrapment efficiency was significantly higher with PVA and Pluronic F68 compared to the result achieved with Tween 80. The particle size was enhanced, and the size distributions were very similar in all three experiments (Fig. 3B).
1 2 3 4 5 6 7 8 9 10 11 12 13 14 15 16 17 18 19 20 21 22 23 24 25 26 27 28 29 30 31 32 33 34 35 36 37 38 39 40 41 42 43 44 45 46 47 48 49 50 51 52 53 54 55 56 57 58 59 60
The yield increased in the experiments MPP2PA and MPP2PL by 15% and 13 %, respectively, compared to the sample MPP2. The appropriate selection of a surface active agent can facilitate the product collection from the collective electrode surface, resulting in higher yield. The maximum achievable yield in the experiments with PVP was 78.8 % (experiment PP) where the pure polymer was dried which also indicates the unfavourable characteristic of the MTZ during drying.
3.2. Thermal measurements
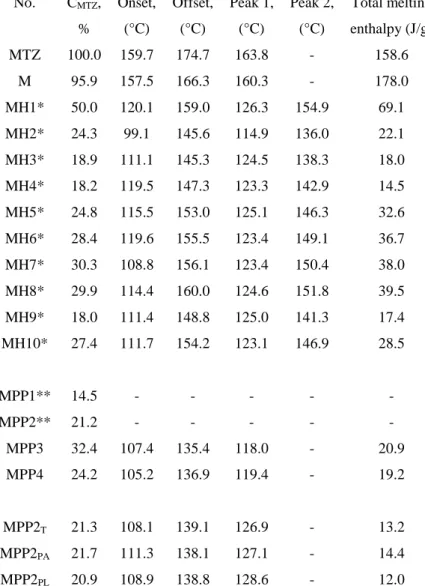
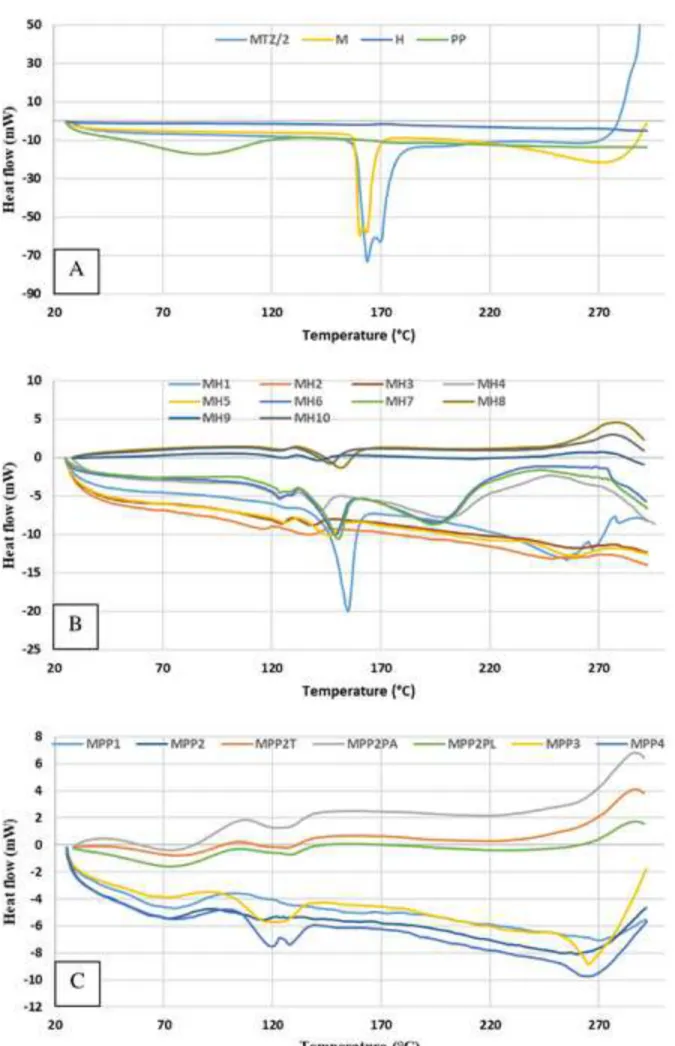
The DSC curves show that the samples dried with polymers (Fig. 4B and C) have different melting point behaviour compared to the pure MTZ or dried M sample (see Fig. 4A). In the heat flow curve of MTZ and M, two peaks can be seen: the first sharp peak between 159.7 and 174.7° C corresponds to the melting of the MTZ, while the second peak (295.7 °C) corresponds to the molten material decomposition (280 °C according to [39]). In the majority of samples, the melting endotherm indicates the crystalline state of MTZ incorporated in the amorphous polymer carriers (H and PP on Fig. 4A). The active ingredient content, onset and offset temperatures, peak temperatures, and melting enthalpies are summarized in Table 3. MTZ and M melts between 159.7 – 174.7 and 157.5 – 166.3 ° C, respectively (according to the US Pharmacopeia the melting point of MTZ is between 159 – 163 °C, [40]), whereas this melting interval is located at much lower temperatures for the dried samples. The dried samples are composite materials of an active ingredient and polymer(s), hence they are solid dispersions.
The solid dispersions can be classified into three broader groups as eutectic mixtures, solid solutions and microfine crystalline dispersions [41]. To interpret the phenomena of melting point decrease and to investigate the solid states of dried products, thermal data (melting intervals and enthalpies) of HPMC polymer containing samples were evaluated, and compared with the result obtained from powder X-ray diffraction (see section 3.3) and transmission electron microscopic measurements (see section 3.4.).
1 2 3 4 5 6 7 8 9 10 11 12 13 14 15 16 17 18 19 20 21 22 23 24 25 26 27 28 29 30 31 32 33 34 35 36 37 38 39 40 41 42 43 44 45 46 47 48 49 50 51 52 53 54 55 56 57 58 59 60 61
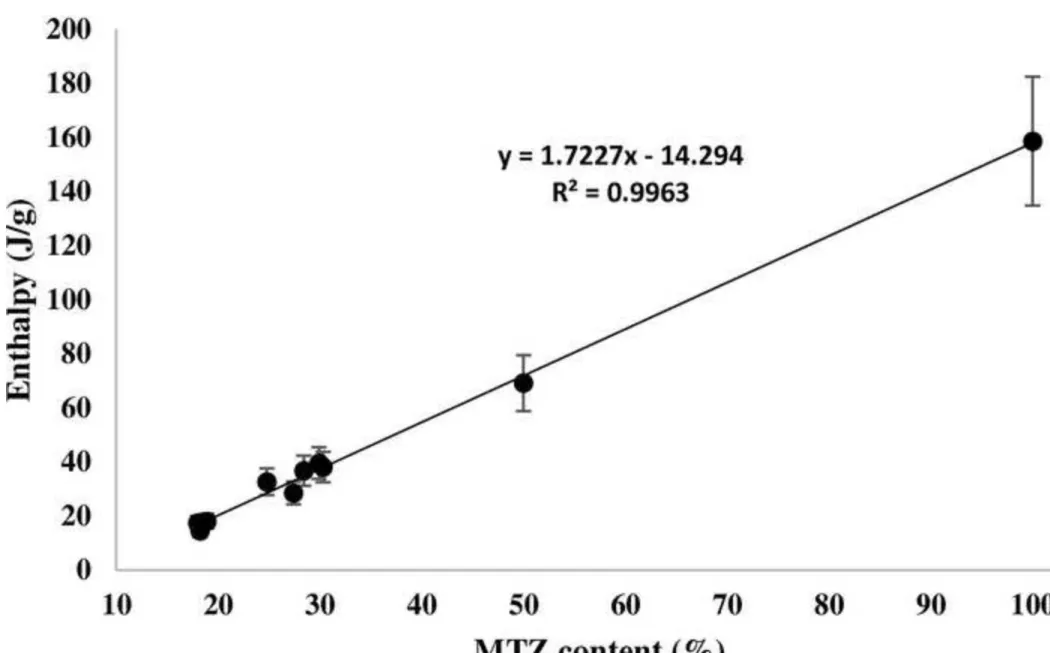
The selected samples in experiments carried out with HPMC had two endotherm peaks between 99.1 and 160.0 °C (Fig. 4 B). D. J. Blundell examined poly(ether ether ketone) by DSC and assumed two hypotheses for double melting peaks: (i) they are due to two separate crystal morphologies; (ii) they are attributable to recrystallization effects [42]. P. Corradini et al.
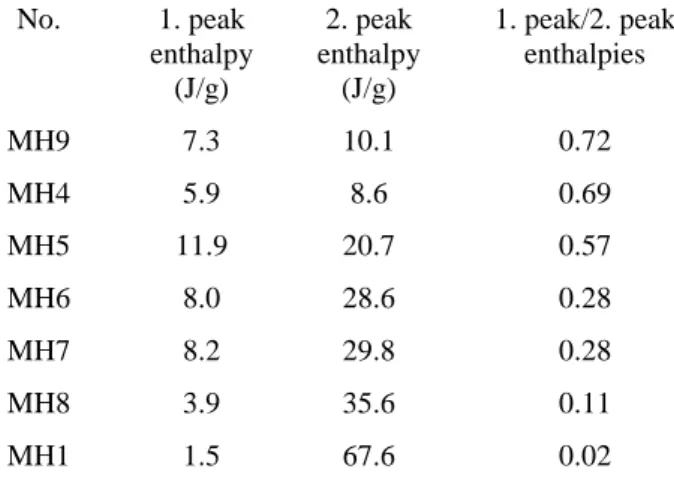
discussed the splitting of the melting peak for isotactic polypropylene. They assumed if the X- ray data indicated only one crystal form, the two different melting peaks could be attributed to different disordered crystals, different crystal sizes, or different crystal types [43]. In our case, when the total melting enthalpy values (obtained by adding the enthalpy of the two successive endotherms) were plotted against the active ingredient content (Fig. 5), a straight line could be obtained with a 15 % error bar, demonstrating that the total enthalpy was correlated to the amount of MTZ content in the samples. In case of recrystallization process, this correlation would not have existed. Comparing the enthalpy of the first and second melting peaks in our experiments with HPMC, their ratio in the total value changed in each experiment (Table 4, the table does not contain MH2, MH3, MH10 samples due to the increased spray rate, the outlet temperature decreased so could not be compared to other samples). It has been discussed in several papers that melting temperature of nanoparticles is dependent on the particle size [44, 45]. Assuming that the melting point decreased because of the reduction of crystal size, the first endotherm corresponded to the melting of smaller crystals, while the second larger endotherm was the result of melting of the larger crystal fraction [46]. Thus, with respect to the ratio of the first peak to the second one, a higher ratio represented higher number of smaller crystals. Its reason can be explained with the different drying conditions. As mentioned above, drying is determined by two processes, firstly, by the reduction in solubility due to solvent evaporation leads to solidification of the product and secondly by the rate of diffusion. The ratio of the solidification to the diffusion rate depends on the followings:
- concentration of material in the solutions (concerning its solubility),
1 2 3 4 5 6 7 8 9 10 11 12 13 14 15 16 17 18 19 20 21 22 23 24 25 26 27 28 29 30 31 32 33 34 35 36 37 38 39 40 41 42 43 44 45 46 47 48 49 50 51 52 53 54 55 56 57 58 59 60
- viscosity of solutions,
- the drying temperature determined from inlet temperature and air flow rate.
The crystal formation is demonstrated in Fig. 6. The lowest ratio of 0.02 was obtained for MH1 sample. Adjusting the concentration of MTZ to 1 % (w/w) that is its solubility limit, the crystallization took place very fast, and most of the crystals in bigger size grew outside the polymer drops (Fig 2B). The highest ratio was reached at sample MH9 with a value of 0.72 using the highest polymer concentration (2 %), which favours the formation of smaller crystals.
Increasing the polymer concentration, therefore the viscosity of the solution, resulted in lower diffusion coefficient, thus causing the formation of smaller crystals. In other cases the ratio of the solidification and diffusion was mainly determined by the drying temperature. The higher the temperature, the faster solidifying the particles and diffusion could not occur, producing smaller crystals. Furthermore, the drying air flow rate had also influence on the solidification and diffusion rates. Shorter evaporation time was the consequence of its higher rate in higher outlet temperature resulting in also smaller crystals. The variation in the ratio of two peaks correlated with the change of the operational parameters, thus, this also proved that both peaks corresponded to the melting of the MTZ.
In the case of samples dried with PVP excipient, two different melting points were not obviously separated on the DSC curves. The reason can be the different interaction between MTZ and HPMC or PVP, or the different solidification process of the polymers (Fig. 7). The shape of the particles with HPMC polymers was collapsed hollow spheres, while the composites was spherical with PVP.
The degree of crystallinity was examined in comparison with the active ingredient content (data in Table 5). The MH4 sample gave the lowest degree of crystallinity relative to the active ingredient content (50.2 %), while the MH1 sample the highest (87.1 %). In the case of MH1 sample, this ratio is high because of the relatively large amount of active ingredient compared
1 2 3 4 5 6 7 8 9 10 11 12 13 14 15 16 17 18 19 20 21 22 23 24 25 26 27 28 29 30 31 32 33 34 35 36 37 38 39 40 41 42 43 44 45 46 47 48 49 50 51 52 53 54 55 56 57 58 59 60 61
to the polymer, therefore only a small ratio of MTZ was generated in amorphous form. In the case of MH4 sample, this ratio is the lowest because the drug crystallized rapidly during the drying due to the high temperature and air flow rate forming more amorphous MTZ. On the other hand, most of the crystals were removed by the drying air from the surface of the particles, reducing the amount of crystalline drug compared to the amorphous drug.
For samples containing PVP, the degree of crystallinity varied between 35.0 and 50.0 % (not calculated for MPP1 and MPP2 samples due to inadequate fitting). The reason for it was the PVP polymer was used in larger amounts due to its lower viscosity, the ratio of polymer was higher than in the HPMC-containing samples.
If only the degree of crystallinity was taken into account, its value moved from 9.1 % (MH4) to 43.6 % (MH1), and from 7.6 % (MPP2PL) to 13.2 % (MPP4) for samples containing HPMC or PVP (not calculated for MPP1 and MPP2 samples), respectively.
3.3 X-ray diffraction measurements
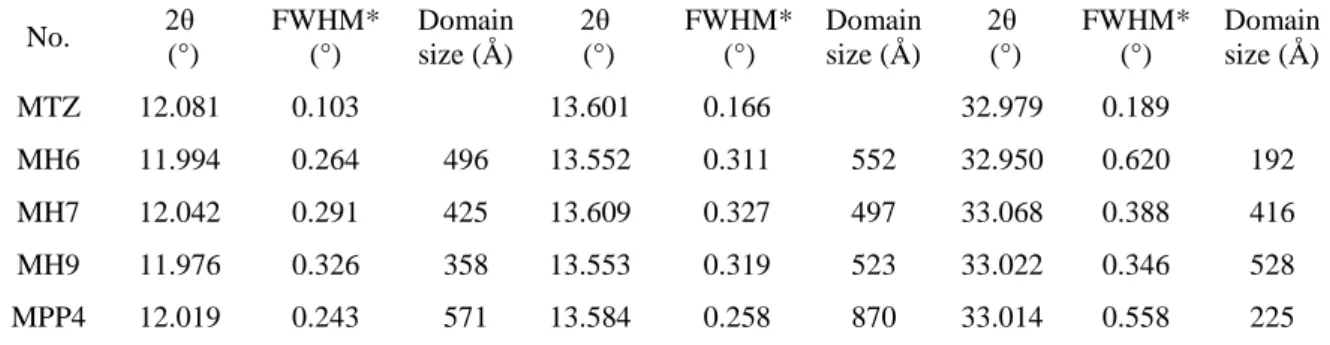
The DSC curves showed that MTZ had a well-defined melting point in the most of the samples, that is, a part of the active ingredient was encapsulated surely in crystalline state in the amorphous polymer providing a form of solid dispersion. The powder X-ray diffraction results also confirmed the crystalline state of the MTZ (Fig. 8A and B) except sample MPP1 in which the MTZ content was the lowest. Peak broadening can also be seen compared to the pure MTZ (Fig. 9 in case of MPP4 sample). The results are listed in Table 6 for selected MTZ products.
The possible reason for peak broadening is the decrease in crystal size relative to the bulk MTZ [47, 48]. As discussed in section 3.2, based on the results of DSC investigations of the dried samples, they showed reduced melting point compared to the bulk MTZ. The decrease in crystallite size accompanies with the drop of melting point as discussed also by Roumanille et al. [49] in case of bismuth oxalate nanoparticles. According to the Scherrer equation, the
1 2 3 4 5 6 7 8 9 10 11 12 13 14 15 16 17 18 19 20 21 22 23 24 25 26 27 28 29 30 31 32 33 34 35 36 37 38 39 40 41 42 43 44 45 46 47 48 49 50 51 52 53 54 55 56 57 58 59 60
calculated coherent scattering domain sizes were in the range of 19 – 87 nm (Table 6), which was also confirmed by the TEM measurement results (see section 3.4). According to the degree of crystallinity relative to the amount of the drug and the results of X-ray measurement, it can be stated that the drug was partially in crystalline and amorphous state in the amorphous polymer.
3.4 TEM investigations
Scanning transmission electron microscopic images of sample MH2 were imaged in bright field mode (Fig. 10). Due to the fact that the focused beam of high-energy electrons damaged most of the investigated samples, reliable images were taken only from sample MH2. The small MTZ crystals appeared as dark spots, because they are scattering much more electrons than the amorphous polymer that does not have long range order. On lower magnifiction in Fig. 10A and B the crystallite sizes were between 200 – 400 nm in diameter. In higher magnification smaller MTZ crystals became visible (Fig. 10 C and D), and their sizes were between 20 – 50 nm in good agreement with the calculated domain sizes obtained from the X-ray measurements (the data is given in Table 6). Based on these results, we can conclude that the spray dried MTZ- polymer composite products were nanostructured solid dispersions in which the drug was distributed in crystalline and amorphous form in the polymer matrix [50]. Size stabilized nanostuctured drug microparticles have been often produced by two or more consecutive steps, e.g. by direct spray drying of the nanoprecipitated budesonide-mannitol composites, microparticles were prepared as reported by Hu et al [51]. In our experiments the nanostructured product was formulated by a one-step spray drying process.
1 2 3 4 5 6 7 8 9 10 11 12 13 14 15 16 17 18 19 20 21 22 23 24 25 26 27 28 29 30 31 32 33 34 35 36 37 38 39 40 41 42 43 44 45 46 47 48 49 50 51 52 53 54 55 56 57 58 59 60 61
4. Conclusions
In the present work, MTZ active ingredient was encapsulated in HPMC and PVP polymers from solutions by nano spray drying technology. The concentration of active ingredient and polymer as well as their relative ratio had a significant influence on the process feasibility, since the concentration of polymer defines the solution viscosity and the solubility relations. During drying, the solidification and the diffusion occurred simultaneously, while the product morphology depended on the ratio of these processes, e. g. the MTZ could not be fully entrapped into the polymer matrix, when its concentration was adjusted to the solubility limit. In the micron-sized dried products, the entrapped MTZ was in partially crystalline and amorphous form in both polymers as confirmed by DSC and powder X-ray diffraction measurements. The degree of crystallinity was between 50.2 and 81.0 % and between 35.0 and 50.0 % in HPMC and in PVP composites, respectively (with respect to the drug content), dependent on the solution composition and process conditions. The crystalline state of the samples with HPMC was investigated to get information about the structure of the composites. The MH samples had two endotermic peaks between 99.1 and 160.0 °C, that can be attributed to the MTZ melting process. The ratio of the first and second melting enthalpy peak changed with the drying conditions. The higher evaporation rate gave higher ratio of first and second peak, which probably can be assigned to a decrease in the crystal size resulting in the reduction of melting point. This assumption was supported by the peak broadening which was observed in the X-ray measurement. The TEM images showed larger crystals (200 – 400 nm) and a fraction of much smaller crystals (20 – 50 nm in diameter), which are in good correlation with the calculated coherent scattering domain sizes on the basis of X-ray data. The DSC, powder X-ray and TEM analysis supported the assumption that the MTZ-polymer composites were nanostructured solid dispersion in which the nanometer size crystals and the amorphous fraction of the active ingredient distributed in the amorphous polymer matrix. To keep the active ingredients in stable
1 2 3 4 5 6 7 8 9 10 11 12 13 14 15 16 17 18 19 20 21 22 23 24 25 26 27 28 29 30 31 32 33 34 35 36 37 38 39 40 41 42 43 44 45 46 47 48 49 50 51 52 53 54 55 56 57 58 59 60
nanoformulation is a challenge, which might be achieved by embedding the nanoparticles into polymer microparticles. Using spray drying process, nanosuspension, nanoelmulsion or solutions can be transformed to solid microparticles that incorporated the active ingredient in different state (crystalline, amorphous or crystalline-amorphous) mainly in polymer matrices.
To investigate the product structure is rather difficult, because the carrier and the drug often have similar characteristics concerning the different identification methods. In our case, the crystalline part of the drug formed nanstructured solid dispersions.
5. Acknowledgements
Authors would like to acknowledge the European Structural and Investments Funds and the Hungarian Government for providing funding in frame of GINOP-2.2.1-15-2016-00023 project for this work. This work was also supported by the TKP2020-IKA-07 project financed under the 2020-4.1.1-TKP2020 Thematic Excellence Programme by the National Research, Development and Innovation Fund of Hungary. The authors are especially grateful to the EGIS Pharmaceuticals PLC for their partnership. TEM/SEM studies were performed at the electron microscopy laboratory of the University of Pannonia, founded with the aid of grant no. GINOP- 2.3.3-15-2016-0009 from the European Structural and Investments Funds and the Hungarian Government. The authors express their gratitude for Éva Kristóf Makó (University of Pannonia) for the powder X-ray diffraction measurements.
1 2 3 4 5 6 7 8 9 10 11 12 13 14 15 16 17 18 19 20 21 22 23 24 25 26 27 28 29 30 31 32 33 34 35 36 37 38 39 40 41 42 43 44 45 46 47 48 49 50 51 52 53 54 55 56 57 58 59 60 61
6. References
[1] A. S. Mujumdar, L.-X. Huang, X. Dong Chen, An overview of the recent advances in spray-drying, Dairy Sci. Technol. 90 (2010) 211–224.
[2] R. Vehring, Pharmaceutical Particle Engineering via Spray Drying, Pharmaceutical Research 25(5) (2007) 999–1022.
[3] A. Bhakay, M. Rahman, R. N. Dave, E. Bilgili, Bioavailability Enhancement of Poorly Water-Soluble Drugs via Nanocomposites: Formulation–Processing Aspects and Challenges, Pharmaceutics 10 (2018) 86.
[4] J. P. Möschwitzer, Drug nanocrystals in the commercial pharmaceutical development process, International Journal of Pharmaceutics 453 (2013) 142– 156.
[5] S. M. Jafari, C. Arpagaus, M. A. Cerqueira, K. Samborska, Nano spray drying of food ingredients; materials, processing and applications, Trends in Food Science & Technology 109 (2021) 632–646.
[6] M. Rahman, F. Arevalo, A. Coelho, E. Bilgili, Hybrid nanocrystal–amorphous solid dispersions (HyNASDs) as alternative to ASDs for enhanced release of BCS Class II drugs, European Journal of Pharmaceutics and Biopharmaceutics 145 (2019) 12–26.
[7] X. Li, N. Anton, C. Arpagaus, F. Belleteix, T. F Vandamme, J., Nanoparticles by spray drying using innovative new technology: The Büchi Nano Spray Dryer B-90, Journal of Controlled Release 147(2) (2010) 304–310.
[8] N. Schafroth, C. Arpagaus, U. Y. Jadhav, S. Makne, D., Douroumis, Nano and microparticle engineering of water insoluble drugs using a novel spray-drying process, Colloids and Surfaces B: Biointerfaces 90 (2012) 8–15
[9] K. Mosen, K. Backstrom, K. Thalberg, T. Schaefer, H. G. Kristensen, A. Axelsson,
1 2 3 4 5 6 7 8 9 10 11 12 13 14 15 16 17 18 19 20 21 22 23 24 25 26 27 28 29 30 31 32 33 34 35 36 37 38 39 40 41 42 43 44 45 46 47 48 49 50 51 52 53 54 55 56 57 58 59 60
Particle formation and capture during spray drying of inhalable particles, Pharmaceutical Development and Technology 9(4) (2004) 409–417.
[10] Y.-F. Maa, H. R. Costantino, P.-A. Nguyen, C. C. Hsu, The Effect of Operating and Formulation Variables on the Morphology of Spray-Dried Protein Particles, Pharmaceutical Development and Technology 2(3) (1997) 213-223.
[11] A. J. K. Atia, Synthesis and Antibacterial Activities of New Metronidazole and Imidazole Derivatives, Molecules 14 (2009) 2431-2446.
[12] S. Naveed, N. Waheed, S. Nazeer, Degradation Study of Metronidazole in Active and Different Formulation by UV Spectroscopy, Journal of Bioequivalence & Bioavailability, 6(4) (2014) 124-127.
[13] M. Szekalska, K. Winnicka, Evaluation of Hard Gelatin Capsules with Alginate Microspheres Containing Model Drugs with Different Water Solubility, Acta Poloniae Pharmaceutica - Drug Research, 74(4) (2017) 1221-1230.
[14] L. Nohemann, M. P. de Almeida, P. C. Ferrari, Floating ability and drug release evaluation of gastroretentive microparticles system containing metronidazole obtained by spray drying, Braz. J. Pharm. Sci. 53(1) (2017) e15218.
[15] C. J. Lee, C. S. Nah, C. S. Teng, W. W. Jun, M. Saravanan, Spray dried calcium gelled arabinoxylan microspheres: A novel carrier for extended drug delivery, Chemical Papers 69(10) (2015) 1325–1330.
[16] Z. Vanic, O. Planinšek, N. Škalko-Basnet, I. Tho, Tablets of pre-liposomes govern in situ formation of liposomes: Concept and potential of the novel drug delivery system, European Journal of Pharmaceutics and Biopharmaceutics, 88(2) (2014) 443–454.
1 2 3 4 5 6 7 8 9 10 11 12 13 14 15 16 17 18 19 20 21 22 23 24 25 26 27 28 29 30 31 32 33 34 35 36 37 38 39 40 41 42 43 44 45 46 47 48 49 50 51 52 53 54 55 56 57 58 59 60 61
[17] V. Jokanovic´, B. Cˇolovic´, M. Dutour Sikiric´, V. Trajkovic´, Tablets of pre-liposomes govern in situ formation of liposomes: Concept and potential of the novel drug delivery system, Ultrasonics Sonochemistry 20 (2013) 535–545.
[18] E. Esposito, E. Menegatti, R. Cortesi, Hyaluronan-based microspheres as tools for drug delivery: a comparative study, International Journal of Pharmaceutics 288 (2005) 35–49.
[19] J.C. Menéndez, A. M. Sakr, Development of metronidazole controlled release pellets in the rotary fluid-bed spray granulator, Die Pharmazeutische Industrie 65(5) (2003) 448-453.
[20] N. Skalko-Basnet, Z. Pavelic, M. Becirevic-Lacan, Liposomes Containing Drug and Cyclodextrin Prepared by the One-Step Spray-Drying Method, Drug Development and Industrial Pharmacy 26(12) (2000) 1279–1284.
[21] M. Szekalska, K. Winnicka, A. Czajkowska-Kosnik, K. Sosnowska, A. Amelian, Evaluation of Alginate Microspheres with Metronidazole Obtained by the Spray Drying Technique, Acta Poloniae Pharmaceutica 72(3) (2015) 569-578.
[22] M. Kilicarslan, M. Gumustas, S. Yildiz, T. Baykara, Preparation and Characterization of Chitosan-Based Spray-Dried Microparticles for the Delivery of Clindamycin Phosphate to Periodontal Pockets, Current Drug Delivery 11(1) (2014) 98–111.
[23] G. Perera, J. Barthelmes, A. Bernkop-Schnürch, Novel pectin–4-aminothiophenole conjugate microparticles for colon-specific drug delivery, Journal of Controlled Release 145(3) (2010) 240–246.
[24] C. M. Oh, P. W. S. Heng, L. W. Chan, Influence of Hydroxypropyl Methylcellulose on Metronidazole Crystallinity in Spray-Congealed Polyethylene Glycol Microparticles and Its Impact with Various Additives on Metronidazole Release, AAPS PharmSciTech, 16(6) (2015) 1357–1367.
1 2 3 4 5 6 7 8 9 10 11 12 13 14 15 16 17 18 19 20 21 22 23 24 25 26 27 28 29 30 31 32 33 34 35 36 37 38 39 40 41 42 43 44 45 46 47 48 49 50 51 52 53 54 55 56 57 58 59 60