molecules
Article
Photocatalytic Crystalline and Amorphous TiO 2 Nanotubes Prepared by Electrospinning and Atomic Layer Deposition
Orsolya Kéri1, Eszter Kocsis1, Dániel Attila Karajz1, Zsombor Kristóf Nagy2 , Bence Parditka3, Zoltán Erdélyi3 , Anna Szabó4, Klára Hernádi4,5 and Imre Miklós Szilágyi1,*
Citation: Kéri, O.; Kocsis, E.; Karajz, D.A.; Nagy, Z.K.; Parditka, B.; Erdélyi, Z.; Szabó, A.; Hernádi, K.; Szilágyi, I.M. Photocatalytic Crystalline and Amorphous TiO2Nanotubes Prepared by Electrospinning and Atomic Layer Deposition.Molecules 2021,26, 5917. https://doi.org/
10.3390/molecules26195917
Academic Editor: Stoyan Gutzov
Received: 9 August 2021 Accepted: 18 September 2021 Published: 29 September 2021
Publisher’s Note:MDPI stays neutral with regard to jurisdictional claims in published maps and institutional affil- iations.
Copyright: © 2021 by the authors.
Licensee MDPI, Basel, Switzerland.
This article is an open access article distributed under the terms and conditions of the Creative Commons Attribution (CC BY) license (https://
creativecommons.org/licenses/by/
4.0/).
1 Department of Inorganic and Analytical Chemistry, Budapest University of Technology and Economics, H-1111 Budapest, Hungary; orsolyakeri@gmail.com (O.K.); kocsis.eszti125@gmail.com (E.K.);
karda412@gmail.com (D.A.K.)
2 Department of Organic Chemistry and Technology, Budapest University of Technology and Economics, H-1111 Budapest, Hungary; zsknagy@oct.bme.hu
3 Department of Solid State Physics, Faculty of Sciences and Technology, University of Debrecen, H-4026 Debrecen, Hungary; parditka.bence@science.unideb.hu (B.P.);
zoltan.erdelyi@science.unideb.hu (Z.E.)
4 Department of Applied and Environmental Chemistry, University of Szeged, H-6720 Szeged, Hungary;
anna.szabo992@gmail.com (A.S.); hernadi@chem.u-szeged.hu (K.H.)
5 Institute of Physical Metallurgy, Metalforming and Nanotechnology, Faculty of Materials Science and Engineering, University of Miskolc, H-3515 Miskolc, Hungary
* Correspondence: szilagyi.imre.miklos@vbk.bme.hu
Abstract:In this work core/shell composite polymer/TiO2nanofibers and from those TiO2nanotubes were prepared. First, poly(vinyl alcohol) (PVA) and poly(vinylpyrrolidone) (PVP) fibers were synthetized by electrospinning. They were covered with a 100 nm thick amorphous TiO2layer by atomic layer deposition at 50◦C. Later the polymer core was removed by two different methods:
dissolution and annealing. In the case of dissolution in water, the as-prepared TiO2 nanotubes remained amorphous, while when annealing was used to remove the polymers, the TiO2crystallized in anatase form. Due to this, the properties of amorphous and crystalline TiO2nanotubes with exactly the same structure and morphology could be compared. The samples were investigated by SEM-EDX, ATR-IR, UV-Vis, XRD and TG/DTA-MS. Finally, the photocatalytic properties of the TiO2nanotubes were studied by decomposing methyl-orange dye under UV light. According to the results, crystalline anatase TiO2nanotubes reached the photocatalytic performance of P25, while amorphous TiO2nanotubes had observable photocatalytic activity.
Keywords:electrospinning; ALD; TiO2; amorphous; nanotube; photocatalysis
1. Introduction
Nowadays the importance of utilizing renewable energy sources is increasing. One of these renewable sources is sunlight, which can be converted into chemical energy for example through photocatalysis [1]. Photocatalysis uses solar energy to enable or accelerate chemical reactions [2]. The research of semiconductor oxide (e.g., WO3, ZnO or TiO2) photocatalysis has grown exponentially in the recent years [3]. The most widely used semiconductor oxide in this field is TiO2, which has three crystalline phases (anatase, rutile and brookite). The anatase and rutile forms have been thoroughly studied, and it was found that generally anatase TiO2has a higher activity than rutile, mostly thanks to its higher adsorbance capacity for organic compounds [4,5]. Meanwhile brookite was not investigated as exhaustively, since it is immensely difficult to obtain in pure phase and due to this, it would be too expensive to use [6]. In amorphous form TiO2is considered not to have any photocatalytic effect, owing to that its crystal structure contains many imperfections, which can serve as recombination centers for the electron-hole pairs. Amorphous TiO2was only used in composition with nanostructured materials (e.g., lotus leaves [7], fullerene [8]) or
Molecules2021,26, 5917. https://doi.org/10.3390/molecules26195917 https://www.mdpi.com/journal/molecules
Molecules2021,26, 5917 2 of 12
with other photocatalitically active semiconductor oxides [9] to prepare photocatalysts.
TiO2 and composites containing TiO2 are tested as photocatalysts for many different applications, amongst these are the decomposition of organic contaminants [10,11], water purification [12,13], the preparation of self-cleaning surfaces [14,15], sterilization [16,17], photoelectrochemical conversion [18,19], etc.
The photocatalytic efficiency is dependent on many properties of the material, such as the composition, crystallinity, morphology and the specific surface area. Thus, being able to control these characteristics is key in achieving good photocatalytic activity. These could be controlled through choosing the most suitable synthesis method. There are many different preparation strategies and techniques, which can be used or also combined to attain the best results [20,21]. One synthesis method, which enables the preparation of nanomaterials with high specific surface area and precisely controlled composition, is electrospinning [22,23]. This technique has a simple set-up; a polymer solution or melt, which can also contain the precursor salt of metal-oxides, is filled into a plastic syringe with a metal needle tip. Then high voltage is applied to it, which causes the eruption of charged jets from the surface of the liquid. These jets stretch to ultrathin fibers due to the applied electric field and dry mid-flight, before reaching the grounded collector. If the polymer solution already contains the precursor of a semiconductor oxide, e.g., titanium tetraisopropoxide, pure oxide nanofibers can be prepared by annealing the composite to high temperatures [24]. In this case the polymer content is burnt out completely.
If pure polymer fibers are prepared, they can be used as templates for the preparation of core/shell nanofibers by covering them with a thin layer of semiconductor oxide [25,26].
The polymers are usually thermosensitive materials, and due to that the deposition of the film onto them has to be done at low temperatures, but also a highly organized structure is needed for good photocatalytic activity. A thin film deposition method, that meets both requirements, is atomic layer deposition (ALD) [27,28]. By this method the growth of thin layers is possible within nanometer range precision, owing to the alternating surface controlled reactions. If the right precursors are chosen for the synthesis, the reaction temperature can be lowered eVen to room temperature; thus, it can be easily combined with electrospinning [29].
The aim of our work was to prepare polymer/TiO2core/shell composite nanofibers and then TiO2nanotubes by removing the polymer core. For that, first, poly(vinyl alcohol) (PVA) and poly(vinylpyrrolidone) (PVP) nanofibers were prepared by electrospinning from their aqueous solutions. These fibers were then used as templates for preparing polymer/TiO2core/shell nanocomposites. The polymers were covered with amorphous TiO2layers by ALD. For photocatalytic purposes crystalline TiO2was needed, therefore the composite nanofibers were annealed to remove the polymer core and crystallize the TiO2in anatase form. The polymer was also removed from the samples by dissolution, to be able to compare the properties of the anatase TiO2nanotubes to amorphous ones that have the exact same morphology. All the samples were investigated by scanning electron microscopy (SEM), energy dispersive X-ray analysis (EDX), ATR-IR and UV-Vis spec- troscopy and X-ray powder diffraction (XRD). Finally, the photocatalytic properties were studied by decomposing methyl orange dye under UV irradiation, which was followed by UV-Vis spectroscopy.
2. Results
2.1. Preparation of the Polymer Fibers
2.1.1. SEM-EDX of the Polymer Nanofibers
The SEM images showed that both the as-prepared PVA (Figure1a) and the PVP (Figure2a) nanofibers had a fairly uniform fibrous structure, the fibers were several cen- timeters long. The PVA nanofibers had a diameter of 200–300 nm, while the PVP fibers were about 500–700 nm thick.
Molecules2021,26, 5917 3 of 12
Molecules 2021, 26, 5917 3 of 12
Figure 1. SEM images of (a) PVA nanofibers; (b) PVA/TiO2 composite nanofibers, (c,d) TiO2 nano- tubes obtained from the PVA/TiO2 composite by dissolution, (e,f) TiO2 nanotubes obtained from the PVA/TiO2 composite by annealing.
Figure 2. SEM images of (a) PVP nanofibers; (b) PVP/TiO2 composite nanofibers, (c,d) TiO2 nano- tubes obtained from the PVP/TiO2 composite by dissolution, (e,f) TiO2 nanotubes obtained from the PVP/TiO2 composite by annealing.
Figure 1.SEM images of (a) PVA nanofibers; (b) PVA/TiO2composite nanofibers, (c,d) TiO2nan- otubes obtained from the PVA/TiO2composite by dissolution, (e,f) TiO2nanotubes obtained from the PVA/TiO2composite by annealing.
Molecules 2021, 26, 5917 3 of 12
Figure 1. SEM images of (a) PVA nanofibers; (b) PVA/TiO2 composite nanofibers, (c,d) TiO2 nano- tubes obtained from the PVA/TiO2 composite by dissolution, (e,f) TiO2 nanotubes obtained from the PVA/TiO2 composite by annealing.
Figure 2. SEM images of (a) PVP nanofibers; (b) PVP/TiO2 composite nanofibers, (c,d) TiO2 nano- tubes obtained from the PVP/TiO2 composite by dissolution, (e,f) TiO2 nanotubes obtained from the PVP/TiO2 composite by annealing.
Figure 2. SEM images of (a) PVP nanofibers; (b) PVP/TiO2composite nanofibers, (c,d) TiO2nan- otubes obtained from the PVP/TiO2composite by dissolution, (e,f) TiO2nanotubes obtained from the PVP/TiO2composite by annealing.
Molecules2021,26, 5917 4 of 12
2.1.2. Thermal Analysis of the Polymer Nanofibers in Nitrogen
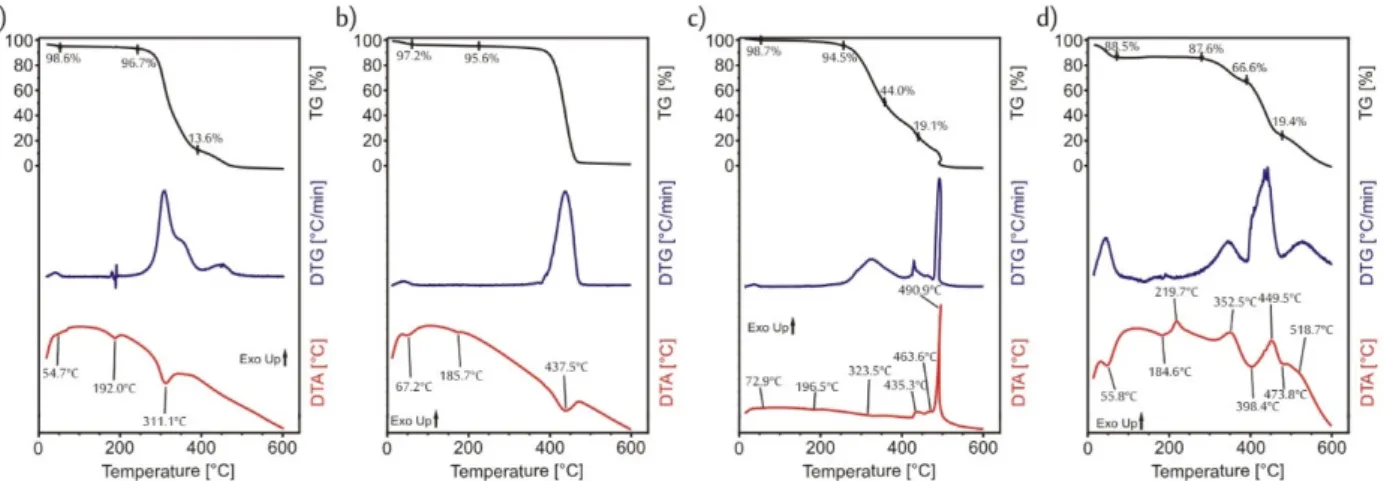
Before any further synthesis steps, the thermal analysis of the fibers was done by TG/DTA (Figure3) in inert (nitrogen) atmosphere in order to determine what temperature could be used for the ALD deposition without degrading the polymer fibers. In the case of both polymers, until 100◦C, there was no significant mass loss (Figure3a,b); only water, which was used as the solvent during the electrospinning, eVaporated. Then, above 200◦C the degradation of the polymers stared. The PVP decomposed in one step, while for the PVA the degradation consisted of several smaller overlapping steps. On the TGA curves of the PVA and the PVP as well, there were three endothermic peaks. The first one referred to the eVaporation of the solvent, while the last one to the decomposition. When the second endothermic peak appeared on the DTA curve, there was no corresponding mass loss on the TG curves, so these endothermic peaks represented the softening of the PVA (at 192◦C) and of the PVP (at 186◦C). Based on these results, a very low temperature, 50◦C was chosen for the ALD depositions.
Molecules 2021, 26, 5917 4 of 12
2.1.2. Thermal Analysis of the Polymer Nanofibers in Nitrogen
Before any further synthesis steps, the thermal analysis of the fibers was done by TG/DTA (Figure 3) in inert (nitrogen) atmosphere in order to determine what temperature could be used for the ALD deposition without degrading the polymer fibers. In the case of both polymers, until 100 °C, there was no significant mass loss (Figure 3a,b); only water, which was used as the solvent during the electrospinning, evaporated. Then, above 200
°C the degradation of the polymers stared. The PVP decomposed in one step, while for the PVA the degradation consisted of several smaller overlapping steps. On the TGA curves of the PVA and the PVP as well, there were three endothermic peaks. The first one referred to the evaporation of the solvent, while the last one to the decomposition. When the second endothermic peak appeared on the DTA curve, there was no corresponding mass loss on the TG curves, so these endothermic peaks represented the softening of the PVA (at 192 °C) and of the PVP (at 186 °C). Based on these results, a very low temperature, 50 °C was chosen for the ALD depositions.
Figure 3. TG/DTA measurements, (a) PVA in N2; (b) PVP in N2; (c) PVA in air; (d) PVP in air.
2.2. Preparation of the TiO2 Nanotubes
2.2.1. SEM-EDX of the Polymer/TiO2 Core/Shell Nanofibers
After the ALD deposition of 100 nm thick TiO2 layers onto the polymer nanofibers, the composites had the same fibrous structure (Figures 1b and 2b). The polymers did not sof- ten during the exothermic ALD reactions. The overall diameter of the PVA/TiO2 core/shell nanocomposite was about 300–400 nm, while the PVP/TiO2 nanofibers were 600–800 nm.
2.2.2. Thermal Analysis of the Polymer/TiO2 Core/Shell Nanofibers in Air
The core was removed from the core/shell composites by two different methods. For the removal by annealing, first the thermal decomposition of PVA and PVP in air had to be investigated by TG/DTA (Figure 3c,d) The steps were similar in air to the ones in nitro- gen atmosphere. Again, just water evaporated up to 100 °C and then above 230 °C the polymers started to burn, the decomposition of more overlapping steps [30], than in ni- trogen in the case of both polymers. When the polymers were heated in nitrogen, by 600
°C, they did not decompose totally there was some organic char residue that remained;
however, in air by 550 °C both the PVA and the PVP burnt out completely. Based on this, for the removal of the core the following heating program was chosen: the samples were heated by 10 °C/min up to 230 °C and then the heating rate was lowered to 2 °C/min until the temperature reached 550 °C. The lowering of the heating rate was necessary in order to protect the as-formed nanotube structure, otherwise the evolved gases would break up the walls.
Figure 3.TG/DTA measurements, (a) PVA in N2; (b) PVP in N2; (c) PVA in air; (d) PVP in air.
2.2. Preparation of the TiO2Nanotubes
2.2.1. SEM-EDX of the Polymer/TiO2Core/Shell Nanofibers
After the ALD deposition of 100 nm thick TiO2layers onto the polymer nanofibers, the composites had the same fibrous structure (Figures1b and2b). The polymers did not soften during the exothermic ALD reactions. The overall diameter of the PVA/TiO2core/shell nanocomposite was about 300–400 nm, while the PVP/TiO2nanofibers were 600–800 nm.
2.2.2. Thermal Analysis of the Polymer/TiO2Core/Shell Nanofibers in Air
The core was removed from the core/shell composites by two different methods. For the removal by annealing, first the thermal decomposition of PVA and PVP in air had to be investigated by TG/DTA (Figure3c,d) The steps were similar in air to the ones in nitrogen atmosphere. Again, just water eVaporated up to 100◦C and then above 230◦C the polymers started to burn, the decomposition of more overlapping steps [30], than in nitrogen in the case of both polymers. When the polymers were heated in nitrogen, by 600◦C, they did not decompose totally there was some organic char residue that remained;
however, in air by 550◦C both the PVA and the PVP burnt out completely. Based on this, for the removal of the core the following heating program was chosen: the samples were heated by 10◦C/min up to 230◦C and then the heating rate was lowered to 2◦C/min until the temperature reached 550◦C. The lowering of the heating rate was necessary in order to protect the as-formed nanotube structure, otherwise the eVolved gases would break up the walls.
Molecules2021,26, 5917 5 of 12
2.2.3. SEM-EDX of The TiO2Nanotubes
On the SEM images (Figure1c,d and Figure2c,d) it was visible that after annealing the PVA/TiO2and the PVP/TiO2nanocomposites, the core was successfully removed and TiO2nanotubes were formed. These had a wall thickness of about 100 nm. The other way for removing the polymer core was dissolution in water. The SEM images (Figure1e,f and Figure2e,f) showed similar results to the annealed samples, again tubular structures could be seen. The electrospun nanofibers were several centimeters long and the length stayed the same after the ALD depositions as well; however, after either dissolution or annealing, the nanotubes broke into shorter, few micrometer long pieces.
In all the cases the SEM studies were accompanied by EDX measurements (Table1).
After the deposition the EDX spectra showed the presence of a high amount of Ti in the samples. Also, some Cl content was observable, which implicated that a small amount by-product from the TiCl4 precursor remained in the sample. The amount of carbon significantly lowered after both the dissolution and the annealing. Some of the remaining carbon might have come from the double-sided carbon tape, which was used to fix the samples to the sample holders during the measurements. The carbon content was higher after dissolution, than after annealing, which implied that annealing was the more efficient way to remove the polymer core. Also, the TiO2nanotubes prepared from the PVP/TiO2
nanofibers had a lower carbon amount, which can be explained by the wider diameter of these fibers, which made the elimination of the polymer easier from the PVP/TiO2
composite, than from the one containing PVA.
Table 1.EDX results of the composites.
Samples Containing PVA Samples Containing PVA PVA/TiO2 TiO2NTs
Dissolution
TiO2NTs
Annealing PVP/TiO2 TiO2NTs Dissolution
TiO2NTs Annealing C
%
36.4 15.7 6.0 39.0 7.5 4.6
N - - - 7.5 3.3 2.1
O 38.3 45.6 59.1 28.8 49.2 46.5
Cl 2.6 4.3 1.0 3.3 5.1 1.3
Ti 22.7 34.4 33.9 21.4 34.9 45.5
2.2.4. FT-IR Spectroscopy of The TiO2Nanotubes
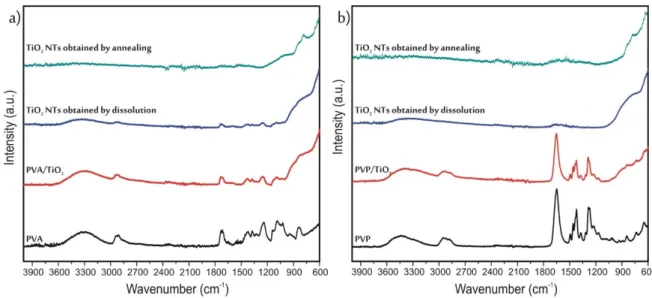
The SEM-EDX results in themselves were not enough to prove that the polymer was completely removed; therefore, the infrared spectra of the samples were also studied (Figure4). First, the spectra of the pure PVA (Figure4a) and PVP (Figure4b) were measured.
In the spectrum of PVA the broad peak between 3100–3500 cm−1referred to the stretching vibrations OH groups, the peaks at 1732 cm−1and 1088 cm−1corresponded to the C=O, while the absorption band at 839 cm−1to C-C bonds. The peaks at 1373 cm−1and 1240 cm−1 were respectively the wagging vibrations of the CH2 and CH groups [31]. In the case of PVP again, the band 3100–3500 cm−1signified the stretching vibrations OH groups. At 1460 cm−1and 1422 cm−1the bending modes of the CH2 groups appeared. The absorption bands at 1649 cm−1, 1285 cm−1and 1271 cm−1corresponded respectively to stretching vibrations of the C=O, C-O and the C-N bonds [32,33]. After the deposition of TiO2onto the polymers, under 900 cm−1the bands referring to TiO2appeared on the spectra, but the peaks of the polymers were still visible as well. In the case of the composites containing PVP, both after dissolution and annealing, the polymer bands completely disappeared from the spectra. Meanwhile, in the case of PVA, after annealing there was no sign of any remaining polymer on the spectra; however, after dissolution there were still some small peaks of the PVA. These results were in correlation with the EDX measurements, the TiO2
Molecules2021,26, 5917 6 of 12
nanotubes obtained by dissolution from the PVA/TiO2nanocomposite had the highest carbon content.
Molecules 2021, 26, 5917 6 of 12
Figure 4. ATR-IR results of the samples prepared from (a) PVA, (b) PVP.
2.2.5. Powder XRD Measurement of the TiO2 Nanotubes
The XRD patterns of the samples were recorded as well (Figure 5). The diffractograms showed that both the PVA (Figure 5a) and the PVP (Figure 5b), as well as the ALD deposited TiO2 were amorphous. After dissolution no peaks appeared on the diffractograms; hence, as expected the TiO2 stayed amorphous. After annealing to 550 °C the TiO2 nanotubes crys- tallized in anatase form, which was identified based on the ICDD database (ICDD-01-075- 2547). There is one small peak at Figure 5a, at ca. 28°, which does not match anatase. It might be due to some trace impurities or minor amount of rutile TiO2 (ICDD 01-88-1175). The av- erage crystallite size of the anatase TiO2 nanotubes prepared from the PVA/TiO2 composite was 35–40 nm, while for the one made from PVP/TiO2 it was 20–25 nm.
Figure 5. XRD patterns of the samples prepared from (a) PVA, (b) PVP (The anatase peaks have been now marked with green circles).
2.2.6. UV-Vis Spectroscopy of the TiO2 Nanotubes
From the UV-Vis spectra of the TiO2 nanotubes (Figure 6) the absorption edges were determined, and from those the band gap energies were calculated [34]. The band gap energy for the samples prepared by dissolution from PVA and PVP were 3.31 eV and 3.15 eV, while for the anatase TiO2 nanotubes synthetized by annealing from PVA and PVP were 3.03 eV and 3.10 eV. It is noted that the bandgap of ALD prepared amorphous TiO2 nanotubes is wider than the corresponding crystalline ones. This might be unexpected at first sight, because crystalline TiO2 is usually tend to have lower concentration of defects, Figure 4.ATR-IR results of the samples prepared from (a) PVA, (b) PVP.
2.2.5. Powder XRD Measurement of the TiO2Nanotubes
The XRD patterns of the samples were recorded as well (Figure5). The diffractograms showed that both the PVA (Figure5a) and the PVP (Figure5b), as well as the ALD deposited TiO2were amorphous. After dissolution no peaks appeared on the diffractograms; hence, as expected the TiO2stayed amorphous. After annealing to 550◦C the TiO2nanotubes crystallized in anatase form, which was identified based on the ICDD database (ICDD-01- 075-2547). There is one small peak at Figure5a, at ca. 28◦, which does not match anatase. It might be due to some trace impurities or minor amount of rutile TiO2(ICDD 01-88-1175).
The average crystallite size of the anatase TiO2nanotubes prepared from the PVA/TiO2
composite was 35–40 nm, while for the one made from PVP/TiO2it was 20–25 nm.
Molecules 2021, 26, 5917 6 of 12
Figure 4. ATR-IR results of the samples prepared from (a) PVA, (b) PVP.
2.2.5. Powder XRD Measurement of the TiO2 Nanotubes
The XRD patterns of the samples were recorded as well (Figure 5). The diffractograms showed that both the PVA (Figure 5a) and the PVP (Figure 5b), as well as the ALD deposited TiO2 were amorphous. After dissolution no peaks appeared on the diffractograms; hence, as expected the TiO2 stayed amorphous. After annealing to 550 °C the TiO2 nanotubes crys- tallized in anatase form, which was identified based on the ICDD database (ICDD-01-075- 2547). There is one small peak at Figure 5a, at ca. 28°, which does not match anatase. It might be due to some trace impurities or minor amount of rutile TiO2 (ICDD 01-88-1175). The av- erage crystallite size of the anatase TiO2 nanotubes prepared from the PVA/TiO2 composite was 35–40 nm, while for the one made from PVP/TiO2 it was 20–25 nm.
Figure 5. XRD patterns of the samples prepared from (a) PVA, (b) PVP (The anatase peaks have been now marked with green circles).
2.2.6. UV-Vis Spectroscopy of the TiO2 Nanotubes
From the UV-Vis spectra of the TiO2 nanotubes (Figure 6) the absorption edges were determined, and from those the band gap energies were calculated [34]. The band gap energy for the samples prepared by dissolution from PVA and PVP were 3.31 eV and 3.15 eV, while for the anatase TiO2 nanotubes synthetized by annealing from PVA and PVP were 3.03 eV and 3.10 eV. It is noted that the bandgap of ALD prepared amorphous TiO2
nanotubes is wider than the corresponding crystalline ones. This might be unexpected at first sight, because crystalline TiO2 is usually tend to have lower concentration of defects, Figure 5.XRD patterns of the samples prepared from (a) PVA, (b) PVP (The anatase peaks have been now marked with green circles).
2.2.6. UV-Vis Spectroscopy of the TiO2Nanotubes
From the UV-Vis spectra of the TiO2nanotubes (Figure6) the absorption edges were determined, and from those the band gap energies were calculated [34]. The band gap energy for the samples prepared by dissolution from PVA and PVP were 3.31 eV and
Molecules2021,26, 5917 7 of 12
3.15 eV, while for the anatase TiO2nanotubes synthetized by annealing from PVA and PVP were 3.03 eV and 3.10 eV. It is noted that the bandgap of ALD prepared amorphous TiO2 nanotubes is wider than the corresponding crystalline ones. This might be unexpected at first sight, because crystalline TiO2is usually tend to have lower concentration of defects, and thus wider bandgap, compared to amorphous TiO2. However, recently it was revealed that the bandgap of amorphous TiO2strongly depended on the Ti:O ratio and on the type of defects in the structure. Certain compositions (preferably partially reduced TiO2with oxygen vacancies) resulted in higher bandgap for amorphous TiO2compared to crystalline TiO2, as revealed both experimentally and by ab initio calculations [35–37].
Molecules 2021, 26, 5917 7 of 12
and thus wider bandgap, compared to amorphous TiO2. However, recently it was re- vealed that the bandgap of amorphous TiO2 strongly depended on the Ti:O ratio and on the type of defects in the structure. Certain compositions (preferably partially reduced TiO2 with oxygen vacancies) resulted in higher bandgap for amorphous TiO2 compared to crystalline TiO2, as revealed both experimentally and by ab initio calculations [35–37].
Figure 6. UV-Vis spectra of the TiO2 nanotubes.
2.2.7. Photocatalysis Study of the TiO2 Nanotubes
Finally, the photocatalytic activity of the samples was investigated by decomposing methyl orange dye under UV light and compared to P25 TiO2, which was used as a refer- ence (Figure 7). The P25 TiO2 decomposed more than 20% of the dye under these circum- stances in 4 h.
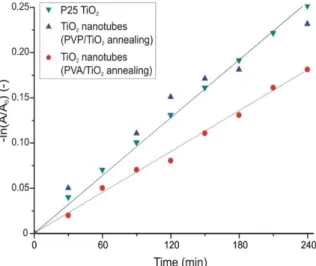
The TiO2 nanotubes that were prepared by annealing from the PVA/TiO2 composite, had almost as good an efficiency, while the nanotubes prepared by annealing from the composite containing PVP as the core, had the same effect as the P25 TiO2. These samples consisted almost completely of anatase TiO2. In the case of the crystalline TiO2 nanotubes the apparent reaction rate constants (kapp) were determined as well assuming pseudo first order kinetics (Figure 8) [38]. The constants for the TiO2 prepared from the PVA composite was 7.3 × 10⁻⁴ min−1, while for the one prepared from the PVP/TiO2 composite and for the P25 TiO2 it was 10.5 × 10⁻⁴ min−1.
Figure 7. Photocatalysis of the TiO2 nanotubes prepared from (a) PVA/TiO2, (b) PVP/TiO2 composite.
Figure 6.UV-Vis spectra of the TiO2nanotubes.
2.2.7. Photocatalysis Study of the TiO2Nanotubes
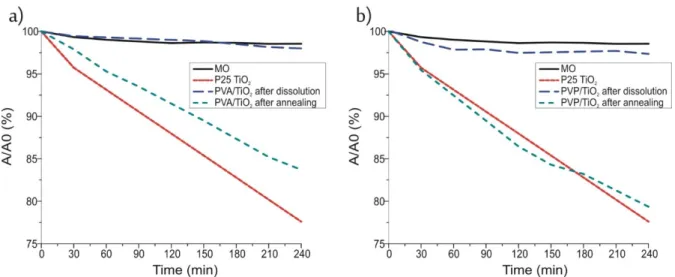
Finally, the photocatalytic activity of the samples was investigated by decomposing methyl orange dye under UV light and compared to P25 TiO2, which was used as a reference (Figure7). The P25 TiO2decomposed more than 20% of the dye under these circumstances in 4 h.
Molecules 2021, 26, 5917 7 of 12
and thus wider bandgap, compared to amorphous TiO2. However, recently it was re- vealed that the bandgap of amorphous TiO2 strongly depended on the Ti:O ratio and on the type of defects in the structure. Certain compositions (preferably partially reduced TiO2 with oxygen vacancies) resulted in higher bandgap for amorphous TiO2 compared to crystalline TiO2, as revealed both experimentally and by ab initio calculations [35–37].
Figure 6. UV-Vis spectra of the TiO2 nanotubes.
2.2.7. Photocatalysis Study of the TiO2 Nanotubes
Finally, the photocatalytic activity of the samples was investigated by decomposing methyl orange dye under UV light and compared to P25 TiO2, which was used as a refer- ence (Figure 7). The P25 TiO2 decomposed more than 20% of the dye under these circum- stances in 4 h.
The TiO2 nanotubes that were prepared by annealing from the PVA/TiO2 composite, had almost as good an efficiency, while the nanotubes prepared by annealing from the composite containing PVP as the core, had the same effect as the P25 TiO2. These samples consisted almost completely of anatase TiO2. In the case of the crystalline TiO2 nanotubes the apparent reaction rate constants (kapp) were determined as well assuming pseudo first order kinetics (Figure 8) [38]. The constants for the TiO2 prepared from the PVA composite was 7.3 × 10⁻⁴ min−1, while for the one prepared from the PVP/TiO2 composite and for the P25 TiO2 it was 10.5 × 10⁻⁴ min−1.
Figure 7. Photocatalysis of the TiO2 nanotubes prepared from (a) PVA/TiO2, (b) PVP/TiO2 composite.
Figure 7.Photocatalysis of the TiO2nanotubes prepared from (a) PVA/TiO2, (b) PVP/TiO2composite.
The TiO2nanotubes that were prepared by annealing from the PVA/TiO2composite, had almost as good an efficiency, while the nanotubes prepared by annealing from the
Molecules2021,26, 5917 8 of 12
composite containing PVP as the core, had the same effect as the P25 TiO2. These samples consisted almost completely of anatase TiO2. In the case of the crystalline TiO2nanotubes the apparent reaction rate constants (kapp) were determined as well assuming pseudo first order kinetics (Figure8) [38]. The constants for the TiO2prepared from the PVA composite was 7.3×10⁻⁴min−1, while for the one prepared from the PVP/TiO2composite and for the P25 TiO2it was 10.5×10⁻⁴min−1.
Molecules 2021, 26, 5917 8 of 12
Figure 8. Kinetics of the photocatalytic reaction of the crystalline TiO2 nanotubes.
The photocatalytic activity of the nanotubes prepared by dissolution, clearly did not reach the activity of the annealed samples, mainly because these contained amorphous TiO2. However, there was a small but detectable effect in the case of the amorphous TiO2 nanotubes prepared from the PVP/TiO2 nanofibers. This was probably not observable in the case of the sample prepared by dissolution from the PVA/TiO2 composite because that contained a higher amount of remaining residue from the PVA core, and its photocatalytic effect could have been split between decomposing the dye and the remaining polymer [39]. Still in the case of the amorphous TiO2 nanotubes prepared from the composite con- taining PVP, the observed photocatalytic activity was an unexpected.
The photocatalytic feature of ALD prepared amorphous TiO2 was first detected when amorphous TiO2 was grown onto lotus leaf by ALD at relatively low temperature [7].
Since then the our group has demonstrated the photocatalytic activity of ALD prepared amorphous TiO2 by several examples using various substrates such as fullerene, carbon aerogel, SiO2 or PMMA nanoparticles, graphene oxide [8,40,41]. For this odd photocata- lytic behavior of ALD grown amorphous TiO2, several possible reasons were assumed, e.g., (1) the coating interacted with the substrate during the photocatalytic reactions, (2) the samples contained nanocrystalline domains or (3) there was a small amount of carbon atoms left over from the ALD precursor (TTIP) in the TiO2 layers. When the photocatalyt- ically inactive SiO2 or PMMA were the substrates, amorphous TiO2 still had photocatalytic effect. Even in these cases, charge separation between the outer layer and the substrate might contribute to the photocatalytic effect; however, here in the case of TiO2 nanotubes the core was completely removed (1). Electron diffraction studies did not reveal nanocrys- talline domains, which were previously not visible by XRD (2). In the present study the Ti precursor was carbon free (unlike e.g., TTIP or TDMAT), therefore there were no carbon impurities in amorphous TiO2. Although Cl might be present, but it is unlikely to account for the same photocatalytic activity as a supposed C content (3).
Very recent studies on [42,43] ALD grown amorphous TiO2 and AL2O3 layers might provide an explanation for our data about the photocatalytic property of low temperature ALD prepared amorphous TiO2. In these studies it was shown that partially reduced, ox- ygen deficient, amorphous, ALD grown TiO2 and Al2O3 layers had oxygen vacancies and increased amount of non-lattice oxygen in their structure. These could successfully trap holes, and this way they decreased the charge recombination and increased the lifetime of photogenerated charge carriers, and contributed to a higher photocatalytic efficiency.
3. Materials and Methods
3.1. Preparation of the Polymer Fibers
Figure 8.Kinetics of the photocatalytic reaction of the crystalline TiO2nanotubes.
The photocatalytic activity of the nanotubes prepared by dissolution, clearly did not reach the activity of the annealed samples, mainly because these contained amorphous TiO2. However, there was a small but detectable effect in the case of the amorphous TiO2
nanotubes prepared from the PVP/TiO2nanofibers. This was probably not observable in the case of the sample prepared by dissolution from the PVA/TiO2composite because that contained a higher amount of remaining residue from the PVA core, and its photocatalytic effect could have been split between decomposing the dye and the remaining polymer [39].
Still in the case of the amorphous TiO2nanotubes prepared from the composite containing PVP, the observed photocatalytic activity was an unexpected.
The photocatalytic feature of ALD prepared amorphous TiO2was first detected when amorphous TiO2 was grown onto lotus leaf by ALD at relatively low temperature [7].
Since then the our group has demonstrated the photocatalytic activity of ALD prepared amorphous TiO2by several examples using various substrates such as fullerene, carbon aerogel, SiO2or PMMA nanoparticles, graphene oxide [8,40,41]. For this odd photocatalytic behavior of ALD grown amorphous TiO2, several possible reasons were assumed, e.g., (1) the coating interacted with the substrate during the photocatalytic reactions, (2) the samples contained nanocrystalline domains or (3) there was a small amount of carbon atoms left over from the ALD precursor (TTIP) in the TiO2layers. When the photocatalytically inactive SiO2 or PMMA were the substrates, amorphous TiO2still had photocatalytic effect. eVen in these cases, charge separation between the outer layer and the substrate might contribute to the photocatalytic effect; however, here in the case of TiO2nanotubes the core was completely removed (1). Electron diffraction studies did not reveal nanocrystalline domains, which were previously not visible by XRD (2). In the present study the Ti precursor was carbon free (unlike e.g., TTIP or TDMAT), therefore there were no carbon impurities in amorphous TiO2. Although Cl might be present, but it is unlikely to account for the same photocatalytic activity as a supposed C content (3).
Very recent studies on [42,43] ALD grown amorphous TiO2and AL2O3layers might provide an explanation for our data about the photocatalytic property of low temperature ALD prepared amorphous TiO2. In these studies it was shown that partially reduced, oxygen deficient, amorphous, ALD grown TiO2and Al2O3layers had oxygen vacancies and increased amount of non-lattice oxygen in their structure. These could successfully
Molecules2021,26, 5917 9 of 12
trap holes, and this way they decreased the charge recombination and increased the lifetime of photogenerated charge carriers, and contributed to a higher photocatalytic efficiency.
3. Materials and Methods
3.1. Preparation of the Polymer Fibers
The poly(vinyl alcohol) (PVA) and the poly(vinylpyrrolidone) (PVP) fibers were prepared by electrospinning, both from their aqueous solutions. For the electrospinning of the PVA fibers 0.4 g of the solid poly(vinyl alcohol) was dissolved in 4 cm3of distilled water. The PVP solution was prepared by dissolving 1.1 g of poly(vinylpyrrolidone) in 4 cm3of distilled water. The PVA solution was stirred for 4 h, while the PVP solution for 24 h, both at room temperature. For the electrospinning, the solutions were transferred into a plastic syringe, which was connected to the needle tip by polymer tubing. The applied voltage was 20 kV and a feeding rate of 0.5 cm3/h was used. The nanofibers were collected on aluminum foil, which was covered with a polypropylene fabric. The fabric was applied, because it was easier to remove the fiber mats from them without damaging the polymer nanofibers.
3.2. Thermal Analysis of the Polymer Fibers
Before the atomic layer deposition of TiO2could be done, it had to be determined what deposition temperature could be used, so that the polymers would not soften. For this the thermal properties of both the PVA and PVP were investigated in inert atmo- sphere, which simulates the circumstances of the ALD reactor better (nitrogen, flow rate:
130 cm3/min). The thermal analysis was also carried out in oxidative atmosphere (air, flow rate: 130 cm3/min) to determine what annealing temperature is needed to totally remove the polymer core. Both measurements were done in a TA Instruments SDT 2960 simultaneous TG/DTA equipment, the polymers were heated with 10◦C/min heating rate to 600◦C in Pt crucibles.
3.3. Atomic Layer Deposition of the TiO2Layer
The TiO2thin films were prepared by atomic layer deposition from titanium tetrachlo- ride (TiCl4) and H2O precursors in a Beneq TFS-200-186 reactor. The pulse time for both precursors was 0.2 s, which was followed by a 3 s nitrogen purge. The layers were grown in 1400 cycles at 50◦C. The theoretical thickness (100 nm) was confirmed by profilometer (AMBIOS XP-I) after the deposition.
3.4. Preparation of the TiO2Nanotubes
The removal of the PVA and PVP polymer cores was done by two different methods.
Both the PVA and the PVP are water-soluble; thus, one approach was dissolution. For this the samples were put into 60◦C water for 2 h. The sample could not have been stirred, because it would have damaged the nanotubes; hence, the adequate efficiency of the dissolution was achieved by changing the solvent eVery 30 min. The other method for removing the polymer was annealing, which was done in a TA Instruments SDT 2960 simultaneous TG/DTA instrument. The composites were annealed to 550◦C. At around 230◦C the more intense decomposition of the polymers started; thus, until that temperature the heating rate was 10◦C/min, but after reaching it, the heating rate was lowered to 2◦C/min to avoid the cracking of the oxide walls.
3.5. Characterization
The morphology of all the samples was studied by scanning electron microscopy (SEM) with a JEOL JSM-5500LV microscope. The samples were coated by a thin Au/Pd layer in a sputter coater before the measurements were carried out. The composition of the samples was also studied by energy dispersive X-ray (EDX) analysis, the measurements were done at 20 kV. High resolution images were recorded by a LEO 1540 XB scanning electron microscope.
Molecules2021,26, 5917 10 of 12
The powder XRD patterns were recorded with a PANalytical X’pert Pro MPD X-ray diffractometer using Cu Kαirradiation. The crystallite sizes were calculated based on the Scherrer-equation.
The FT-IR spectra were studied by a Bruker Tensor 37 IR spectrometer equipped with a Goldengate SpecAC ATR head.
The UV-Vis spectra were recorded on an Avantes AvaSpec-2048 spectrophotometer in reflectance mode, using Teflon background.
Finally, the photocatalytic activity of the samples was investigated by decomposing 0.04 mM aqueous solution of methyl orange (MO) dye under UV irradiation. For the measurements 1 mg of the samples was put into 3 cm3 of the MO solution in quartz cuvettes. Before the UV illumination, the samples were kept in the dark for 2 h to reach the adsorption equilibrium. After that they were illuminated for 4 h by two parallel UV lamps (Osram blacklight, 18 W, UV-A) that were placed 5–5 cm from the sample.
The measured wavelength of the lamp is between 350–390 nm (maximum intensity at 375 nm), and the estimated power at the samples is 0.5 W. The UV-Vis spectra of the MO were measured eVery 30 min by a Jasco V-550 UV-Vis spectrophotometer. The relative absorbance values were determined at the 464 nm absorption peak of the MO and plotted versus time. As a reference the samples were compared to P25 TiO2(Aeroxide) measured under the same conditions.
4. Conclusions
The photocatalytic properties of TiO2nanotubes were investigated in this work. For this, at first, PVA and PVP nanofibers were prepared by electrospinning; and then these were coated with TiO2layers by atomic layer deposition (ALD). The polymer core was removed from the PVA/TiO2and PVP/TiO2nanocomposites by two different methods, dissolution and annealing. This gave the opportunity to compare amorphous and crys- talline TiO2nanotubes with the same dimensions and morphology. After the samples were annealed, the TiO2crystallized in anatase phase, and the nanotubes prepared from both PVA and PVP had a good photocatalytic efficiency, reaching that of P25. Regarding the dissolution, as expected, the TiO2shell stayed amorphous. However, in the case of the nanotubes prepared from the composite containing PVP, the samples showed a small but detectable photocatalytic effect.
Hence, the photocatalytic property of amorphous TiO2grown by ALD is now con- firmed by using substrate free amorphous TiO2layers, i.e., by the as-prepared amorphous TiO2nanotubes of the present study, complementing our previous data about amorphous ALD TiO2deposited onto various substrates. It seems that the possible partially reduced structure of ALD grown oxides (especially oxygen vacancies and non-lattice oxygens) might be the key, and with them the photocatalytic property of amorphous TiO2can be successfully explained.
It is suggested that these observations can open a very new field for various ALD prepared amorphous oxides (e.g., ZnO, ZrO2, SnO2, WO3, MoO3, etc.) as effective photo- catalysts. The optimal layer thickness, composition, etc. have to be investigated further for each oxide, and more insight is needed into the occurring phenomena as well. It is also supposed that other synthesis methods (e.g., sol-gel, hydrothermal, sputtering, etc.) can also yield similarly active photocatalytic amorphous oxides. These can lead to novel applications and products, e.g., coating highly structured heat sensitive substrates with cheap, biocompatible, self-cleaning, ultrathin films.
Author Contributions:Conceptualization, I.M.S. and O.K.; methodology, O.K., E.K., D.A.K., Z.K.N., B.P., Z.E., A.S. and K.H.; resources, I.M.S., Z.E. and K.H.; writing—original draft preparation, O.K.;
writing—review and editing, O.K., E.K., D.A.K., Z.K.N., B.P., Z.E., A.S., K.H. and I.M.S.; visualization, O.K. All authors have read and agreed to the published version of the manuscript.
Funding:An NRDI K 124212 and an NRDI TNN_16 123631 grant are acknowledged. The research within project No. VEKOP-2.3.2-16-2017-00013 was supported by the European Union and the State
Molecules2021,26, 5917 11 of 12
of Hungary, co-financed by the European Regional Development Fund. The research reported in this paper and carried out at BME has been supported by the NRDI Fund TKP2021 BME-NVA based on the charter of bolster issued by the NRDI Office under the auspices of the Ministry for Innovation and Technology. The research was supported by the Thematic Excellence Programme (TKP2020-IKA-04) of the Ministry for Innovation and Technology in Hungary.
Conflicts of Interest:The authors declare no conflict of interest.
Sample Availability:Samples of the compounds are not available from the authors.
References
1. Grätzel, M. Photoelectrochemical cells.Nature2001,414, 338–344. [CrossRef] [PubMed]
2. Zhu, S.; Wang, D. Photocatalysis: Basic Principles, Diverse Forms of Implementations and Emerging Scientific Opportunities.
Adv. Energy Mater.2017,7, 1700841. [CrossRef]
3. Hoffmann, M.R.; Martin, S.T.; Choi, W.; Bahnemann, D.W. Environmental Applications of Semiconductor Photocatalysis.Chem.
Rev.1995,95, 69–96. [CrossRef]
4. Assadi, M.H.N.; Hanaor, D.A.H. The effects of copper doping on photocatalytic activity at (101) planes of anatase TiO2: A theoretical study.Appl. Surf. Sci.2016,387, 682–689. [CrossRef]
5. Doustkhah, E.; Assadi, M.H.N.; Komaguchi, K.; Tsunoji, N.; Esmat, M.; Fukata, N.; Tomita, O.; Abe, R.; Ohtani, B.; Ide, Y. In situ Blue titania via band shape engineering for exceptional solar H2production in rutile TiO2.Appl. Catal. B2021,297, 120380.
[CrossRef]
6. Di Paola, A.; Bellardita, M.; Palmisano, L.; Group, S.P.; Energia, D.; Informazione, I. Brookite, the Least Known TiO2Photocatalyst.
Catalysts2013,3, 36–73. [CrossRef]
7. Szilágyi, I.M.; Teucher, G.; Härkönen, E.; Färm, E.; Hatanpää, T.; Nikitin, T.; Khriachtchev, L.; Räsänen, M.; Ritala, M.; Leskelä, M.
Programming nanostructured soft biological surfaces by atomic layer deposition.Nanotechnology2013,24, 245701. [CrossRef]
8. Justh, N.; Firkala, T.; László, K.; Lábár, J.; Szilágyi, I.M. Photocatalytic C60-amorphous TiO2composites prepared by atomic layer deposition.Appl. Surf. Sci.2017,419, 497–502. [CrossRef]
9. Huang, J.; Liu, Y.; Lu, L.; Li, L. The photocatalytic properties of amorphous TiO2composite films deposited by magnetron sputtering.Res. Chem. Intermed.2011,38, 487–498. [CrossRef]
10. Jallouli, N.; Pastrana-martínez, L.M.; Ribeiro, A.R.; Moreira, N.F.F.; Faria, J.L.; Hentati, O.; Silva, A.M.T.; Ksibi, M. Heterogeneous photocatalytic degradation of ibuprofen in ultrapure water, municipal and pharmaceutical industry wastewaters using a TiO2/UV-LED system.Chem. Eng. J.2018,334, 976–984. [CrossRef]
11. Wang, W.; Chen, H.; Fang, J.; Lai, M. Large-scale preparation of rice-husk-derived mesoporous SiO2@TiO2as efficient and promising photocatalysts for organic contaminants degradation.Appl. Surf. Sci.2019,467, 1187–1194. [CrossRef]
12. Sreeja, S.; Shetty, K.V. Photocatalytic water disinfection under solar irradiation by Ag@TiO2core-shell structured nanoparticles.
Sol. Energy2017,157, 236–243. [CrossRef]
13. Baruah, S.; Najam, M.; Joydeep, K. Perspectives and applications of nanotechnology in water treatment.Environ. Chem. Lett.2016, 14, 1–14. [CrossRef]
14. Krishna, M.G.; Vinjanampati, M.; Purkayastha, D.D. Metal oxide thin films and nanostructures for self-cleaning applications:
Current status and future prospects.Eur. Phys. J. Appl. Phys.2013,62, 1–12. [CrossRef]
15. Gholami, A.; Alemrajabi, A.A.; Saboonchi, A. Experimental study of self-cleaning property of titanium dioxide and nanospray coatings in solar applications.Sol. Energy2017,157, 559–565. [CrossRef]
16. Yu, H.; Song, L.; Hao, Y.; Lu, N.; Quan, X.; Chen, S.; Zhang, Y.; Feng, Y. Fabrication of pilot-scale photocatalytic disinfection device by installing TiO2coated helical support into UV annular reactor for strengthening sterilization. Chem. Eng. J.2016, 283, 1506–1513. [CrossRef]
17. Chen, L.; He, F.; Huang, Y.; Meng, Y.; Guo, R. Hydrogenated nanoporous TiO2film on Ti-25Nb-3Mo-2Sn-3Zr alloy with enhanced photocatalytic and sterilization activities driven by visible light.J. Alloys Compd.2016,678, 5–11. [CrossRef]
18. Kite, S.V.; Sathe, D.J.; Patil, S.S.; Bhosale, P.N.; Garadkar, K.M. Nanostructured TiO2 thin films by chemical bath deposition method for high photoelectrochemical performance.Mater. Res. Express2018,6, 026411. [CrossRef]
19. Krysiak, O.A.; Barczuk, P.J.; Bienkowski, K.; Wojciechowski, T.; Augustynski, J. The photocatalytic activity of rutile and anatase TiO2electrodes modified with plasmonic metal nanoparticles followed by photoelectrochemical measurements.Catal. Today2019, 321, 52–58. [CrossRef]
20. Gleiter, H. Nanostructured Materials: Basic Concepts and Mictrostructure.Acta Mater.2000,48, 1–29. [CrossRef]
21. Dhand, C.; Dwivedi, N.; Loh, J.; Jie, N. Methods and strategies for the synthesis of diverse nanoparticles and their applications.
RSC Adv.2015,5, 105003–105037. [CrossRef]
22. Mussa Farkhani, S.; Valizadeh, A. Electrospinning and electrospun nanofibres.IET Nanobiotechnol.2014,8, 83–92. [CrossRef]
23. Thenmozhi, S.; Dharmaraj, N.; Kadirvelu, K.; Kim, H.Y. Electrospun nanofibers: New generation materials for advanced applications.Mater. Sci. Eng. B Solid-State Mater. Adv. Technol.2017,217, 36–48. [CrossRef]
Molecules2021,26, 5917 12 of 12
24. Boyadjiev, S.I.; Kéri, O.; Bárdos, P.; Firkala, T.; Gáber, F.; Nagy, Z.K.; Baji, Z.; Takács, M.; Szilágyi, I.M. TiO2/ZnO and ZnO/TiO2
core/shell nanofibers prepared by electrospinning and atomic layer deposition for photocatalysis and gas sensing.Appl. Surf. Sci.
2017,424, 190–197. [CrossRef]
25. Szilágyi, I.M.; Santala, E.; Heikkilä, M.; Pore, V.; Kemell, M.; Nikitin, T.; Teucher, G.; Firkala, T.; Khriachtchev, L.; Räsänen, M.;
et al. Photocatalytic Properties of WO3/TiO2Core/Shell Nanofibers prepared by Electrospinning and Atomic Layer Deposition.
Chem. Vap. Depos.2013,19, 149–155. [CrossRef]
26. Kéri, O.; Kocsis, E.; Nagy, Z.K.; Parditka, B.; Erdélyi, Z.; Szilágyi, I.M. Preparation of Al2O3coated PVA and PVP nanofibers and Al2O3nanotubes by electrospinning and atomic layer deposition.Rev. Roum. Chim.2018,63, 401–406.
27. George, S.M. Atomic layer deposition: An overview.Chem. Rev.2010,110, 111–131. [CrossRef]
28. Liu, M.; Li, X.; Karuturi, S.K.; Tok, A.I.Y.; Fan, H.J. Atomic layer deposition for nanofabrication and interface engineering.
Nanoscale2012,4, 1522–1528. [CrossRef]
29. Szilágyi, I.M.; Nagy, D. Review on one-dimensional nanostructures prepared by electrospinning and atomic layer deposition.
J. Phys. Conf. Ser.2014,559, 012010. [CrossRef]
30. Betti, N.A. Thermogravimetric Analysis on PVA/PVP Blend Under Air Atmosphere.Eng. Technol. J.2016,34, 2433–2441.
31. Alghunaim, N.S. Optimization and spectroscopic studies on carbon nanotubes/PVA nanocomposites. Results Phys. 2016, 6, 456–460. [CrossRef]
32. Szilágyi, I.M.; Santala, E.; Kemell, M.; Nikitin, T.; Khriachtchev, L.; Räsänen, M.; Ritala, M. Thermal study on electrospun polyvinylpyrrolidone/ammonium metatungstate nanofibers: Optimising the annealing conditions for obtaining WO3nanofibers.
J. Therm. Anal. Calorim.2011,105, 73–81. [CrossRef]
33. Jovanocic, Z.; Radosavljevic, A.; Siljegovic, M.; Bibic, N.; Miskovic-Stankovic, V.Z. Kacarevic-Popovic, Structural and optical characteristics of silver/poly(N-vinyl-2-pyrrolidone) nanosystems synthesized by g-irradiation. Radiat. Phys. Chem. 2012, 81, 1720–1728. [CrossRef]
34. Tauc, J.; Scott, T.A. The Optical Propeties of Solids.Phys. Today1967,20, 105–107. [CrossRef]
35. Hannula, M.; Ali-Löytty, H.; Lahtonen, K.; Sarlin, E.; Saari, J.; Valden, M. Improved stability of atomic layer deposited amorphous TiO2photoelectrode coatings by thermally induced oxygen defects.Chem. Mater.2018,30, 1199–1208. [CrossRef] [PubMed]
36. Valencia, S.; Marín, J.M.; Restrepo, G. Study of the bandgap of synthesized titanium dioxide nanoparticules using the sol-gel method and a hydrothermal treatment.Open Mater. Sci. J.2010,4, 9–14. [CrossRef]
37. Deskins, T.N.A.; Dub, J.; Raoc, P. The structural and electronic properties of reduced amorphous titania.Phys. Chem. Chem. Phys.
2017,19, 18671–18684. [CrossRef]
38. Yu, Y.; Yu, J.C.; Yu, J.; Kwok, Y.; Che, Y.; Zhao, J.; Ding, L.; Ge, W.; Wong, P. Enhancement of photocatalytic activity of mesoporous TiO2by using carbon nanotubes.Appl. Catal. A Gen.2005,289, 186–196. [CrossRef]
39. Hsu, L.; Lee, L.; Lin, C. Adsorption and photocatalytic degradation of polyvinyl alcohol in aqueous solutions using P-25 TiO2. Chem. Eng. J.2011,173, 698–705. [CrossRef]
40. Justh, N.; Mikula, G.J.; Bakos, L.P.; Nagy, B.; László, K.; Parditka, B.; Erdélyi, Z.; Takáts, V.; Mizsei, J.; Szilágyi, I.M. Photocatalytic properties of polymer/TiO2and carbon/TiO2aerogel composites prepared by atomic layer deposition.Carbon2019,146, 476–482.
[CrossRef]
41. Kéri, O.; Kócs, L.; Hórvölgyi, Z.; Kárpáti, L.; Baji, Z.; Szilágyi, I.M. Photocatalytic amorphous and crystalline TiO2prepared by atomic layer deposition.Period. Polytech. Chem. Eng.2019,63, 378–387. [CrossRef]
42. Hussien, M.S.A.; Shenouda, S.S.; Parditka, B.; Csík, A.; Erdélyi, Z. Enhancement of Urbach’s energy and non-lattice oxygen content of TiO1.7ultra-thin films for more photocatalytic activity.Ceram. Int.2020,46, 15236–15241. [CrossRef]
43. Shenouda, S.S.; Hussien, M.S.A.; Parditka, B.; Csík, A.; Takats, V.; Erdélyi, Z. Novel amorphous Al-rich Al2O3ultra-thin films as active photocatalysts for water treatment from some textile dyes.Ceram. Int.2020,46, 7922–7929. [CrossRef]