econstor
Make Your Publications Visible.
A Service of
zbw
Leibniz-InformationszentrumWirtschaft
Leibniz Information Centre for Economics
Hajdu, Gábor
Working Paper
Perceived income inequality and subjective social status in Europe
GLO Discussion Paper, No. 926
Provided in Cooperation with:
Global Labor Organization (GLO)
Suggested Citation: Hajdu, Gábor (2021) : Perceived income inequality and subjective social status in Europe, GLO Discussion Paper, No. 926, Global Labor Organization (GLO), Essen
This Version is available at:
http://hdl.handle.net/10419/240434
Standard-Nutzungsbedingungen:
Die Dokumente auf EconStor dürfen zu eigenen wissenschaftlichen Zwecken und zum Privatgebrauch gespeichert und kopiert werden.
Sie dürfen die Dokumente nicht für öffentliche oder kommerzielle Zwecke vervielfältigen, öffentlich ausstellen, öffentlich zugänglich machen, vertreiben oder anderweitig nutzen.
Sofern die Verfasser die Dokumente unter Open-Content-Lizenzen (insbesondere CC-Lizenzen) zur Verfügung gestellt haben sollten, gelten abweichend von diesen Nutzungsbedingungen die in der dort genannten Lizenz gewährten Nutzungsrechte.
Terms of use:
Documents in EconStor may be saved and copied for your personal and scholarly purposes.
You are not to copy documents for public or commercial purposes, to exhibit the documents publicly, to make them publicly available on the internet, or to distribute or otherwise use the documents in public.
If the documents have been made available under an Open Content Licence (especially Creative Commons Licences), you may exercise further usage rights as specified in the indicated licence.
www.econstor.eu
Perceived income inequality and subjective social status in Europe
Gábor Hajdu
Institute for Sociology, Centre for Social Sciences, Hungary e-mail: hajdu.gabor@tk.hu
ORCID: 0000-0002-7943-1668
Abstract
This paper analyzes how perceived income inequality is associated with subjective well-being.
Using four waves of the “Social Inequality” module of the International Social Survey Programme, I show that the higher the level of perceived income inequality is, the lower the individual’s perception of her social standing, even if objective income inequality and preferences for the legitimate level of income inequality are controlled for. The results are robust to the measure of perceived inequality and the choice of the outcome variable. The analysis also provides evidence that the estimated association is weaker for individuals with higher income, higher education, and countries without postcommunist history. Overall, the results suggest that not only do objective inequality and perception of fairness have consequences regarding subjective well-being but also the perceived level of income inequality itself.
Keywords: inequality perception, income inequality, subjective social status, subjective well- being
JEL codes: D31, D63, I31, J31
Funding
This work was supported by the Hungarian National Research, Development and Innovation Office – NKFIH (grant no. FK 134447). Gábor Hajdu was supported by the János Bolyai Research Scholarship of the Hungarian Academy of Sciences. The funders had no role in study design, data collection and analysis, decision to publish, or preparation of the manuscript.
1 1. Introduction
Social inequalities have numerous adverse effects (Wilkinson and Pickett, 2009, 2018). For example, income inequality is positively associated with crime (Choe, 2008; Kelly, 2000;
Scorzafave and Soares, 2009) and the likelihood of radical right support (Engler and Weisstanner, 2021) and negatively associated with health (Kaplan et al., 1996; Kondo et al., 2009; Pickett and Wilkinson, 2015; Wilkinson and Pickett, 2006), trust (Gustavsson and Jordahl, 2008; Knack and Keefer, 1997), and social mobility (Browman et al., 2019; Chetty et al., 2014; Corak, 2013; Kearney and Levine, 2016). Studies on the relationship between income inequality and subjective well-being have found mixed results (for a review, see Schneider, 2016). On the other hand, papers analyzing the association of a reduction in income inequality or redistribution with subjective well-being suggest that a reduction in inequality has a positive effect on well-being (Cheung, 2018; Hajdu and Hajdu, 2014).
Much less attention is given to the role of subjective or perceived income inequality, although there is evidence that the perception of circumstances is at least as important as the objective circumstances regarding well-being (Brown et al., 2008; Dolan et al., 2008; Layard et al., 2010;
Tan et al., 2020; Wolbring et al., 2013) and that perceived inequality is not a pure mirror of objective inequality but is the result of individuals’ perceptions of a real situation (Schneider, 2012). Moreover, numerous studies have shown that people’s beliefs about income inequality are fairly inaccurate (Cruces et al., 2013; Gimpelson and Treisman, 2018; Hauser and Norton, 2017; Kuhn, 2020). Experimental studies have also provided evidence that minor information treatments about the true income distribution or income inequality have large effects on job satisfaction (Card et al., 2012), the differences in well-being between richer and poorer individuals (Perez-Truglia, 2020), and views about inequality (Kuziemko et al., 2015), which also suggests that people have biased perceptions of the level of income inequality.
2
According to Clark and D’Ambrosio (2015), there are two channels through which income inequality can affect individual well-being. The first is the individual’s normative evaluation of income inequality, which is a disinterested preference for the ideal distribution of income. In other words, the individual can evaluate the level of income inequality as unfair or fair regardless of her own income. The second is a self-interested evaluation where the individual compares herself to others, and income inequality affects how much richer or poorer she is compared to her reference group. Schneider (2019) posits that self-perception of social status is affected by income inequality through two mechanisms that are similar to the self-interested evaluation and are based on relative deprivation or relative income theory (Merton and Rossi, 1968; Runciman, 1966; Stouffer, 1949; Yitzhaki, 1979). First, a higher level of income inequality means that incomes are shifting apart, and in the presence of upward comparison, a discrepancy between the individual’s income and the reference income is higher. In other words, a higher level of income inequality may increase the feeling of relative deprivation and therefore may lower subjective social status. Increased inequalities may have negative effects on richer individuals if they perceive a higher chance of moving down in the income ladder or a higher risk of a potential moving down (Alesina et al., 2004). Second, income inequality may increase the frequency of social comparison and may increase the salience of people with high income, which results in stronger effects of upward social comparison (Cheung and Lucas, 2016; Sommet et al., 2019).
Empirical evidence supports these assumptions. Income inequality is reported to be negatively associated with subjective social status (Lindemann and Saar, 2014; Schneider, 2019) and status anxiety (Layte and Whelan, 2014) in cross-national samples of European countries. Andersen and Curtis (2012) show that household income has a stronger effect on subjective social position in societies with a high level of income inequality compared to more equal societies. A possible explanation of the results is that if income inequality is high, people are more likely to perceive
3
social differences. Direct Google searching for terms “economic inequality” and “income inequality” and tweeting about inequality are more frequent in more economically unequal U.S.
states (Sánchez-Rodríguez and Moreno-Bella, 2021). This suggests that individuals who live in regions with higher income inequality are more interested in this inequality which can make social inequalities to be more “visible” and social comparison to be more important. The frequency of social comparison has relevance in itself since there is empirical evidence that individuals who consider income comparison important report a lower level of well-being (Clark and Senik, 2010; Goerke and Pannenberg, 2015). Income inequality affects not only the frequency of social comparison but also aspiration levels. Frank (2007) argues that rising inequality increases aspirations, i.e., it alters the frame of reference that defines what is considered necessary or desirable to have a good life. Winkelmann and Winkelmann (2010) directly test this assumption and show that increased inequality raises the amount of income that individuals think is necessary to make ends meet. Studies focusing on online activities found that Google searches for positional goods and tweets mentioning luxury brands are more frequent in countries and US states with higher income inequality (Walasek et al., 2018;
Walasek and Brown, 2015, 2016).
Empirical evidence regarding perceived income inequality and subjective well-being is scarce.
Most of the few studies conducted have focused on preferences toward income inequality rather than the perception of the level of income inequality (e.g. Beja, 2014; Oshio and Urakawa, 2014). In relatively small-scale experiments, the perception of inequality was manipulated by giving participants information about income or earning distributions that were relevant in the contexts of the experiments. Payne et al. (2017) conducted an experiment in which participants received information about a gambling task. Perceived inequality was manipulated by showing the distribution of previous players’ earnings separated into thirds by average earnings.
According to their results, the subjective relative deprivation of the participants was higher in
4
the high-inequality condition than in the low-inequality condition. Sánchez-Rodríguez et al.
(2019) asked participants to imagine they were going to live in a new society that had three income groups. Participants were assigned to the middle group. Income inequality was manipulated by changing the average earnings of the top and bottom groups. Similar to the other experiment, participants in the high economic inequality condition felt more relatively deprived. I know of only one paper, however, that explicitly analyzes the relationship between perceptions of income inequality and well-being focusing only on a single country. Schneider (2012), using cross-sectional German data from 2006, found that perceived income inequality is not associated with the life satisfaction of the respondents, but the discrepancy between preferred inequality and perceived inequality correlates negatively with life satisfaction.
In this paper, I analyze the relationship between perceived income inequality and subjective well-being. More specifically, I estimate the association between individuals’ subjective perceptions of income inequality and their subjective social status. In contrast to previous studies, I use repeated cross-national surveys (four waves of the ISSP) that cover 28 countries and almost 70,000 individuals. I use a measure of subjective inequality perception that is similar to the conventional Gini coefficient (Kuhn, 2011, 2015, 2019). Additionally, using two alternative measures of perceived income inequality, I show that the results are robust to the choice of the inequality measure. This study contributes to the small literature on inequality perception and well-being by providing evidence on the negative effect of perceived income inequality on subjective well-being (subjective social status) using a large dataset and specifications that include a full set of country × year fixed effects controlling indirectly for the level of objective income inequality. Although previous papers found that objective income inequality is negatively associated with subjective social status, there is no empirical evidence regarding the perception of income inequality. I also show that, in line with previous studies on
5
objective inequality and subjective well-being, there is substantial heterogeneity in the results with regard to income, education, and the postcommunist history of the country.
The paper is structured as follows. The next section presents the data and the empirical strategy.
Section 3 shows the results. Section 3.1 presents the robustness tests, and Section 3.2 explores the heterogeneity of the results. Section 4 concludes the paper.
2. Data and empirical strategy
2.1. Data
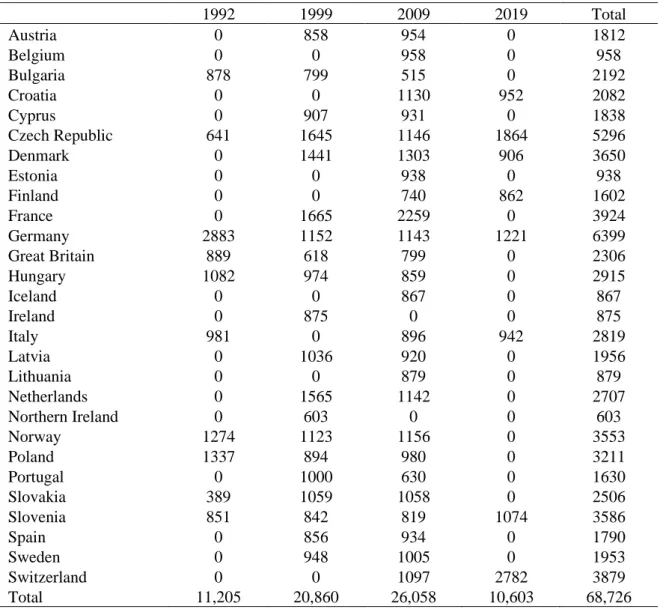
I use four waves (1992, 1999, 2009, 2019) of the “Social Inequality” module of the International Social Survey Programme (ISSP Research Group, 1994, 2002, 2017, 2021).1 This cross- national dataset covers 28 European countries and more than 80,000 individuals. I restricted the sample to respondents aged 18 years and older. Respondents with missing subjective social status and perceived inequality were excluded. I also excluded respondents with missing demographic characteristics (age and sex). The final sample size was 68,726.2
The main outcome variable is subjective social status. It is measured on a 10-point scale in which respondents were asked to locate their position in society from 1 (bottom of society) to 10 (top of society).3
I use the measure of perceived income inequality at the level of the individual proposed by Kuhn (2011, 2015, 2019). This measure of inequality perception is calculated and interpreted similarly to the conventional Gini coefficient based on objective data on wages. It is based on questions that ask respondents to estimate the earnings of people working in different
1 For 1999, separate datasets of Denmark (Andersen et al., 2014), Ireland (Nic Ghiolla Phádraig, 2014) and the Netherland (Becker and Niggebrugge, 2014) are included. For 2009, separate dataset of the Netherlands (Ganzeboom, 2015) is included.
2 The number of observations by country and wave is shown in Table B1 in the Supplementary Materials.
3 The exact wording of the questions is given in the Supplementary Materials (Section A).
6
occupations. I use respondents’ earning estimations for five occupations (doctor, chairman of a large national corporation, cabinet minister in the national government, shop assistant, unskilled worker in a factory) that are available in all four waves. The occupations are divided into two groups: occupations representing the bottom and the top group of wage earners. The former, blue-collar occupations consist of shop assistant and unskilled worker. The latter, white-collar occupations consist of doctor, chairman, and cabinet minister. Perceived income inequality at the level of the individual is calculated as follows:
( ) ( )
P P
ict ct ict
I = f bottom −q bottom , (1)
where f bottom( )ct denotes the population share of the bottom occupation group in country c at time t, and qictP (bottom) denotes the respondents’ perceived income share of the bottom occupation group in country c at time t.4 The perceived income share of the bottom occupation group is estimated as follows:
ˆ ( ) ( )
( )
ˆ ( ) ( ) ˆ ( ) ( )
P
P ict
ict P P
ict ict
y bottom f bottom q bottom
y bottom f bottom y top f top
=
+ (2)
In sum, differences in perceived income inequality (or perceived Gini) reflect differences in the individuals’ average income estimates for blue-collar and white-collar jobs. (See Appendix A in the Supplementary Materials for additional details regarding the calculation.)
Respondents were also asked how much should earn people working in the five occupations. I use these answers to measure the preferred level of inequality. The calculation of the preferred level of inequality (or legitimate Gini) is identical to that of perceived income inequality.5
4 The share of the bottom group is estimated from the sample as the share of respondents working in occupations with ISCO major groups 3 to 9. This implies that while the income share is individual-specific, the population share of bottom group is constant in country c at time t.
5 Theoretically, both perceived and legitimate Gini can be negative if an individual estimates larger relative income share for the bottom occupation group than for the top group. However, only 1.05% of the sample has negative
7
The summary statistics of the variables used in the analysis are provided in Table B2 (Supplementary Materials).
2.2. Empirical strategy
First, I estimate the following equation via ordinary least squares:
0 1
P
ict ict ict ct ict
Y = +I +X + + (3)
where Yict denotes the subjective social status of individual i, who lives in country c at time t.
P
Iict denotes an individual’s perceived level of income inequality in country c at time t. Xirt is a vector of the personal characteristics of individual i: age, squared age, sex, education, legal marital status, labor market status, occupation (ISCO major groups), frequency of attendance at religious services, household size, family income, type of settlement, and father’s occupation (ISCO major groups). The inclusion of control variables other than basic demographic variables is important since both perceived inequality and subjective social status are supposed to be correlated with an individual’s objective social status and economic resources (Bavetta et al., 2019). By including income, occupation, labor market status, education, and family background (household size, father’s occupation), we can measure the association between subjective social status and perceived inequality beyond objective socioeconomic status. Country × year fixed effects (ct) are included to control for differences between countries and years.6 These fixed effects identify the differences between countries and years in the objective level of income inequality and in other unobserved variables.
In the next step, I include the preferred or legitimate level of income inequality in the model.
An individual’s preferred level of income inequality may have an impact on her subjective well-
value on at least one of the two measures. These observations were excluded. The conclusions do not change if observations with negative perceived or legitimate Gini are included in the sample.
6 I use the year when the survey was conducted.
8
being, for example, because those who prefer larger income inequality may care less about income disparities (Schneider, 2012). Additionally, the inclusion of the legitimate level of inequality can reveal how the discrepancy between perceived and preferred income inequality is associated with subjective status. I estimate the following equation:
0 1 2
P L
ict ict ict ict ct ict
Y = +I + I +X + + (4)
where individual preferences for the legitimate level of income inequality (IictL ) are controlled for.
I use poststratification weights provided by the ISSP. The standard errors are robust to heteroskedasticity and clustered at the country-year level. The key coefficient is 1, which shows how perceived income inequality is associated with subjective social status. Negative point estimation of 1 shows that the higher the level of perceived income inequality is, the lower the subjective social status.
3. Results
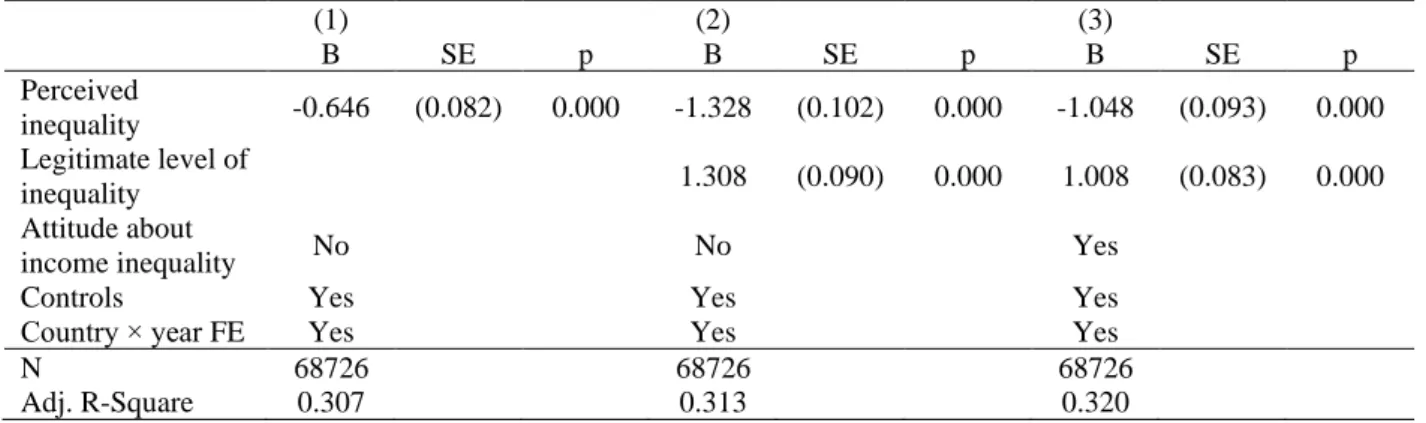
Table 1 reports the estimates of Eq. 3 and Eq. 4. The estimate reported in the first column shows that perceived income inequality is negatively associated with subjective social status. The estimated coefficient is −0.646, which means that a one standard deviation change in perceived inequality is associated with a decrease of 0.092 points in subjective social status. This corresponds to a 5.2% standard deviation decrease in subjective status. In the second column, the legitimate level of income inequality is controlled for. The estimated coefficient on perceived inequality is larger ( ˆ = −1.328), which shows that a one standard deviation change in perceived inequality is associated with a 0.189 point decrease in subjective social status. This is a substantively large 10.8% standard deviation change. The results also show that the larger
9
the discrepancy between perceived and preferred income inequality is, the lower the individual’s perception of her social standing.
In Column 3, additional control for the individual’s evaluation of income inequality is included.
Respondents were given the statement “differences in income in the country are too large” and asked if they strongly disagree, disagree, neither agree nor disagree, agree or strongly agree.
The answers are coded on a five-point scale. The estimated coefficient changes only slightly when this additional measure of preferred income inequality is controlled for.
Table 1: Subjective social status and perceived inequality
(1) (2) (3)
B SE p B SE p B SE p
Perceived
inequality -0.646 (0.082) 0.000 -1.328 (0.102) 0.000 -1.048 (0.093) 0.000 Legitimate level of
inequality 1.308 (0.090) 0.000 1.008 (0.083) 0.000
Attitude about
income inequality No No Yes
Controls Yes Yes Yes
Country × year FE Yes Yes Yes
N 68726 68726 68726
Adj. R-Square 0.307 0.313 0.320
Controls: Age, squared age, sex, education, legal marital status, labor market status, occupation, frequency of attendance at religious services, household size, family income, type of settlement, father’s occupation. Standard errors clustered by country
× year are given in parentheses. Dummies are included for missing regressors.
3.1. Robustness
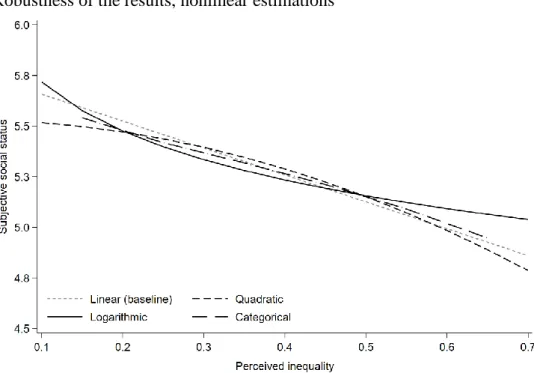
First, I re-estimate the model using different functional forms for perceived income inequality (and for the legitimate level of inequality). In the baseline specification (Column 2, Table 1), it is entered linearly. For the re-estimation, I use a quadratic form, a logarithmic form, and a categorical variable (with 0.1 points wide categories). These results are depicted in Figure 1.
The estimated relationships are very similar to the results of the linear specification, and they do not alter the conclusions.
10
Figure 1: Robustness of the results, nonlinear estimations
The figure shows the predicted level of subjective social status at different levels of perceived income inequality. The figure depicts the average marginal effects of OLS regressions. The results of the linear (baseline) model come from Table 1, Column 2. The variable of categorical perceived inequality has 10 categories (0.0–0.1, …, 0.9–1.0). Control variables: see Table 1.
Standard errors clustered by country X year are given in parentheses.
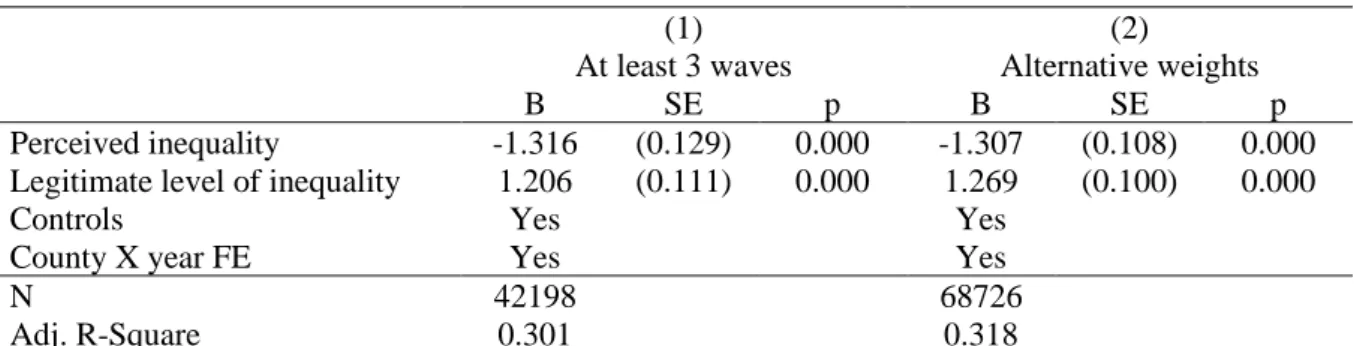
Additionally, the robustness of the result is tested by restricting the sample to countries participating in at least three of the four waves. In another specification, I use an alternative weighting method where the original weights are modified to set the sample size of every country-wave to be equal. In this way, the possible concern that larger countries may drive the results can be relaxed. The results reported in Table B3 in the Supplementary Materials show that neither of these changes alters the conclusions of the analysis.
I have argued that larger income inequality may affect subjective social status by increasing the feeling of relative deprivation or by increasing the importance of social comparison and the salience of high incomes (Cheung and Lucas, 2016; Schneider, 2012; Sommet et al., 2019). If this reasoning holds, similar results to the main model should be observed when alternative outcome variables are used. In two waves of the ISSP (1999, 2009), respondents were asked if they thought their pay was just. This variable can be considered an indicator of financial
11
satisfaction. Respondents could answer the question on a five-point scale (from 1 – “much less than just” to 5 – “much more than just”). The estimate reported in the first column of Table 2 is from a regression where the outcome variable is changed to the respondents’ opinion of how just or unjust their wages are (Eq. 4). The results are similar to the main model: the estimated coefficient is −0.712 and is significant at the 0.1% level. In other words, if perceived inequality is one standard deviation higher, respondents rate their wages less just by 0.102 points, which corresponds to a 12.7% standard deviation decrease in financial satisfaction. This is a somewhat larger effect size compared to the main model, which can be explained by the fact that the outcome variable explicitly refers to the respondent’s income, which might be more strongly related to the perceived income differences than subjective social status.
In the second column of Table 2, the outcome variable is changed to the respondents’ evaluation of their job (or last job) compared to the job of their father when they were 14 years old. They rate the subjective status of their job on a five-point scale that is recoded so that high values show high subjective status. The coefficient on perceived income inequality is negative ( ˆ = −0.199), but the effect size is smaller than that of the main model or that the effect size for opinion on wages: a one standard deviation change in perceived inequality is associated with a 0.028 point (or 2.7% standard deviation) decrease in the subjective status of the job. The small effect size is not surprising since fathers are not the most important reference group (Clark and Senik, 2010), and comparison with fathers is supposed to be less affected by income inequality. However, the result suggests that the increasing feeling of relative deprivation with a higher level of income inequality is reflected in the association with subjective job status compared to the father. It is worth remembering that the occupation of the respondents and the occupation of the father (ISCO major groups) are included as controls; hence, the coefficient
12
on perceived inequality captures primarily how perceived inequality is associated with subjective evaluations of the job rather than objective status differences.7
Table 2: Robustness of the results, alternative outcomes
(1) (2)
Wage is just Subjective status of job compared to the father
B SE p B SE p
Perceived inequality -0.721 (0.054) 0.000 -0.199 (0.055) 0.001 Legitimate level of inequality 0.698 (0.055) 0.000 0.280 (0.052) 0.000
Controls Yes Yes
County × year FE Yes Yes
N 43122 52159
Adj. R-Square 0.126 0.159
Control variables: see Table 1. Standard errors clustered by country × year are given in parentheses.
In the next step, I change the inequality variables. First, the variable of perceived income differences is used following Bavetta et al. (2019) and Jasso (2007). This measure of perceived income differences is based on the same questions on the estimated earnings of people working in different occupations that are used in the main analysis. In the first step, the highest and the lowest estimated incomes are identified. Then, the logarithm of their ratio is calculated.
Second, perceived societal inequality is calculated using the method of Gimpelson and Treisman (2018). In the ISSP survey, respondents were shown five diagrams (five different types of society), and they were asked which diagram and description best fit their country. The question does not explicitly refer to income, but the description of the five types of society includes the words “elite”, “middle” and “bottom”. Hence, the diagrams show social stratifications. The respondents may or may not interpret the diagrams as they show income differences, but respondents have to assume that the diagrams represent some kind of inequality. The method of Gimpelson and Treisman (2018) assumes that an interpretation of the diagrams in terms of income differences is the most natural one. In this way, using a
7 The results are similar and effect sizes are even larger when observations with missing occupation (ISCO codes) or respondents not in paid work at the time of the survey are excluded (Table B4 in the Supplementary Materials).
13
graphical approach, Gini coefficients to each diagram can be estimated. (The diagrams, the exact wording of the question, and a detailed description of the estimation are shown in Section A of the Supplementary Materials.)
Table 3 reports the estimations using the two alternative inequality measures. The results prove to be similar to the results of the main model. For the perceived level of income differences (Column 1), a one standard deviation change is associated with a 0.162 point (or 9.3% standard deviation) decrease in subjective social status. For perceived societal inequality, subjective social status is decreased by 0.193 points (or 11.1% standard deviation) when inequality is increased by one standard deviation. Note that the same effect size of the main model (Column 2 in Table 1) was a 10.8% standard deviation decrease, which means that the results are remarkably consistent regardless of the inequality measure.
Table 3: Robustness of the results, alternative inequality measures
(1) (2)
B SE p B SE p
Perceived level of income differences -0.169 (0.016) 0.000 Legitimate level of income differences 0.187 (0.013) 0.000
Perceived societal inequality -2.411 (0.147) 0.000
Legitimate level of societal inequality 0.699 (0.336) 0.042
Controls Yes Yes
County × year FE Yes Yes
N 68568 59289
Adj. R-Square 0.312 0.327
Dependent variable: subjective social status. Control variables: see Table 1. Standard errors clustered by country × year are given in parentheses.
3.2. Heterogeneity
Previous literature reports considerable heterogeneity in inequality aversion. For example, people living in postcommunist (Eastern) countries are more likely to be affected more strongly by income inequality than people living in countries that are not post-communist (Western) (Hajdu and Hajdu, 2014; Sanfey and Teksoz, 2007). This may be explained by historical background (Alesina and Fuchs-Schündeln, 2007; Blanchflower and Freeman, 1997), by
14
differences in perceived fairness of the income generation process (Ahrens, 2020; Bjørnskov et al., 2013), or by the wealth of the countries. Additionally, the bottom of society may be more affected by the negative consequences of inequality due to self-interest or an increased level and frequency of social comparison (Cheung and Lucas, 2016; Sommet et al., 2019). Empirical findings (mostly for Europe) support this hypothesis (Alesina et al., 2004; Lous and Graafland, 2021; Mau et al., 2012; Schwarze and Härpfer, 2007).
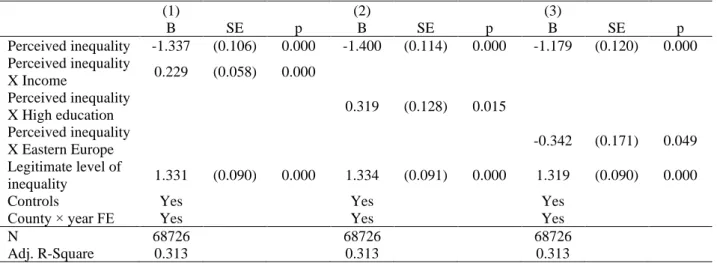
In this section, I test whether objective social status (income, education) and country moderate the association between perceived inequality and subjective social status. I allow the effect of perceived inequality to vary with the level of income (quantile), an indicator variable for having high education (above higher secondary level), and an indicator variable for Eastern countries.
The results are reported in Table 4. In the first column, the interaction term between perceived inequality and income is positive and significant ( ˆ =0.229). This implies that the negative association between perceived income inequality and subjective social status is less pronounced among high-income individuals. However, the estimated coefficient on inequality perception is still negative and significant for the highest income group ( ˆ = −0.874,p=0.000).8 For individuals in the lowest income quantile, a one standard deviation increase in perceived inequality is associated with a 0.254 point (or 14.5% standard deviation) decrease in subjective social status. For individuals in the lowest income quantile, the decrease is half of that of the low-income group (−0.124 points, 7.1% standard deviation).
The second column reports estimates for heterogeneity by education. Education can serve as a proxy for objective social status; hence, similar results observed for income are expected. The estimated coefficient on the interaction term is positive and significant ( ˆ =0.319), which
8 Demeaned income variable is used. Its value is 2.023 for the highest quantile, i.e., the estimated coefficient is calculated as follows: 1.337− +2.023 0.229 = −0.874.
15
means that the association between inequality perception and subjective status is less strong for highly educated individuals than for less educated individuals. The estimated effect size (for a one standard deviation increase in perceived inequality) among highly educated individuals is three-quarters of that among less educated individuals (−0.153 points or 8.8% standard deviation and −0.199 points or 11.4% standard deviation, respectively).
The results for the heterogeneity with regard to postcommunist history are shown in Column 3.
A relatively large and statistically significant difference is observed between Eastern European and Western European countries ( ˆ = −0.342). The sign of the coefficient shows that the association between perceived inequality and subjective status is stronger in Eastern Europe.
For a one standard deviation increase in perceived inequality, there is an approximately 3 percentage point difference between the estimated effect sizes of Eastern and Western countries (12.3% and 9.6% standard deviation, respectively).
Table 4: Heterogeneity of the results
(1) (2) (3)
B SE p B SE p B SE p
Perceived inequality -1.337 (0.106) 0.000 -1.400 (0.114) 0.000 -1.179 (0.120) 0.000 Perceived inequality
X Income 0.229 (0.058) 0.000
Perceived inequality
X High education 0.319 (0.128) 0.015
Perceived inequality
X Eastern Europe -0.342 (0.171) 0.049
Legitimate level of
inequality 1.331 (0.090) 0.000 1.334 (0.091) 0.000 1.319 (0.090) 0.000
Controls Yes Yes Yes
County × year FE Yes Yes Yes
N 68726 68726 68726
Adj. R-Square 0.313 0.313 0.313
Control variables: see Table 1. Standard errors clustered by country × year are given in parentheses. In Column 1, demeaned income variable is used, which means that the coefficient on perceived inequality shows the association between perceived inequality and subjective social status for respondents with average income.
16 4. Conclusions
In this paper, I analyzed the association between perceived income inequality and subjective well-being. Using four waves of the “Social Inequality” module of the International Social Survey Programme and a measure of subjective inequality perception that is similar to the conventional Gini coefficient, I found that those who perceive a higher level of income inequality rate their social status lower than those who perceive a lower level of income inequality. The effect size is relatively large: a one standard deviation change in perceived inequality is associated with a 10.8% standard deviation change in subjective social status. This result is insensitive to the measure of perceived inequality, and it is similar when alternative measures of subjective well-being are used (financial satisfaction, subjective status of job compared to the father).
It is worth noting that these results are based on estimates that control for income and other objective measures of social status (e.g., education, labor market status, occupation) of the respondents. Whereas empirical evidence shows that social status and inequality perception are correlated (Knell and Stix, 2020; Kuhn, 2011), the estimated negative association between perceived inequality and subjective social status captures other mechanisms beyond economic self-interest. These mechanisms might be the increased frequency and importance of social comparison or the increased feeling of relative deprivation (Cheung and Lucas, 2016;
Schneider, 2019; Sommet et al., 2019).
Regarding income inequality, there is evidence that perceived income inequality is a better predictor of preferences for redistribution than objective income inequality (Engelhardt and Wagener, 2014; Gimpelson and Treisman, 2018; Tóth and Keller, 2013). This paper suggests that perceived inequality is an important predictor of subjective well-being (subjective social status in this case). However, future research is needed to analyze how the association of subjective well-being with perceived and objective income inequality is related to each other
17
and which one is the more important. Another unanswered but important question addresses causality. In a natural or survey setting, it is not easy to find an exogenous source of variation in individuals’ income inequality perceptions. However, experimental studies (Payne et al., 2017; Sánchez-Rodríguez et al., 2019) have shown examples of how inequality perceptions could be manipulated, which may be useful for experiments more closely related to subjective well-being. Another interesting task for future research is to use alternative measures of perceived income inequality. For example, perceived inequality can be measured by relying on perceptions of economic differences between acquaintances in everyday life (García-Castro et al., 2019). Perceived inequality in an individual’s reference group or neighborhood might be more important for economic and social outcomes than perceived inequality in the whole society (García-Castro et al., 2019, 2020).
Empirical evidence suggests that both objective income inequality (Clark and D’Ambrosio, 2015) and perceived fairness of the income distribution (Bjørnskov et al., 2013; Schneider, 2012) matter for the subjective well-being of individuals. The results of this paper show that, beyond these two aspects of the income distribution, the perceived level of income inequality also has consequences regarding subjective well-being.
References
Ahrens, L., 2020. Unfair inequality and the demand for redistribution: why not all inequality is equal. Socio-Econ. Rev. https://doi.org/10.1093/ser/mwaa051
Alesina, A., Di Tella, R., MacCulloch, R., 2004. Inequality and happiness: are Europeans and Americans different? J. Public Econ. 88, 2009–2042.
https://doi.org/10.1016/j.jpubeco.2003.07.006
Alesina, A., Fuchs-Schündeln, N., 2007. Good-Bye Lenin (or Not?): The Effect of Communism on People’s Preferences. Am. Econ. Rev. 97, 1507–1528.
Andersen, J.G., Tonboe, J.C., Borre, O., Togeby, L., Nielsen, H.J., Andersen, B.H., Kjær, U., 2014. International Social Survey Programme 1999 (Denmark). ZA3562 Data file Version 1.0.0. GESIS Data Archive, Cologne. https://doi.org/10.4232/1.11835 Andersen, R., Curtis, J., 2012. The polarizing effect of economic inequality on class
identification: Evidence from 44 countries. Res. Soc. Stratif. Mobil., Inequality across the Globe 30, 129–141. https://doi.org/10.1016/j.rssm.2012.01.002
18
Bavetta, S., Donni, P.L., Marino, M., 2019. An Empirical Analysis of the Determinants of Perceived Inequality. Rev. Income Wealth 65, 264–292.
https://doi.org/10.1111/roiw.12351
Becker, J., Niggebrugge, D.E., 2014. International Social Survey Programme 1999 (Netherlands). ZA3293 Data file Version 1.0.0. GESIS Data Archive, Cologne.
https://doi.org/10.4232/1.11837
Beja, E.L., 2014. Subjective Well-Being Analysis of Income Inequality: Evidence for the Industrialized and Emerging Economies. Appl. Res. Qual. Life 9, 139–156.
https://doi.org/10.1007/s11482-013-9243-9
Bjørnskov, C., Dreher, A., Fischer, J.A.V., Schnellenbach, J., Gehring, K., 2013. Inequality and happiness: When perceived social mobility and economic reality do not match. J.
Econ. Behav. Organ. 91, 75–92. https://doi.org/10.1016/j.jebo.2013.03.017 Blanchflower, D.G., Freeman, R.B., 1997. The Attitudinal Legacy of Communist Labor
Relations. ILR Rev. 50, 438–459. https://doi.org/10.1177/001979399705000304 Browman, A.S., Destin, M., Kearney, M.S., Levine, P.B., 2019. How economic inequality
shapes mobility expectations and behaviour in disadvantaged youth. Nat. Hum. Behav.
3, 214–220. https://doi.org/10.1038/s41562-018-0523-0
Brown, G.D.A., Gardner, J., Oswald, A.J., Qian, J., 2008. Does Wage Rank Affect Employees’ Well-being? Ind. Relat. J. Econ. Soc. 47, 355–389.
https://doi.org/10.1111/j.1468-232X.2008.00525.x
Card, D., Mas, A., Moretti, E., Saez, E., 2012. Inequality at Work: The Effect of Peer Salaries on Job Satisfaction. Am. Econ. Rev. 102, 2981–3003.
https://doi.org/10.1257/aer.102.6.2981
Chetty, R., Hendren, N., Kline, P., Saez, E., 2014. Where is the land of Opportunity? The Geography of Intergenerational Mobility in the United States. Q. J. Econ. 129, 1553–
1623. https://doi.org/10.1093/qje/qju022
Cheung, F., 2018. Income redistribution predicts greater life satisfaction across individual, national, and cultural characteristics. J. Pers. Soc. Psychol. 115, 867–882.
https://doi.org/10.1037/pspp0000164
Cheung, F., Lucas, R.E., 2016. Income Inequality Is Associated with Stronger Social
Comparison Effects: The Effect of Relative Income on Life Satisfaction. J. Pers. Soc.
Psychol. 110, 332–341. https://doi.org/10.1037/pspp0000059
Choe, J., 2008. Income inequality and crime in the United States. Econ. Lett. 101, 31–33.
https://doi.org/10.1016/j.econlet.2008.03.025
Clark, A.E., D’Ambrosio, C., 2015. Attitudes to Income Inequality: Experimental and Survey Evidence, in: Atkinson, A.B., Bourguignon, F. (Eds.), Handbook of Income
Distribution, Handbook of Income Distribution. Elsevier, pp. 1147–1208.
https://doi.org/10.1016/B978-0-444-59428-0.00014-X
Clark, A.E., Senik, C., 2010. Who Compares to Whom? The Anatomy of Income Comparisons in Europe. Econ. J. 120, 573–594. https://doi.org/10.1111/j.1468- 0297.2010.02359.x
Corak, M., 2013. Income Inequality, Equality of Opportunity, and Intergenerational Mobility.
J. Econ. Perspect. 27, 79–102. https://doi.org/10.1257/jep.27.3.79
Cruces, G., Perez-Truglia, R., Tetaz, M., 2013. Biased perceptions of income distribution and preferences for redistribution: Evidence from a survey experiment. J. Public Econ. 98, 100–112. https://doi.org/10.1016/j.jpubeco.2012.10.009
Dolan, P., Peasgood, T., White, M., 2008. Do we really know what makes us happy? A review of the economic literature on the factors associated with subjective well-being.
J. Econ. Psychol. 29, 94–122. https://doi.org/10.1016/j.joep.2007.09.001
19
Engelhardt, C., Wagener, A., 2014. Biased Perceptions of Income Inequality and Redistribution (CESifo Working Paper Series No. 4838). CESifo.
Engler, S., Weisstanner, D., 2021. The threat of social decline: income inequality and radical right support. J. Eur. Public Policy 28, 153–173.
https://doi.org/10.1080/13501763.2020.1733636
Frank, R.H., 2007. Falling behind: How rising inequality harms the middle class. University of California Press, Berkeley and Los Angeles.
Ganzeboom, H.B.G., 2015. International Social Survey Programme: Social Inequality IV - ISSP 2009 (Netherlands). ZA5995 Data file Version 1.0.0. GESIS Data Archive, Cologne.
García-Castro, J.D., Rodríguez-Bailón, R., Willis, G.B., 2020. Perceiving economic inequality in everyday life decreases tolerance to inequality. J. Exp. Soc. Psychol. 90, 104019.
https://doi.org/10.1016/j.jesp.2020.104019
García-Castro, J.D., Willis, G.B., Rodríguez-Bailón, R., 2019. I know people who can and who cannot: A measure of the perception of economic inequality in everyday life. Soc.
Sci. J. 56, 599–608. https://doi.org/10.1016/j.soscij.2018.09.008
Gimpelson, V., Treisman, D., 2018. Misperceiving inequality. Econ. Polit. 30, 27–54.
https://doi.org/10.1111/ecpo.12103
Goerke, L., Pannenberg, M., 2015. Direct evidence for income comparisons and subjective well-being across reference groups. Econ. Lett. 137, 95–101.
https://doi.org/10.1016/j.econlet.2015.10.012
Gustavsson, M., Jordahl, H., 2008. Inequality and trust in Sweden: Some inequalities are more harmful than others. J. Public Econ. 92, 348–365.
https://doi.org/10.1016/j.jpubeco.2007.06.010
Hajdu, T., Hajdu, G., 2014. Reduction of Income Inequality and Subjective Well-Being in Europe. Econ. Open-Access Open Assess. E-J. 8, 1–29.
https://doi.org/10.5018/economics-ejournal.ja.2014-35
Hauser, O.P., Norton, M.I., 2017. (Mis)perceptions of inequality. Curr. Opin. Psychol., Inequality and social class 18, 21–25. https://doi.org/10.1016/j.copsyc.2017.07.024 ISSP Research Group, 1994. International Social Survey Programme: Social Inequality II -
ISSP 1992. ZA2310 Data file Version 1.0.0. GESIS Data Archive, Cologne.
https://doi.org/10.4232/1.2310
ISSP Research Group, 2002. International Social Survey Programme: Social Inequality III - ISSP 1999. ZA3430 Data file Version 1.0.0. GESIS Data Archive, Cologne.
https://doi.org/10.4232/1.3430
ISSP Research Group, 2017. International Social Survey Programme: Social Inequality IV - ISSP 2009. ZA5400 Data file Version 4.0.0. GESIS Data Archive, Cologne.
https://doi.org/10.4232/1.12777
ISSP Research Group, 2021. International Social Survey Programme: Social Inequality V - ISSP 2019. ZA7600 Data file Version 1.0.0. GESIS Data Archive, Cologne.
https://doi.org/10.4232/1.13599
Jasso, G., 2007. Studying justice: Measurement, estimation, and analysis of the actual reward and the just reward, in: Törnblom, K., Vermunt, R. (Eds.), Distributive and Procedural Justice: Research and Social Applications. Ashgate, Aldershot, pp. 225–253.
Kaplan, G.A., Pamuk, E.R., Lynch, J.W., Cohen, R.D., Balfour, J.L., 1996. Inequality in income and mortality in the United States: analysis of mortality and potential pathways. BMJ 312, 999–1003.
Kearney, M.S., Levine, P.B., 2016. Income Inequality, Social Mobility, and the Decision to Drop Out of High School. Brook. Pap. Econ. Act. 2016, 333–396.
https://doi.org/10.1353/eca.2016.0017
20
Kelly, M., 2000. Inequality and Crime. Rev. Econ. Stat. 82, 530–539.
https://doi.org/10.1162/003465300559028
Knack, S., Keefer, P., 1997. Does Social Capital Have an Economic Payoff? A Cross-Country Investigation. Q. J. Econ. 112, 1251–1288. https://doi.org/10.1162/003355300555475 Knell, M., Stix, H., 2020. Perceptions of inequality. Eur. J. Polit. Econ. 65, 101927.
https://doi.org/10.1016/j.ejpoleco.2020.101927
Kondo, N., Sembajwe, G., Kawachi, I., Dam, R.M. van, Subramanian, S.V., Yamagata, Z., 2009. Income inequality, mortality, and self rated health: meta-analysis of multilevel studies. BMJ 339, b4471. https://doi.org/10.1136/bmj.b4471
Kuhn, A., 2011. In the eye of the beholder: Subjective inequality measures and individuals’
assessment of market justice. Eur. J. Polit. Econ. 27, 625–641.
https://doi.org/10.1016/j.ejpoleco.2011.06.002
Kuhn, A., 2015. The Individual Perception of Wage Inequality: A Measurement Framework and Some Empirical Evidence (IZA Discussion Paper No. 9579). Institute of Labor Economics (IZA).
Kuhn, A., 2019. The subversive nature of inequality: Subjective inequality perceptions and attitudes to social inequality. Eur. J. Polit. Econ. 59, 331–344.
https://doi.org/10.1016/j.ejpoleco.2019.04.004
Kuhn, A., 2020. The individual (mis-)perception of wage inequality: measurement, correlates and implications. Empir. Econ. 59, 2039–2069. https://doi.org/10.1007/s00181-019- 01722-4
Kuziemko, I., Norton, M.I., Saez, E., Stantcheva, S., 2015. How Elastic Are Preferences for Redistribution? Evidence from Randomized Survey Experiments. Am. Econ. Rev.
105, 1478–1508. https://doi.org/10.1257/aer.20130360
Layard, R., Mayraz, G., Nickell, S., 2010. Does relative income matter? Are the critics right?, in: Diener, E., Helliwell, J.F., Kahneman, D. (Eds.), International Differences in Well- Being. Oxford University Press, Oxford, pp. 139–165.
Layte, R., Whelan, C.T., 2014. Who Feels Inferior? A Test of the Status Anxiety Hypothesis of Social Inequalities in Health. Eur. Sociol. Rev. 30, 525–535.
https://doi.org/10.1093/esr/jcu057
Lindemann, K., Saar, E., 2014. Contextual effects on subjective social position: Evidence from European countries. Int. J. Comp. Sociol. 55, 3–23.
https://doi.org/10.1177/0020715214527101
Lous, B., Graafland, J., 2021. Who Becomes Unhappy when Income Inequality Increases?
Appl. Res. Qual. Life. https://doi.org/10.1007/s11482-020-09906-2
Mau, S., Mewes, J., Schöneck, N.M., 2012. What determines subjective socio-economic insecurity? Context and class in comparative perspective. Socio-Econ. Rev. 10, 655–
682. https://doi.org/10.1093/ser/mws001
Merton, R.K., Rossi, A.S., 1968. Contributions to the Theory of Reference Group Behavior, in: Social Theory and Social Structure. Free Press, New York, pp. 279–334.
Nic Ghiolla Phádraig, M., 2014. International Social Survey Programme 1999 (Ireland).
ZA3613 Data file Version 1.0.0. GESIS Data Archive, Cologne.
https://doi.org/10.4232/1.11836
Oshio, T., Urakawa, K., 2014. The Association Between Perceived Income Inequality and Subjective Well-being: Evidence from a Social Survey in Japan. Soc. Indic. Res. 116, 755–770. https://doi.org/10.1007/s11205-013-0323-x
Payne, B.K., Brown-Iannuzzi, J.L., Hannay, J.W., 2017. Economic inequality increases risk taking. Proc. Natl. Acad. Sci. 114, 4643–4648.
https://doi.org/10.1073/pnas.1616453114
21
Perez-Truglia, R., 2020. The Effects of Income Transparency on Well-Being: Evidence from a Natural Experiment. Am. Econ. Rev. 110, 1019–1054.
https://doi.org/10.1257/aer.20160256
Pickett, K.E., Wilkinson, R.G., 2015. Income inequality and health: A causal review. Soc. Sci.
Med. 128, 316–326. https://doi.org/10.1016/j.socscimed.2014.12.031
Runciman, W.G., 1966. Relative deprivation and social justice. A study of attitudes to social inequality in twentieth-century England. Routledge & Kegan Paul, London.
Sánchez-Rodríguez, Á., Jetten, J., Willis, G., Rodríguez-Bailón, R., 2019. High Economic Inequality Makes Us Feel Less Wealthy. Int. Rev. Soc. Psychol. 32, 17.
https://doi.org/10.5334/irsp.333
Sánchez-Rodríguez, Á., Moreno-Bella, E., 2021. Are you interested in economic inequality?
Depends on where you live. Asian J. Soc. Psychol. Advance online publication.
https://doi.org/10.1111/ajsp.12458
Sanfey, P., Teksoz, U., 2007. Does transition make you happy? Econ. Transit. 15, 707–731.
https://doi.org/10.1111/j.1468-0351.2007.00309.x
Schneider, S.M., 2012. Income Inequality and its Consequences for Life Satisfaction: What Role do Social Cognitions Play? Soc. Indic. Res. 106, 419–438.
https://doi.org/10.1007/s11205-011-9816-7
Schneider, S.M., 2016. Income Inequality and Subjective Wellbeing: Trends, Challenges, and Research Directions. J. Happiness Stud. 17, 1719–1739.
https://doi.org/10.1007/s10902-015-9655-3
Schneider, S.M., 2019. Why Income Inequality Is Dissatisfying—Perceptions of Social Status and the Inequality-Satisfaction Link in Europe. Eur. Sociol. Rev. 35, 409–430.
https://doi.org/10.1093/esr/jcz003
Schwarze, J., Härpfer, M., 2007. Are people inequality averse, and do they prefer redistribution by the state?: Evidence from German longitudinal data on life
satisfaction. J. Socio-Econ. 36, 233–249. https://doi.org/10.1016/j.socec.2005.11.047 Scorzafave, L.G., Soares, M.K., 2009. Income inequality and pecuniary crimes. Econ. Lett.
104, 40–42. https://doi.org/10.1016/j.econlet.2009.03.021
Sommet, N., Elliot, A.J., Jamieson, J.P., Butera, F., 2019. Income inequality, perceived competitiveness, and approach-avoidance motivation. J. Pers. 87, 767–784.
https://doi.org/10.1111/jopy.12432
Stouffer, S.A., 1949. The American soldier, Studies in social psychology in World War II,.
Princeton University Press, Princeton, New Jersey.
Tan, J.J.X., Kraus, M.W., Carpenter, N.C., Adler, N.E., 2020. The association between objective and subjective socioeconomic status and subjective well-being: A meta- analytic review. Psychol. Bull. 146, 970–1020. https://doi.org/10.1037/bul0000258 Tóth, I.G., Keller, T., 2013. Income Distribution, Inequality Perceptions, and Redistributive
Preferences in European Countries, in: Gornick, J.C., Jäntti, M. (Eds.), Income
Inequality: Economic Disparities and the Middle Class in Affluent Countries. Stanford University Press, Stanford, pp. 173–203.
Walasek, L., Bhatia, S., Brown, G.D.A., 2018. Positional Goods and the Social Rank Hypothesis: Income Inequality Affects Online Chatter about High- and Low-Status Brands on Twitter. J. Consum. Psychol. 28, 138–148.
https://doi.org/10.1002/jcpy.1012
Walasek, L., Brown, G.D.A., 2015. Income Inequality and Status Seeking: Searching for Positional Goods in Unequal U.S. States. Psychol. Sci. 26, 527–533.
https://doi.org/10.1177/0956797614567511
Walasek, L., Brown, G.D.A., 2016. Income Inequality, Income, and Internet Searches for Status Goods: A Cross-National Study of the Association Between Inequality and
22
Well-Being. Soc. Indic. Res. 129, 1001–1014. https://doi.org/10.1007/s11205-015- 1158-4
Wilkinson, R.G., Pickett, K.E., 2006. Income inequality and population health: A review and explanation of the evidence. Soc. Sci. Med. 62, 1768–1784.
https://doi.org/10.1016/j.socscimed.2005.08.036
Wilkinson, R.G., Pickett, K.E., 2009. Income Inequality and Social Dysfunction. Annu. Rev.
Sociol. 35, 493–511. https://doi.org/10.1146/annurev-soc-070308-115926
Wilkinson, R.G., Pickett, K.E., 2018. The inner level: How more equal societies reduce stress, restore sanity and improve everyone’s well-being. Penguin Books, London.
Winkelmann, L., Winkelmann, R., 2010. Does Inequality Harm the Middle Class? Kyklos 63, 301–316. https://doi.org/10.1111/j.1467-6435.2010.00474.x
Wolbring, T., Keuschnigg, M., Negele, E., 2013. Needs, Comparisons, and Adaptation: The Importance of Relative Income for Life Satisfaction. Eur. Sociol. Rev. 29, 86–104.
https://doi.org/10.1093/esr/jcr042
Yitzhaki, S., 1979. Relative Deprivation and the Gini Coefficient. Q. J. Econ. 93, 321–324.
https://doi.org/10.2307/1883197
1
Supplementary Materials
A. Variables
1. Subjective social status
The exact wording of the subjective social status question is the following:
“In our society there are groups which tend to be towards the top and groups which tend to be towards the bottom. Below is a scale which runs from top to bottom. Where would you put yourself now on this scale?”
2. Perceived income inequality and legitimate level of income inequality
The exact wording of the questions is the following.
Perceived income inequality:
“We would like to know what you think people in these jobs actually earn. Please write in how much you think they usually earn each YEAR/MONTH, BEFORE/AFTER taxes. Many people are not exactly sure about this, but your best guess will be close enough. This may be difficult, but it is very important. So please try.
Please write in how much they ACTUALLY earn each year/month before/after taxes.
About how much do you think a doctor in general practice earns?
How much do you think a chairman of a large national corporation earns?
How much do you think a shop assistant earns?
How much do you think an unskilled worker in a factory earns?
How much do you think a cabinet minister in the <national> government earns?”
2 Legitimate level of income inequality:
“Next, what do you think people in these jobs ought to be paid. How much do you think they should earn each YEAR/MONTH, BEFORE/AFTER taxes, regardless of what they actually get…
Please write in how much they SHOULD earn each year/month before/after taxes.
About how much do you think a doctor in general practice should earn?
How much do you think a chairman of a large national company should earn?
How much do you think a shop assistant should earn?
How much do you think an unskilled worker in a factory should earn?
How much do you think a cabinet minister in the <national> government should earn?”
The measure of subjective Gini coefficients (perceived Gini and legitimate Gini) follows the framework of Kuhn (2011, 2015, 2019). The following description of the calculation of the two Gini coefficients is based on Kuhn (2011).
According to the geometric interpretation, the Gini coefficient is measured as the ratio of the area that lies between the line representing an equal distribution of incomes and the Lorenz curve over the total area under the line representing equal distribution. When group-level data on income are observed (with j=1,…,k groups, where the average income is the lowest in the first group and is the highest in the kth group), the area above the Lorenz curve can be computed as the sum of trapezoids:
1
1 2
k
j j
j j
F F
− q
=
+ , (A1)3
where Fj denotes the cumulative population share of groups 1,…, j, qj denotes the income share of group j.
1
j j
j k
j j
j
f y q
f y
=
=
, (A2)where fj denotes the population share of group j, and yj denotes the average income in group j.
The Gini coefficient can be calculated as follows:
1 1
2 0.5 0.5
k
j j
j j
F F
q G
−
=
+
−
=
, (A3)
since the total area under the line representing equal distribution equals 0.5, and the area above the line representing equal distribution, which is included in the sum of trapezoids, also equals 0.5.
In the case of two groups:
( )
(0 )
2 2 0.5 (0 ) ( ) 1
0.5
(0 ) ( 1) 1 1
(1
bottom top
bottom
bottom top
bottom bottom bottom top top
bottom bottom bottom top bottom bottom bottom top top
bottom bottom bottom bottom
F F
F q q
G F q F F q
f q f q f q f q q
f q f q
+ +
+ −
= = + + + −
= + + + − = + + −
= + − ) (1+ −qbottom) 1− = fbottom−qbottom
(A4) since Fbottom = fbottom, Ftop =1 and qtop = −1 qbottom. For a more detailed discussion of the measure, see Kuhn (2011, 2015).
4 3. Respondent’s wage is just
The exact wording of the question is the following:
Is your pay just? We are not asking about what you do earn, nor what you would like to earn – but what you feel is just given your skills and effort. Is your pay...
1 Much less than is just 2 A little less than is just 3 About just for me 4 A little more than is just 5 Much more than is just”
4. Subjective status of the respondent’s job compared to the father
The exact wording of the question is the following:
“Please think of your present job (or your last one if you don't have one now). If you compare this job with the job your father had when you were 14, would you say that the level or status of your job is (or was)…
1 Much higher than your father's 2 Higher
3 About equal 4 Lower
5 Much lower than your father's”
In the analysis, the variable is recoded so that high values show high subjective status.
5 5. Perceived societal inequality
The exact wording of the question is the following:
“These five diagrams show different types of society. Please read the descriptions and look at the diagrams and decide which you think best describes [your country]
Source of the diagram: International Social Survey Programme, 2009 Social Inequality IV, Final questionnaire
a. First, what type of society is [your country] today – which diagram comes closest?
b. What do you think [your country] ought to be like – which would you prefer?”
The method of Gimpelson and Treisman (2018) assumes that the bars on the diagrams represent income classes and that the income gaps between the income categories are identical. The area of each bar is assumed to represent the population share of the given income class. Building on these assumptions, Gini coefficients are calculated using a bias correction to reduce bias due to grouped data. The Gini coefficients for the five diagrams are: (A) 0.42, (B) 0.35, (C) 0.30, (D) 0.20, (E) 0.21.