Volume 45 Number 1 February 2014
© 2014 Decision Sciences Institute
The Importance of Social Embeddedness:
Churn Models at Mobile Providers*
G´abor Benedek
Thesys SEA Pte Ltd, 89 Neil Road, Singapore 088849, Singapore and Department of Mathematical Economics and Economic Analyses, Corvinus University of Budapest, F˝ov´am t´er 6, 1093, Budapest, Hungary, e-mail: gabor.benedek@thesys.com
Agnes Lubl´oy´ †
Department of Finance, Institute of Finance and Accounting, Corvinus University of Budapest, F˝ov´am t´er 6, 1093, Budapest, Hungary, e-mail: agnes.lubloy@uni-corvinus.hu
Gyula Vastag
Department of Management, Faculty of Business and Economics, University of Pannonia, Egyetem u. 10, 8200, Veszpr´em, Hungary, e-mail: gyula.vastag@gtk.uni-pannon.hu
ABSTRACT
This article argues the importance of social embeddedness at mobile providers by exam- ining the effects of customers’ network topological properties on churn probability—the probability of a customer switching from one telecommunication provider to another.
This article uses data from regional snowball sampling—the only practically feasible network sampling method—to identify groups with significantly different churn ratios for customers with different network topological properties. Clear evidence indicates that individual network characteristics (node-level metrics) have considerable impact on churn probabilities. The inclusion of network-related measures in the churn model allows a longer-term projection of churners and improves the predictive power of the model. With no possibility to carry out repeated sampling, sample stability was checked through simulation results. On the one hand, this article highlights the importance and effectiveness of the provider’s tailored marketing campaigns by showing that customers targeted by direct marketing campaigns are less threatened by churn than nontargeted customers. On the other, this article shows that social embeddedness blocks the impact of the very same marketing efforts. This article forwards the idea that social embeddedness, also prevalent in vendor switching, can be extended to understanding the development of
*In 2012, an earlier version of this article received the Best Application Paper Award at the 3rd Annual Conference of the European Decision Sciences Institute; comments received during the conference and later by theDecision Sciencesreview team are gratefully acknowledged. Thanks are due to P´eter Cs´oka and G´abor Szab´o for their invaluable help with the preparation of this article. Thanks are also due to the analysts of the mobile telecommunications company providing the data for their technical support and suggestions. Editorial assistance by Anamaria M. Cristescu-Martin is greatly appreciated. Financial support from T ´AMOP 4.2.1.B-09/1/KMR-2010–0005 is gratefully acknowledged.
†Corresponding author.
175
professional societies threatened by membership churn. [Submitted: January 12, 2012.
Revised: July 30, 2012; March 31, 2013. Accepted: April 12, 2013.]
Subject Areas: Cluster Analysis, Consumer Behavior, Customer Relation- ship Management, Network Analysis, Social Network Analysis, Supply Chain Risk Management, and Telecommunications.
INTRODUCTION
Mobile providers all over the world face the phenomenon of customer churn.
Attracting new customers is more expensive than retaining old ones, and loyal, repeat customers are much more profitable than new ones (Schmenner, 1995; Met- ters, King-Metters, & Pullman, 2003). To keep the number of switching customers at a minimum, mobile companies must identify their risk customers and target them with marketing campaigns. Providers’ internal churn models are specifi- cally constructed for this purpose. However, the data mining methods used in these models disregard network effects (Mozer, Wolniewicz, Grimes, Johnson, &
Kaushanksy, 2000; Wei & Chiu, 2002; Hung, Yen, & Wang, 2006)—customer value is determined on an individual basis. Hence, churn models typically include personal details, type of customer package, telephone usage patterns, and informa- tion on direct marketing, as explanatory variables—the potential spillover effects of social linkages among customers are not taken into consideration. However, if one key customer switches to a different service provider, customers with strong social links with the key customer may follow, resulting in loss for the provider far more substantial than originally predicted. This article demonstrates that the network characteristics of customers are important churn factors. Greater customer embeddedness—the extent of integration into a given mobile network—implies lower churn probability. However, alongside target customer embeddedness, the embeddedness of the customers’ social connections plays an important role in avoiding churn. The target customer’s personal and professional contacts will churn with higher probability, if they dial numbers mostly outside the target cus- tomer’s own network, putting the target customer at risk of churn too.
Social embeddedness—the degree to which economic actors are enmeshed in a social network (defined properly through node-level metrics)—has important implications on economic outcomes and the inertial tendency to repeat transac- tions over time (Granovetter, 1985; Uzzi, 1996), and customer retention is only one prominent example. Choi and Kim (2008) argued that structural embeddedness—
suppliers’ relationships with their suppliers or other buying firms—affects suppli- ers’ performance in a supply chain setting. In professional associations, member embeddedness is also crucial for the wellbeing and existence of the society (Palla, Barab´asi, & Vicsek, 2007).
Based on snowball sampling, this article shows that social embeddedness—
reflected in the network topological properties of customers—impacts on churn probabilities significantly. This article explores the essential question of whether a substantial difference in terms of network characteristics exists between retained and churned customers. As this article uniquely proposes, the network topological properties of customers constitute a significant factor in the variation in churn ratios
among groups of mobile phone users. Models incorporating network measures identify churning customers with higher precision, allowing mobile providers to gain—and maintain—their competitive edge efficiently. However, rather than attempting to build a reliable churn model, this article focuses on identifying determinants of subscriber churn from a network theoretical perspective.
The organization of the article is as follows. The next section provides the theoretical foundations of customer churn and surveys the empirical literature.
Then we describe the sampling method, data, and network characteristics. The section afterwards elaborates on network characteristics: we define the network characteristics of customers, and introduce the methodology of formulating de- cision rules based on topological properties. Then we present the decision rules, formulated separately for targeted and nontargeted customers—the findings are validated through a simulation study, and the results from the two approaches are contrasted. Finally, we summarize this article’s contributions, discuss its limita- tions, and suggest some future directions and extensions.
CUSTOMER CHURN: A CONCEPTUAL FRAMEWORK
In combination, transaction cost theory (TCT), social exchange theory (SET), and social network analysis (SNA) provide the theoretical lenses for viewing customer churn as it relates to mobile customers sustaining or switching providers. Whitten and Leidner (2006), for example, applied such a theoretical basis to examining the factors leading to backsourcing or switching vendors.
On the one hand, because it focuses primarily on the economic aspects of the contracts (Williamson, 1985), TCT alone cannot fully explain the phenomenon of customer churn. On the other, all else being equal, SET can offer supplemental explanations for why a customer might switch or stay. SET assumes that the rela- tionships between mobile providers and customers are reviewed and weighted in terms of costs and rewards, which—like the kindness of the staff, nearby locality of customer centers, and loyalty points, for example—are not necessarily financial.
The parties recognize that the relationship is more valuable than alternative rela- tionships (Whitten & Leidner, 2006). Experts of churn prediction group significant differentiators between churners and nonchurners into categories, such as customer demographics (e.g., age and gender), contractual data (e.g., contract type, length of service, and payment type), call patterns aggregated from call details (e.g., average call duration, minutes of use, and number of phone calls), and customer service logs (Wei & Chiu, 2002; Ahn, Hanh, & Lee, 2006). The latter category—related to the quality of customer service, customer care, and customer satisfaction—is definitely in line with SET. Where customers are considering switching providers, the quality of the relationship with the mobile provider may be of considerable importance. While determinants of subscriber churn and customer loyalty can be linked directly and indirectly to economic aspects and the value created by the relationship, neither TCT nor SET can fully explain the phenomenon of customer churn.
Among others, SNA determines the embeddedness of nodes in networks, and their likelihood to opt out of networks (Appendix A contains a short discussion of network theory). Embedded nodes may profit from their central network position
in various ways, mostly through social status, power, or prestige (Kim Choi, Yan,
& Dooley, 2011). Customers integrated into a given mobile network benefit from lower phone bills and easy access to friends, for example, even if competitor networks suffer from disruptions. Several articles discussed network neighbors as an important determinant of customer churn. Dierkes, Bichler, and Krishnan (2011) showed that using information about the network neighbors’ churn results in a significantly higher predictive accuracy and sensitivity. Dasgupta et al. (2008) provided substantial evidence that social relationships play an influential role in affecting churn in the operator’s network, hinting toward a cascading effect—
the churn probabilities increase if an individual has friends who have churned in previous months. Additional recent studies predicting churn by using SNA include Driscoll (2010) and Richter, Yom-Tov, and Slonim (2010).
In summary, TCT, SET, and SNA provide a complete conceptual framework for customer churn—in combination, they take into account both social (intan- gible) and monetary utilities. On this background, we posit that switching costs, the quality of the relationship between customer and mobile provider, and the friendship circle of the customer influence the decision to continue with a mobile contract. Previous empirical research proved that high switching costs and cus- tomer satisfaction lower the probability of churning (Bolton, Kannan, & Bramlett, 2000; Gerpott, Rams, & Schindler, 2001; Lee, Lee, & Feick, 2001; Kim & Yoon, 2004; Ahn et al., 2006; Maicas, Polo, & Sese, 2009). In this article, we show that customer embeddedness also lowers churn probability.
The importance of social embeddedness has long been emphasized in science.
Vastag and Montabon (2002) proved the role of social acculturation in journal rankings by showing that the perceived journal impact has been developed through many layers of social connectedness, of which doctoral education is one prominent factor. Whitley (2000) built a typology based on organizational theory. He viewed scientific activity as inherently uncertain (it has to produce novelty), controlled and constrained by the collective of practitioners who, to varying extents, are mutually dependent on researchers. To our knowledge, in professional societies, churning has not been systematically investigated yet, but anecdotal evidence shows that in the broadly defined field of decision sciences, the wide variety of choices combined with low switching costs and growing pressure for limiting the number of memberships (due to budgetary constraints) make embeddedness a key factor in selecting the “right” society—people want to be where the dominant networks and “leading geese” of the field are.
The most commonly used data mining techniques for churn prediction are decision trees, logistic regressions, and neural networks (Mozer et al., 2000; Wei
& Chiu 2002; Hung et al., 2006; Kim, Jung, Suh, & Hwang 2006; Neslin, Gupta, Kamakura, Lu, & Mason 2006). Lima (2009), Radosavljevik, Putten, and Larsen (2010), and Verbeke, Dajaeger, Martens, Hur, and Baesens (2012) reviewed the churn prediction models for service providers comprehensively. The majority of churn prediction models use, among others, contractual data (e.g., contract type, length of service, and payment type) as predictors (Wei & Chiu, 2002). In addi- tion, Ahn et al. (2006) also considered variables related to switching costs (e.g., loyalty membership card and accumulated loyalty points) as important churn de- terminants. The study by Li, Madhok, Plaschka, and Verma (2006) highlighted
the role of purchasers’ switching inertia in the supplier selection process—their findings reflect the implicit role of transaction costs in the selection process, and may be applied to mobile customers directly. In sum, studies concerned with the determinants of subscriber churn and customer loyalty support the good predictive power of contractual data, transaction costs, and switching costs.
SAMPLING AND SAMPLE DATA Sampling and Sample Data in Networks
Sample representativeness in networks—including generalizability and external validity—is different from the traditional sampling model, such that units and their network attributes must be representative of the population. The sampling tech- niques used in online social communities can easily be adapted for telecommuni- cation networks (Ahn, Han, Kwak, Moon, & Jeong, 2007; Mislove, Marcon, Gum- madi, Druschel, & Bhattacharjee, 2007; Caverlee & Webb, 2008; De Choudhury et al., 2010; Gjoka, Kurant, Butts, & Markopoulou, 2010; Ye, Lang, & Wu, 2010) due to network topological similarities (Ahn et al., 2007; Mislove et al., 2007;
Onnela et al., 2007a, 2007b; Lambiotte et al., 2008; Gjoka et al., 2010).
The authors of this article opted for regional (geographic location-based) snowball sampling as a method for gathering information (Appendix B includes a discussion of graph traversals and snowball sampling). Regional snowball samples reflect both the calling patterns and the social network attributes of the customers appropriately. Regional snowball sampling is a widely accepted technique to sam- ple large-scale telecommunication networks—studying the entire telecommunica- tion network is either impractical or impossible. To the authors’ knowledge, no method other than regional snowball sampling has been applied to telecommuni- cation networks (Nanavati et al., 2008; Dasgupta et al., 2008; Dong, Song, Xie,
& Wang, 2009; Dierkes et al., 2011). Discussion with business practitioners also suggested that regional snowball sampling is the only feasible network sampling method for telecommunication networks.
The largest mobile company of a Central European country provided the data, and the algorithm was performed with multiple random seeds, all neigh- bors of the seeds were picked, and the number of iterations was two—the sample frame included only residential (private) customers. The research involved two distinct phases of data collection. In the first phase, the data set included call and short message service (SMS) records, for the first half of 2007, of the Core 1 customers—1,200 randomly selected customers residing in a large Central Euro- pean city with a population of 135,000. Core 1 customers had postpaid subscrip- tions with the mobile company and did not churn in the first half of 2007. In the second phase, the data set included the call and SMS records, for the first half of 2007, of the Core 2 customers—receiving parties of Core 1 customers with pre- paid or postpaid subscriptions with the same mobile company. Receiving parties of Core 1 customers with subscriptions with other mobile providers will be referred to as Periphery 1 customers, and receiving parties of Core 2 customers will be classed as Periphery 2 customers. Figure 1 displays the various categories of customers.
Figure 1: Customers in the cores and on the periphery.
Note:Phone calls initiated by Core 2 customers are not shown.
The snowball sampling method used in the second phase of data collection produced more than satisfactory results—the initial data set covered only 0.04%
of the mobile company’s subscribers living in that city, but the final data set provided information on 30% of the mobile company’s customers living in that city.
Reaching such a large proportion of the population in a single step is exceptional in SNA.
Core 1 and Core 2 customer call and SMS records include the callers’ and receivers’ phone numbers, the month of transaction, the number and duration of calls, and the number of SMS. The mobile provider also keeps records of customers entering the company, those participating in direct marketing campaigns, and whether they are being successfully retained. If, in the first half of 2007, the mobile provider found a Core 1 customer at risk of churn, the company would attempt retention through marketing campaigns. Some Core 1 customers (churners) churned subsequently, despite retention efforts—others decided not to switch to another service. Seventeen months after the end of the data collection phase, the mobile company made all this information available to the authors, for research purposes. Table 1 summarizes the effect of marketing on Core 1 customers. As marketing campaigns anticipate lower churn probabilities, separate analyses are required for targeted and nontargeted customers.
Table 1: The effect of marketing on Core 1 customers.
Marketing Loyal Customers Churned Customers
No marketing campaigns 403 256
Marketing campaigns 417 124
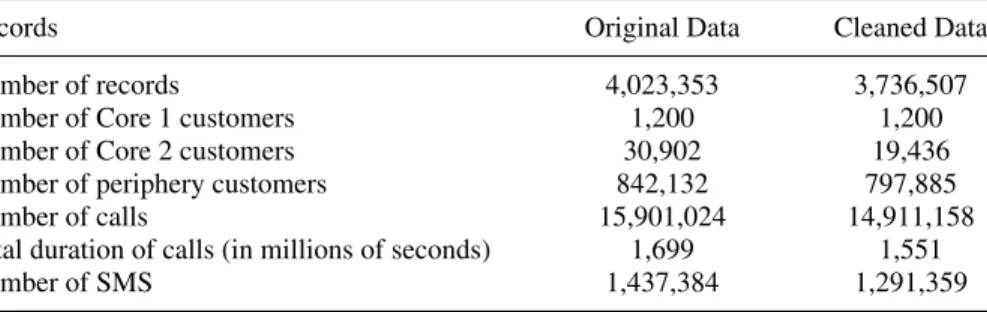
Table 2: Call and SMS records.
Records Original Data Cleaned Data
Number of records 4,023,353 3,736,507
Number of Core 1 customers 1,200 1,200
Number of Core 2 customers 30,902 19,436
Number of periphery customers 842,132 797,885
Number of calls 15,901,024 14,911,158
Total duration of calls (in millions of seconds) 1,699 1,551
Number of SMS 1,437,384 1,291,359
Table 2 summarizes the call and SMS records, where records indicating very weak social relations (the receiver was called only once in the first half of 2007, or was sent only a single SMS) were not included. Records of exceptionally frequent receivers and initiators were also excluded. As extreme outliers do not reflect true social relationships, visualizations, descriptive statistics, and box plots were used to detect and delete them.
Approximately 3.7 million records covered almost 15 million phone calls and 1.3 million SMS—core customers initiated an average of 120 phone calls and 10 SMS every month, with an average monthly duration of 3.5 hours per person. The final sample contained 1,200 Core 1 customers and 19,436 Core 2 customers—the periphery data set contained almost 800,000 customers.
Network Characteristics of the Sample
To characterize the structure and dynamics of social networks, social network scholars and network scientists (Freeman, 1979; Watts & Strogatz, 1998; Everett
& Borgatti, 1999; Albert & Barab´asi, 2002) developed a range of network metrics at both network and node level. Network-level metrics compute how the over- all network ties are organized. Node-level metrics measure how individuals are embedded in networks, from those individual nodes’ perspectives. This section considers degree distribution, a network-level metric—node-level metrics are in- troduced later in this article. In a supply chain setting, Kim et al. (2011) used metrics similar to ours.
The degree of a customer in a network is defined as the number of connections (or edges) the customer has to other nodes. In a directed network, nodes have two degrees: the in-degree, or the number of incoming edges, and the out-degree, or the number of outgoing edges.
The left side of Figure 2 shows a dot histogram for the out-degree of core customers—the number of contacts the core customers phoned during the first half
Figure 2: Out-degree of core customers.
0 50 100 150 200 250
1 26 51 76 101 126 151 176 201 226 251 276 301 326 351 376 404 435 466 502 551 601 713 1000
Frequency
Out-degree
Dot Histogram
Degree distribution
0,00001 0,0001 0,001 0,01 0,1 1
1 10 100 1000
Out-degree
Probability
of 2007. The average out-degree was 91 contacts, the median out-degree was 61, and the mode was 25. The lowest out-degree was one; with 70 customers dialing only one number (at least twice) within the period under analysis. The highest out-degree was 993, with three socially active customers phoning 993 contacts within that period.
The most popular method of analyzing the structure of a large-scale net- work is to plot its degree distribution—the probability distribution of the degrees over the entire network, withP(k) as the fraction of nodes in the network with degreek(Albert & Barab´asi, 2002). The upper-right subplot of Figure 2 displays the out-degree distribution of the core network. To compact the large range of values observed in the data set, the data is presented in a log-log plot (i.e., both axes are logarithmically scaled). Kwak, Han, Ahn, Moon, and Jeong (2006) ar- gued that the scaling behavior of node degree distribution is captured correctly in sampled networks with a sampling ratio above 0.25%. With a sample ratio of 30% in regional context and a sample ratio of 0.49% for the entire customer base, the scaling behavior of the obtained degree distribution in our article provides a good representation for the entire telecommunication network. AQ–Qplot allows
comparisons between empirical and theoretical distribution functions—with the points in theQ–Qplot almost precisely on they=xline, the generalized gamma distribution has a good fit to the underlying data.
Dong et al. (2009) carried out a regional snowball sampling in the Chinese mobile market, whereas Caverlee and Webb (2008) used the breadth-first traversal ended early to sample MySpace. The degree distributions plotted by Caverlee and Webb (2008) and Dong et al. (2009) had very similar shapes to those displayed on the inset of Figure 2—similarity in sampling algorithms may cause similarities of curves. As both snowball sampling and breadth-first traversal undersample nodes with few contacts (Lee, Kim, & Jeong, 2006; Ahn et al., 2007; Kurant, Markopoulou, & Thiran, 2010, 2011; Ye et al., 2010; Wang et al., 2011), the beginning of the distribution is distorted. Without such distortion, most probably, the empirical distribution would follow power law as reported in previous studies on large-scale telecommunication networks (Onnela et al., 2007a; Dasgupta et al., 2008; Kiss & Bichler, 2008; Lambiotte et al., 2008).
NETWORK TOPOLOGICAL PROPERTIES AND CHURN
This article defines churn probability as the likelihood of a customer switching providers, and churn ratio as the number of churning customers over the total number of customers. The network properties are examined individually; without additional and mostly confidential data (such as personal details, customer pack- age information, phone usage patterns, and billing details), the analyses cannot constitute sophisticated churn models. Nevertheless, our research offers network theoretical insights focusing on the question whether customers can be mean- ingfully segmented into groups, with significantly different churn ratios, on the basis of network topological properties. Empirical evidence suggests that network characteristics have significant impact on customer churn probability if meaning- ful segmentation is feasible. Similarly to Rao (1973), we identified the group of loyal customers. However, instead of using external information for discriminant analysis, we used information from the service provider.
Network Topological Properties: Node-Level Metrics
The decision rules underlying segmentation rely on seven network topological metrics—node-level constructs which measure how core customers are embedded in the network.
(i) Degree—the number of contacts a core customer has, irrespective of the direction of the links.
(ii) In-network degree—the number of contacts a core customer has within the network of the provider.
(iii) Proportion of in-network call duration—the ratio of in-network call du- ration to total call duration.
(iv) Embeddedness of a Core 1 customer’s relations—the percentage of em- bedded Core 2 customers among the Core 1 customer’s Core 2 con- tacts. By definition, a Core 2 customer is embedded if the customer dials
Figure 3: Embeddedness of relations.
In-network call
Core 1 customer
In-network proportion:
100%
Friend 1
Friend 2
Friend 3
EMBEDDED RELATIONS:
66.7%
In-network call In-network call
Out-network call In-network call In-network call
In-network call Out-network call Out-network call
In-network proportion:
75%
NETWORK AVERAGE : 57%
In-network proportion:
33.3%
In-network call
numbers within the network of the provider more frequently than the network average.
Figure 3 summarizes the calculations of this network measure. A Core 1 customer makes phone calls to three Core 2 customers (Friend 1, Friend 2, and Friend 3) with proportions of in-network phone calls of 100%, 75%, and 33.3%, respectively. Assuming the proportion of in-network phone calls is 57% for the entire network, the proportion of in-network phone calls for Friend 1 and Friend 2 is higher than the network average, while that for Friend 3 is lower. Friend 1 and Friend 2 are embedded Core 2 customers, while Friend 3 is a nonembedded Core 2 customer. In other words, two thirds (66.7%) of the Core 1 customer’s relations are embedded—the higher this ratio, the more embedded the Core 1 customer is in the network of the provider.
(v) Weighted embeddedness of relations—similar to embeddedness of a Core 1 customer’s relations, but the network is weighted with the weights of the links determined by the durations of the calls (both existence and strength of link play a role).
(vi) Proportion of in-network relations within the relations separated from the customer by two degrees—where, if Customer B receives phone calls from Customer A and initiates phone calls to Customer C, Customers A and C are separated by two degrees.
(vii) Proportion of in-network SMS—the ratio of SMS sent within the network of the provider to the total number of SMS sent.
Higher values indicate higher embeddedness and higher embeddedness implies lower churn probability.
Methodology
The churn risk assessment models—a terminology introduced in this article—
identify churners by describing their position in the network, and complement the churn models currently in use by offering better, longer-term predictive validity.
While traditional churn models focus on the immediate future, churn risk assess- ment models look further ahead. Call pattern analysis is a particularly popular method of predicting churners likely to emerge within months—for instance, the mobile company at the core of our article uses the phone call data over a 6-month period to identify customers likely to churn within three months. However, risk assessment models may predict churners even a year in advance. They make use of customer network characteristics that are less variable than the phone usage patterns; the frequency and duration of calls customers have with their friends vary from month to month, whereas friendship circles change little over time.
Call pattern analysis is a six-stage process. First, it determines the network topological properties of customers through investigation of call and SMS records over a 6-month period. Second, it segments Core 1 customers into two sufficiently large subgroups through a series of analyses. Customers targeted by marketing campaigns are examined separately from nontargeted customers—the distinction is important, because the provider’s analysts have already identified high churn prob- ability customers for targeted, tailored marketing campaigns aimed at customer re- tention. Third, it determines the churn ratios of the two subgroups. Fourth, it calcu- lates the difference between the churn ratios of the two subgroups. Fifth, it conducts significance tests (two-proportionz-test). Sixth, it formulates the decision rules.
RESULTS: THE DECISION RULES
In this section, we first describe the decision rules for nontargeted customers, representing 55% of the sample’s Core 1 customers. Then we summarize the segmentation rules emerging for targeted customers—the differences between the two subgroups are also discussed here. Finally, we address the issue of robustness.
Degree of Nontargeted Customers
Figure 4(a) summarizes the impact of Core 1 customers’ in-network degree on the churn ratio. Thex-axis shows the number of relations within the network of the provider—the in-network degree. Every in-network degree is a possible candidate for the decision rule. The left-hand scale of they-axis shows the difference between the churn ratios of the two subgroups segmented by the relevant decision rule. The right-hand scale of they-axis shows the values of thez-test, indicating the statistical significance of the results at a confidence level of 95%. The vertical bars represent the differences in the churn ratios of the two subsegments, in percentages. The continuous line represents the values of the z-test. The differences in the churn ratios of the two subsegments are statistically significant if the z-test line runs above the dotted line. The final decision rule will be the one that produces the most significant difference between the churn ratios.
Table 3 illustrates the method by showing the churn ratio of customers with a certain number of relations within the network of the provider. The churn ratio of
Figure 4: The impact of network characteristics on churn. (a) In-network degree;
(b) degree; (c) in-network call duration; (d) embeddedness; (e) weighted embed- dedness; and (f) two degrees of separation.
0 1 2 3 4 5 6
0%
10%
20%
30%
40%
50%
60%
70%
80%
90%
4 5 6 7 8 9 10 11 12 13
test-statistics
soitar nruhc eht ni ecnereffiD
In-network degree Difference
Z-score
0 1 2 3 4 5
0%
10%
20%
30%
40%
50%
60%
7 9 11 13 15 17 19 21 23
test-statistics
soitar nruhc eht ni ecnereffiD
Total number of relations Difference
Z-score
0 1 2 3 4 5 6
0%
20%
40%
60%
80%
100%
120%
27% 29% 31% 33% 35% 37% 39% 41% 43% 45%
test-statistics
soitar nruhc eht ni ecnereffiD
Proportion of in-network call duration Difference
Z-score
0 1 2 3 4 5
0%
10%
20%
30%
40%
50%
60%
70%
14% 17% 20% 23% 26% 29% 32% 35% 38%
test-statistics
soitar nruhc eht ni ecnereffiD
Proportion of embedded relations Difference
Z-score
0 1 2 3 4
0%
10%
20%
30%
40%
50%
60%
36% 39% 42% 45% 48% 51% 54% 57% 60%
test-statistics
soitar nruhc eht ni ecnereffiD
Weighted proportion of embedded relations Difference
Z-score
0 1 2 3 4 5
0%
10%
20%
30%
40%
50%
60%
70%
80%
39% 41% 43% 45% 47% 49%
test-statistics
soitar nruhc eht ni ecnereffiD
Proportion of in-network relations at two degrees of separation
Difference Z-score
(a)
(b)
(c)
(d)
(e)
(f)
Notes:(a-b, d-e) The calculation includes both incoming and outgoing edges, provided that the call duration is longer than average (828 seconds). (c) The calculations include all incoming and outgoing phone calls, regardless of call duration. (f) The calculations cover all outgoing phone calls, regardless of call duration.
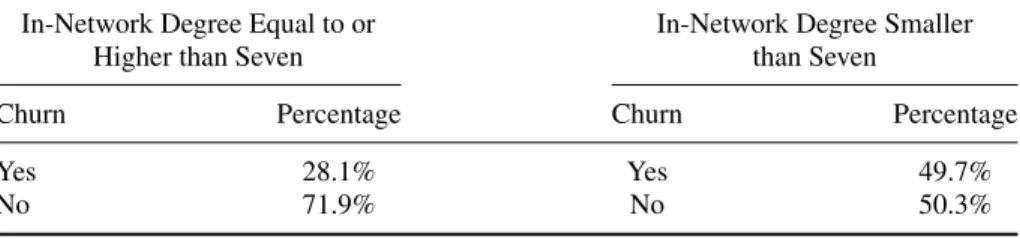
customers with seven or more in-network relations is 28.1%. The churn ratio for customers with fewer than seven in-network relations is 49.7%. This latter figure is 76.9% higher than the churn ratio of customers with seven or more in-network relations ((49.7 %−28.1 %)/28.1%=76.9 %). To determine whether the dif- ference between the two churn ratios is significant, the one-tailed two-proportion z-test (Z=(pY −pX)/√
p¯q¯(1/nY +1/nx) was performed (Fleiss, Levin, & Paik,
Table 3: The churn ratios of customers.
In-Network Degree Equal to or In-Network Degree Smaller
Higher than Seven than Seven
Churn Percentage Churn Percentage
Yes 28.1% Yes 49.7%
No 71.9% No 50.3%
2004), resulting in a value 5.69, which is statistically significant at a 95% confi- dence level. To obtain reasonably accurate estimates, thez-test requires sufficiently large sample sizes—the sizes of the subgroups should not be lower than 100—a prerequisite taken into account in setting the lowest and the highest values of the x-axis range.
Figure 4(a) provides the basis for formulating the decision rule. The threshold of seven for the in-network degree, where the value of thez-test is at its peak, reveals the most significant difference between the two subsegments: if the in- network degree of a nontargeted customer is smaller than seven, then their churn probability is significantly high.
The next analysis captures the impact of the total number of relations (de- grees) of nontargeted customers on the churn ratio. As Figure 4(b) shows, the most significant difference between the two subsegments is observed at a threshold of 12 relations: if the degree of a nontargeted customer is less than 12, then their churn probability is significantly high.
Embeddedness of Nontargeted Customers
Because all the results in this section were obtained by applying the methodology described previously and because their interpretation follows the same logic, the following paragraphs present the figures providing the basis for segmentation, and the final decision rules.
Figure 4(c) shows that if the in-network call duration of a nontargeted cus- tomer is less than 41%, then the customer’s churn probability is significantly higher.
Figure 4(d) shows that if less than 15% of a nontargeted customer’s relations are embedded, then the customer’s churn probability is significantly higher. Figure 4(e) shows that if less than 37% of a nontargeted customer’s relations are embedded as weighted by call duration, then the customer’s churn probability is significantly higher. Figure 4(f) shows that if less than 40% of the relations separated from a nontargeted customer by two degrees are in-network relations, then the customer’s churn probability is significantly higher. With regard to the impact of in-network sent and received SMS on churn, the values of thez-test always remain below the dotted line (figure not shown), indicating no significant effect on churn.
Comparison of Targeted and Nontargeted Customers
As expected, a comparison between targeted and nontargeted customers, summa- rized in Table 4, reveals that targeted customers are less threatened by churn than nontargeted customers.
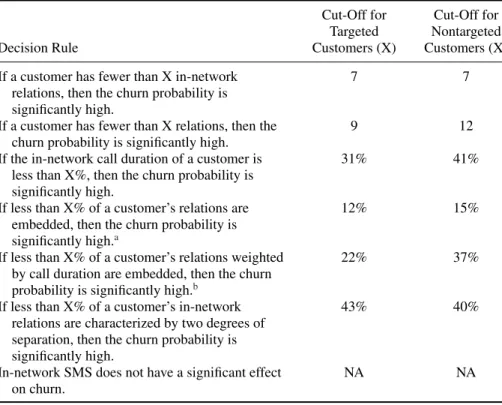
Table 4: Comparison of targeted and nontargeted customers.
Cut-Off for Cut-Off for Targeted Nontargeted
Decision Rule Customers (X) Customers (X)
If a customer has fewer than X in-network relations, then the churn probability is significantly high.
7 7
If a customer has fewer than X relations, then the churn probability is significantly high.
9 12
If the in-network call duration of a customer is less than X%, then the churn probability is significantly high.
31% 41%
If less than X% of a customer’s relations are embedded, then the churn probability is significantly high.a
12% 15%
If less than X% of a customer’s relations weighted by call duration are embedded, then the churn probability is significantly high.b
22% 37%
If less than X% of a customer’s in-network relations are characterized by two degrees of separation, then the churn probability is significantly high.
43% 40%
In-network SMS does not have a significant effect on churn.
NA NA
aBy definition, relations are embedded if Core 2 customers call friends and acquaintances within the network of the provider in more than 60.5% of the cases. The threshold of 60.5%
corresponds to the proportion of in-network phone calls averaged across the entire network.
bBy definition, relations as weighted by call duration are embedded if Core 2 customers call friends and acquaintances within the network of the provider in more than 56.5% of the cases. The threshold of 56.5% corresponds to the proportion of in-network phone calls as weighted by call duration averaged across the entire network.
Generally, targeted customers are characterized by significantly lower churn probabilities, indicating the power and importance of tailored marketing actions.
For example, the churn probability is significantly lower if the proportion of in- network call duration is higher than 31%, for targeted customers, and higher than 41%, for nontargeted customers. These findings are in line with Thirumalai and Sinha (2009), who argued that, for specialty goods in electronic retailing, high product customization results in high customer value. Mobile phones are specialty goods (Kotler, 2003), and direct marketing campaigns may be regarded as a special form of product customization. Mobile providers try to tailor existing services to the perceived needs of their customers, for example, through new packages that suit customers better. Our research shows that, indeed, product customization in the form of direct marketing campaigns creates value—targeted customers appreciate the effort and are less inclined to switch providers than nontargeted customers.
However, there are three notable exceptions: social relations, irrelevancy, and cultural differences. The strength of in-network social relations withstands
the power of marketing—the cut-off is seven for both targeted and nontargeted customers. The two degrees of separation metric shows counterintuitive results that can be explained by the insignificance of indirect influence exerted by friends of friends. Compared to Southeast Asia, for example, SMS is far less popular in Europe—our research found no segmentation rule for this particular variable.
Simulation Study
To address the issue of robustness, otherwise rendered impossible by the lack of comparative samples, and to prove that, under reasonable and realistic assumptions, our findings hold for various samples, we built a simulation model. The setup of the simulation model mimicked the segmentation exercise described in this article and provided the basis for formulating the decision rules. After simulating a general customer characteristic for the population, we drew balanced samples from that population. To construct and calibrate their churn models, typically in the form of logistic regressions, telecommunication providers draw such balanced samples from their entire customer bases. The equation of churn propensity scores derived from such a balanced sample is applied to the entire customer base, without new variable selection or parameter re-estimation.
In line with these principles, our simulation model was built as follows:
(i) We generated a network topological variable (x) for 100,000 customers, a transformed version of the network topological measures analyzed in this article, drawn from a standard normal distribution. Empirical evidence shows that, for example, both the number of relations and the call duration follow power-law distributions (e.g., Onnela et al., 2007a; Lambiotte et al., 2008) that can be approximated by normal distributions, after appropriate logarithmic transformation and standardization.
(ii) We incorporated one of the author’s expertise in building churn models for telecommunication companies worldwide and assumed that the cus- tomers of the telecommunication company churn with the probabilityp= 1/(1+exp(x+3)).
(iii) Seven percent of the customers churn. We drew the IDs of churning cus- tomers from the customer base randomly, based on individual churn prob- ability (p, see step (ii)) and reflecting the real-life behavior of customers—
the majority of the customers stay with their mobile providers, whereas only a minority of customers switches providers.
(iv) We segmented the customer base into two subsegments—n1, composed of those customers whose network topological measures are higher than a certain threshold (range−3.5 to+3.0, intervals 0.5), andn2, consisting of the rest of the customer base. Our empirical research had previously split the customer base into two subsegments, on the grounds of certain network topological measures, such as the number of relations within the network of the provider.
(v) We calculated the churn ratios of the two subsegments based on the random realization of churn (see step (iii)). In our empirical research, we calculated
the churn ratios of customers with a certain number of relations within the network of the provider, for example.
(vi) We calculated the difference between the churn ratios of the two subseg- ments, similarly to our empirical research, and tested its significance with a two-proportionz-test.
(vii) We drew balanced samples with a sample size ofn=1,000 from the cus- tomer base of 100,000. Churners were included randomly, with a probabil- ity of 7.1%, and nonchurners were included randomly, with a probability of 0.5%, resulting in balanced samples with around 50% of churners. Our empirical research also used balanced sampling (Table 1)—over 30% of Core 1 customers churned, compared with the significantly lower churn ratio (7%) of the company providing the data.
(viii) We repeated steps (iv) to (vi) for 100 balanced samples.
(ix) We compared the outcomes for the entire customer base with the outcomes for the balanced samples randomly selected (Figure 5).
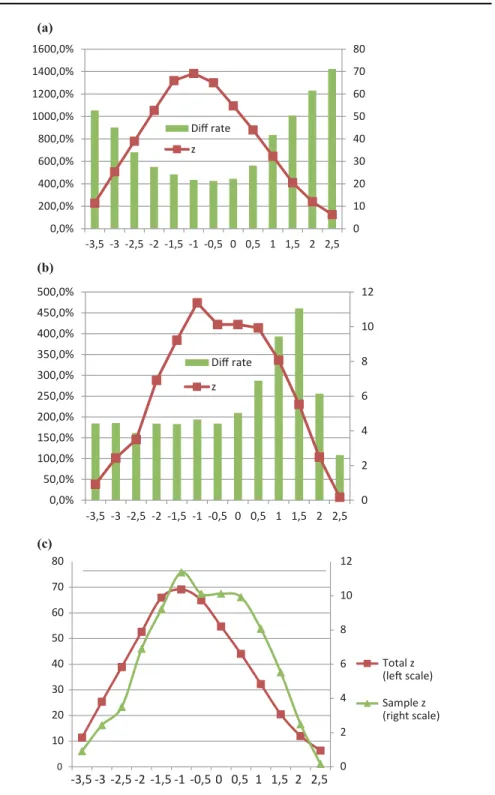
In the entire customer base (Figure 5a) and in a randomly selected balanced sample (Figure 5b), the most significant difference between the two churn ratios peaks at the same threshold. Even more importantly, the threshold value is the same for the entire customer base and for the aggregate of the balanced samples, with differences betweenzscores (Figure 5c). In some balanced samples (less than 10% of the cases) there was a slight deviation from the threshold for the entire customer base, but the difference was never larger than 0.5.
This simulation exercise showed that, under certain assumptions, the thresh- old that provides the basis for formulating the decision rule is the same for the entire customer base and for the balanced samples. Therefore, most probably, our empirical findings would hold for various other balanced samples drawn from the customer base, as well as for the customer base itself.
SUMMARY, LIMITATIONS, AND EXTENSIONS
This article used SNA to explain why customers with identical mobile contracts and similar perceived values may—or may not—switch providers. By analyzing the structural characteristics of telecommunication networks, SNA revealed new and intriguing results that would have been likely overlooked by traditional churn models. To our knowledge, the use of network measures for this purpose is an entirely novel approach in the field.
In particular, by analyzing network topological properties that may contribute to the development of a reliable churn model, this article assessed the impact of network characteristics on customer churn. The research relied on real-life call and SMS records of approximately 26,000 customers calling or texting almost 800,000 people within a 6-month period. The analysis employed a unique snowball sampling method—starting with an initial database of 0.04% of the customers resident in a city, the final sample covered 30% of the customers living in that city.
After defining seven customer-level network characteristics, the study segmented the customers into two distinct groups with significantly different churn ratios.
Figure 5: Sample robustness. (a) Simulation results for the entire customer base.
(b) Simulation results for a randomly selected balanced sample. (c) Comparison of the simulation results.
0 10 20 30 40 50 60 70 80
0,0%
200,0%
400,0%
600,0%
800,0%
1000,0%
1200,0%
1400,0%
1600,0%
-3,5 -3 -2,5 -2 -1,5 -1 -0,5 0 0,5 1 1,5 2 2,5 Diff rate
z
0 2 4 6 8 10 12
0,0%
50,0%
100,0%
150,0%
200,0%
250,0%
300,0%
350,0%
400,0%
450,0%
500,0%
-3,5 -3 -2,5 -2 -1,5 -1 -0,5 0 0,5 1 1,5 2 2,5 Diff rate
z
0 2 4 6 8 10 12
0 10 20 30 40 50 60 70 80
-3,5 -3 -2,5 -2 -1,5 -1 -0,5 0 0,5 1 1,5 2 2,5
Total z (le scale) Sample z (right scale) (a)
(b)
(c)
Meaningful segmentations were achieved with reference to the network topological properties capturing the number of relations and the embeddedness of customers.
(The metric related to in-network SMS constituted the exception.) By defining an appropriate threshold, the network topological description of each segment could be given. The results suggested that the network characteristics of customers have a significant impact on the churn ratio. In line with the results of Dasgupta et al.
(2008) and Richter et al. (2010), our findings indicate that, to predict customer churn, social network information might be sufficient in itself.
Customers targeted by marketing campaigns and nontargeted customers were segmented separately. The findings suggested that targeted customers are less threatened by churn than nontargeted customers—to achieve a churn probability comparable to that of targeted customers, nontargeted customers need to meet more restricted conditions in terms of degree, in-network call duration, and (weighted) embeddedness. This highlights the importance of the provider’s marketing actions, and of its effectiveness, and is in line with SET, which posits that marketing campaigns help by increasing the perceived value of the relationship.
The comparison between traditional churn models and risk assessment mod- els emphasized differences in how far ahead they can predict churn. Risk assess- ment models incorporate network topological properties, which are more stable over time than phone usage patterns. Relatively long-term prediction is therefore unrealistic without network-related metrics—service providers cannot influence their customers’ friendship circles (e.g., the number of in-network relations was not influenced by marketing campaigns) in the same way they can influence their phone usage patterns (e.g., by offering more favorable rates after 5:00 pm). Thus, social network variables may provide early warnings on churn, sometimes even before the customers actively consider switching providers.
The extensive experimental results of Verbeke et al. (2012) showed that a surprisingly small number of variables (8–12) suffice to build an effective and powerful customer churn prediction model—of these, call behavior statistics and usage attributes were the most solicited type of variables, and seemed to be the best predictors of future churn. Socio-demographic variables, financial information, and marketing-related variables were also indispensable sources of information for churn prediction, with each of the three categories representing around 20%
of the selected variables. Verbeke et al. (2012) reported that churn models using information from each category yield better predictive performance, but stressed the predictive power of social network variables and argued that their incorporation into models most probably yields further enhanced performance. Our research supports others’ intuition, by providing clear evidence that individual network characteristics have considerable impact on churn probabilities.
Our research can be extended in a number of ways, not least to overcome its limitations. First of all, snowball sampling impacts the discovery of churn in a nontrivial manner. On the one hand, customers with the highest degrees are overrepresented in the sample (Lee et al., 2006; Ahn et al., 2007; Kurant et al., 2010, 2011; Ye et al., 2010; Wang et al., 2011)—on the other, this network sampling bias may be exploited as an asset. Customers with the highest number of connections generate the highest revenue for the mobile company—marketers need to understand this segment and design retention strategies, if needed. In
effect, oversampling customers with the highest number of contacts might even be beneficial for the mobile provider—Maiya and Berger-Wolf (2011) argued that strategic sampling biases can be advantageous, because they push the sampling process toward inclusion of desired properties.
A straightforward consequence of oversampling customers with the highest number of connections is the undersampling of customers with the least number of contacts. Undersampled customers may be loosely connected to the giant compo- nent, or may belong to small components disconnected from the giant component.
The snowball sampling algorithm resulted in a single component, disregarding customers in disconnected, smaller components. However, previous empirical re- search showed that the number of disconnected customers is fairly low (Onnela et al., 2007a, 2007b; Dong et al., 2009). Moreover, disconnected customers are two-sided coins. On the one side, if one member of the community churns, then, most probably, all members of the community will churn within a short time interval. On the other, their monetary impact is small, even negligible. Thus, un- dersampling customers with few contacts allows us to focus on customers who can deliver a long-term competitive advantage to the mobile operator, if retained.
Second, our results are promising, but limited by the scope of the dataset, which is itself based on a single sample. It is imperative to understand the scaling effects of the decision rules when the sample size increases or decreases, or when samples from other telecommunication networks are drawn, but our access to such data was limited. Although our simulation study showed that the decision rules hold, such finding cannot be generalized to all populations—intuitively, the decision rules do not hold, or hold with a different threshold, in countries with radically different phoning habits. Nevertheless, social network variables are also likely to have considerable impact on churn probabilities in these countries, if with different decision rules.
Third, building a sophisticated churn model that includes both the widely used attributes (socio-demographic variables, phone usage patterns, financial in- formation, and marketing-related variables) and the advocated network topological properties was not feasible. Once the network topological properties of customers were built into existing churn models, the evaluation of their additional explanatory power was of major importance. Various network metrics (e.g., the weighted and the unweighted versions) may correlate highly with one another—the mobile oper- ators should add to their churn models only those noncorrelating network metrics that improve their predictive performance significantly. This would require access to substantial additional and mostly confidential data that were otherwise not at hand. However, access to such information would allow researchers to identify the most important variables leading to churn, and to show that social network vari- ables are indeed among the top 10–20 most predictive variables. Ranking the social network variables according to their explanatory power would allow measurement of the relative importance of customer network characteristics, and of the phone usage patterns—it would also allow estimation of the extent of the performance increase, and of the related cost savings.
The initial results of our pilot study revealed that several network topologi- cal measures were included in the best performing decision tree, neural network, and logistic regression models for churn prediction; the best performing network
variables were the number of in-network relations and weighted embeddedness.
This suggests that, indeed, network variables bring marginal value in improved prediction performance relative to variables already employed in standard churn prediction models. Unfortunately, from the data at hand, the extent of the improved prediction performance could not be extracted. However, some very recent pub- lications showed that social network variables improve the performance of churn models significantly (Richter et al., 2010; Nitzan & Libai, 2011; Sauvage, 2011;
KXEN, 2012; XTRACT, 2012; Zhang, Zhu, Xu, & Wan, 2012). To our knowl- edge, these are the only works to date on the extent of the improved prediction performance.
REFERENCES
Ahn, J.-H., Han, S. P., & Lee, Y. S. (2006). Customer churn analysis: Churn determinants and mediation effects of partial defection in the Korean mobile telecommunications service industry. Telecommunications Policy, 30(10–
11), 552–568.
Ahn, Y. Y., Han, S., Kwak, H., Moon, S., & Jeong, H. (2007). Analysis of topolog- ical characteristics of huge online social networking services.Proceedings of the 16th International Conference on World Wide Web, Banff, Alberta, Canada. New York, NY: AMC, 835–844.
Albert, R., & Barab´asi, A.-L. (2002). Statistical mechanics of complex networks.
Reviews of Modern Physics,74(1), 47–97.
Atkinson, R., & Flint, J. (2001). Accessing hidden and hard-to-reach populations:
Snowball research strategies.Social Research Update,33(2), 1–4.
Battiston, S., Gatti, D. D., Gallegati, M., Greenwald, B., & Stiglitz, J. (2007).
Credit chains and bankruptcy propagation in production networks.Journal of Economic Dynamics and Control,31(6), 2061–2084.
Biernacki, P., & Waldorf, D. (1981). Snowball sampling: Problems and techniques of chain referral sampling.Sociological Methods Research,10(2), 141–163.
Bolton, R. N., Kannan, P. K., & Bramlett, M. D. (2000). Implications of loyalty program membership and service experiences for customer retention and value.Journal of the Academy of Marketing Science,28(1), 95–108.
Boss, M., Elsinger, H., Summer, M., & Thurner, S. (2004). Network topology of the interbank market.Quantitative Finance,4(6), 677–684.
Caverlee, J., & Webb, S. (2008). A large-scale study of Myspace: Observations and implications for online social networks.Proceedings of the International Conference on Weblogs and Social Media, Seattle, Washington. Menlo Park, CA: The AAAI Press, 36–44.
Choi, T. Y., & Kim, Y. (2008). Structural embeddedness and supplier management:
A network perspective.Journal of Supply Chain Management,44(4), 5–13.
Dasgupta K., Singh, R., Viswanathan, B., Chakraborty, D., Mukherjea, S., Nanavti, A., & Joshi, A. (2008). Social ties and their relevance to churn in mo- bile telecom networks.Proceedings of the 11th International Conference on
Extending Database Technology: Advances in Database Technology, Nantes, France. New York, NY: AMC, 668–677.
De Choudhury, M., Lin, Y. R., Sundaram, H., Candan, K. S., Xie, L., & Kelliher, A. (2010). How does the data sampling strategy impact the discovery of information diffusion in social media?Proceedings of the 4th International AAAI Conference on Weblogs and Social Media, Washington, DC. Menlo Park, CA: The AAAI Press, 34–41.
Dong, Z. B., Song, G. J., Xie, K. Q., & Wang, J.-Y. (2009). An experimental study of large-scale mobile social network.Proceedings of the 18th International Conference on World Wide Web, Madrid, Spain. Menlo Park, CA: The AAAI Press, 1175–1176.
Driscoll, M. (2010).Case study: A leading North-American Telecom—The social effect: Predicting telecom customer churn with call data. San Francisco, CA:
Presentation made at the Predictive Analytics World Conference.
Dierkes T., Bichler, M., & Krishnan, R. (2011). Estimating the effect of word-of- mouth on churn and cross-buying in the mobile phone market with Markov logic networks.Decision Support Systems,51(3), 361–371.
Ebbes, P., Huang, Z., & Rangaswamy, A. (2012). Subgraph sampling methods for social networks: The good, the bad, and the ugly. Available at SSRN:
http://ssrn.com/abstract=1580074, 1–49.
Everett, M. G., & Borgatti, S. P. (1999). The centrality of groups and classes.
Journal of Mathematical Sociology,23(3), 181–201.
Fleiss, J. L., Levin, B. and Paik, M. C. (2004).Statistical methods for rates and proportions(3rd ed.). Hoboken, NJ: Wiley.
Freeman, L. C. (1979). Centrality in social networks: Conceptual clarification.
Social Networks,1(3), 215–239.
Garlaschelli, D., & Loffredo, M. I. (2005). Structure and evolution of the world trade network.Physica A: Statistical Mechanics and its Applications,233(1), 138–144.
Gerpott, T., Rams, W., & Schindler, A. (2001). Customer retention, loyalty and satisfaction in the German mobile cellular telecommunications market.
Telecommunications Policy,25(4), 249–269.
Gjoka, M., Kurant, M., Butts, C. T., & Markopoulou, A. (2010). Walking in Facebook: A case study of unbiased sampling of OSNs. Proceedings of IEEE INFOCOM 2010, San Diego, CA: IEEE, 2498–2506.
Goodman, L.A. (1961). Snowball sampling. Annals of Mathematical Statistics, 32(1), 148–170.
Granovetter, M. (1985). Economic action and social structure: The problem of embeddedness.American Journal of Sociology,91(3), 481–510.
Heckathorn, D. D. (1997). Respondent-driven sampling: A new approach to the study of hidden populations.Social Problems,44(2), 174–199.
Hill, S., Provost, F.J., & Volinsky, C. (2007): Learning and inference in massive so- cial networks. Extended Abstract.The 5th International Workshop on Mining
and Learning with Graphs, Firenze, Italy. CeDER Published Papers, Report No. CeDER-PP-2007–05. New York University Faculty Digital Archive, NY, 1–4. Available at https://archive.nyu.edu/handle/2451/27812
Hung, S. Y., Yen, D. C., & Wang, H. Y. (2006). Applying data mining to telecom churn management.Expert Systems with Applications,31(3), 515–524.
Illenberger, J., Fl¨otter¨od, G., & Nagel, K. (2008). An approach to correct biases induced by snowball sampling. VSP Working Paper No 08–16, TU Berlin, Transport Systems Planning and Transport Telematics, Berlin, Germany.
Kim, S. Y., Jung, T. S., Suh, E. H., & Hwang, H. S. (2006). Customer segmentation and strategy development based on customer lifetime value: A case study.
Expert Systems with Applications,31(1), 101–107.
Kim, Y., Choi, T. Y., Yan, T., & Dooley, K. (2011). Structural investigation of supply networks: A social network analysis approach.Journal of Operations Management,29(3), 194–211.
Kim, H. S. & Yoon, C. H. (2004). Determinants of subscriber churn and customer loyalty in the Korean mobile telephony market.Telecommunications Policy, 28(9–10), 751–765.
Kiss, C., & Bichler, M. (2008). Identification of influencers—Measuring influence in customer networks.Decision Support Systems,46(1), 233–253.
Kotler, P. (2003).Marketing management. Upper Saddle River, NJ: Prentice Hall.
Kurant, M., Markopoulou, A., & Thiran, P. (2010). On the bias of BFS (Breadth First Search). Proceedings of the 22nd International Teletraffic Congress.
Amsterdam, The Netherlands:IEEE Inc., 1–8.
Kurant, M., Markopoulou, A., & Thiran, P. (2011). Towards unbiased BSF sam- pling. IEEE Journal on Selected Areas in Communications, 29(9), 1799–
1809.
KXEN (2012). Churn model accuracy improved by 47% with InfiniteInsightTM social. Accessed June 19, 2012, available at http://www.kxen.com/
Customers/Telekomunikacja+Polska+%28TPSA-Orange+Poland%29.
Kwak, H., Han, S., Ahn, Y. Y., Moon, S., & Jeong, H. (2006). Impact of snow- ball sampling ratios on network characteristics estimation: A case study of Cyworld. Technical Report CS-TR-2006–262, Daejeon, Korea: KAIST, 1–8.
Lambiotte, R., Blondel, V. D., Kerchove, C., Huensa, E., Prieur, C., Smoredac, Z., & Doorena, V. (2008). Geographical dispersal of mobile communication networks.Physica A,387(21), 5317–5325.
Lee, S. H., Kim, P. J., & Jeong, H. (2006). Statistical properties of sampled networks.Physical Review E,73(1), 16102.
Lee, J., Lee, J., & Feick, L. (2001). The impact of switching costs on the customer satisfaction-loyalty link: Mobile phone service in France.Journal of Services Marketing,15(1), 35–48.
Li, S., Madhok, A., Plaschka, G., & Verma, R. (2006). Supplier-switching inertia and competitive asymmetry: A demand-side perspective.Decision Sciences, 37(4), 456–476.
Lima, E. O. (2009). Domain knowledge integration in data mining for churn and customer lifetime value modelling: New approaches and applications. PhD thesis, University of Southampton, School of Management.
Maicas, J. P., Polo, Y., & Sese, F. J. (2009). The role of (personal) network effects and switching costs in determining mobile users’ choice.Journal of Information Technology,24(2), 160–171.
Maiya, A. S., & Berger-Wolf, T. Y. (2011). Benefits of bias: Towards better char- acterization of network sampling. Proceedings of the 17th ACM SIGKDD International Conference on Knowledge Discovery and Data Mining. San Diego, CA. New York, NY: AMC, 105–113.
Metters, R., King-Metters, K., & Pullman, M. (2003).Successful service operations management. Mason, OH: Thomson/South-Western.
Mislove, A., Marcon, M., Gummadi, K. P., Druschel, P., & Bhattacharjee, S.
(2007). Measurement and analysis of online social networks.Proceedings of the 7th ACM SIGCOMM conference on Internet measurement, San Diego, CA. New York, NY: AMC, 29–42.
Mozer, M. C., Wolniewicz, R., Grimes, D., Johnson, E., & Kaushanksy, H. (2000).
Predicting subscriber dissatisfaction and improving retention in the wireless telecommunications industry.IEEE Transactions on Neural Networks,11(3), 690–696.
Nagurney, A. (2007).Supply chain network economics. Book series: New dimen- sions in networks, Vol. 6. Northampton, MA: Edward Elgar.
Nanavati, A., Singh, R., Chakraborty, D., Dasgupta, K., Mukherjea, S., Das, G., Gurumurthy, S., & Joshi, A. (2008). Analyzing the structure and evolution of massive telecom graphs. IEEE Transactions on Knowledge and Data Engineering,20(5), 703–718.
Neslin, S., Gupta, S., Kamakura, W., Lu, J., & Mason, C. (2006). Detection de- fection: Measuring and understanding the predictive accuracy of customer churn models.Journal of Marketing Research,43(2), 204–211.
Nitzan, I. & Libai, B. (2011). Social effects on customer retention. Journal of Marketing,75(6), 24–38.
Onnela, J. P., Saram¨aki, J., Hyv¨onen, J., Szab´o, G., Lazer, D., Kaski, K., Kert´esz, J., & Barab´asi, A. L. (2007a). Structure and tie strengths in mobile communi- cation networks.Proceedings of the National Academy of Sciences (PNAS), 104(18), 7332–7336.
Onnela, J. P., Saram¨aki, J., Hyv¨onen, J., Szab´o, G., Meneses, M. A., Kaski, K., Barab´asi, A. L., & Kert´esz, J. (2007b). Analysis of a large-scale weighted network of one-to-one human communication. New Journal of Physics, 9(6/179), 1–27.
Palla, G., Barab´asi, A.-L., & Vicsek, T. (2007). Quantifying social group evolution.
Nature,446(7136), 664–667.
Radosavljevik, D., Putten, P., & Larsen, K. K. (2010). The impact of experimental setup in prepaid churn prediction for mobile telecommunications: What to