The quest for improvement of cardiac resynchronization therapy
Doctoral Dissertation
Eszter Mária Végh MD
Doctoral School of Basic Medicine Semmelweis University
Supervisor: László Gellér, MD, PhD, associate professor Official reviewers: Zoltán Járai MD, PhD, honorary professor
András Vereckei MD, PhD, associate professor
Head of the Final Examination Committee:
Anikó Somogyi MD, PhD, professor Members of the Final Examination Committee:
Lívia Jánoskuti MD, PhD, associate professor Gábor Duray MD, PhD
Budapest
2016
Table of contents
List of abbreviations ... 6
1. Introduction ... 8
1.1. The cardiac resynchronization therapy ... 8
1.2. PR interval ... 12
1.3. Electrocardiography based score for risk stratification ... 13
1.4. Vectorcardiography-based T-wave area in prediction of therapy ... 13
1.5. T-wave area in prediction of outcome ... 13
1.6. Hyponatremia ... 14
1.7. Hypothyroidism ... 14
1.8. Device measured physical activity ... 14
1.9. Coronary sinus side branch stenting ... 15
2. The aims of our studies ... 16
3. Methods ... 17
3.1. Study population of the therapy prediction projects ... 17
3.2. Echocardiography ... 18
3.3. ECG registration ... 18
3.4. Statistical analysis ... 18
3.5. Project-specific methods ... 19
3.5.1. PR interval... 19
3.5.1.1. Statistical analysis of the substudy... 19
3.5.2. ECG-based risk stratification score ... 20
3.5.2.1. ECG measurements ... 20
3.5.2.2. Construction of the score ... 21
3.5.3. Vectorcardiography (VCG) based T-wave area ... 22
3.5.3.1. VCG analysis ... 23
3.5.4. T-wave area in prediction of outcome ... 25
3.5.4.1. Substudy population ... 25
3.5.4.2. Statistical analysis of the substudy... 25
3.5.5. Pre- and postoperative hyponatremia ... 25
3.5.6. Hypothyroidism ... 26
3.5.7. Device measured physical activity ... 26
3.5.8. The study population of the coronary sinus side branch stenting study ... 28
3.5.8.1. Statistical analysis of the coronary sinus side branch stenting study ... 33
4. Results ... 34
4.1. PR interval ... 34
4.1.1. Baseline characteristics ... 34
4.1.2. Cardiac dimensions and reverse remodeling ... 36
4.1.3. Clinical outcomes and survival ... 37
4.2. ECG-based risk stratification score ... 42
4.2.1. Baseline characteristics ... 42
4.2.2. QRS duration ... 45
4.2.3. Summed V1 amplitude ... 46
4.2.4. Intrinsicoid deflection onset duration ... 46
4.2.5. ECG score ... 46
4.2.6. ECG score performance in patients with specific conduction blocks ... 49
4.3. T-wave area in prediction therapy response ... 50
4.3.1. Patient characteristics ... 50
4.3.2. ECG & VCG analysis ... 51
4.3.3. Echocardiographic response predicted by ECG and VCG variables ... 52
4.3.4. T-wave area as an additional predictor of echocardiographic response ... 54
4.4 T-wave area in prediction of outcome ... 57
4.4.1. Patient characteristics ... 57
4.4.2. The predictive ability of areas derived from the VCG ... 59
4.4.3. Echocardiographic versus clinical outcome ... 64
4.4.4. T-wave area as additional predictor of mortality and HF hospitalization .... 66
4.5. Hyponatremia ... 68
4.5.1. Baseline characteristics ... 68
4.5.2. The predictive ability of follow-up hyponatremia ... 72
4.6. Hypothyroidism ... 74
4.6.1. Baseline characteristics ... 74
4.6.2. Hypothyroidism in prediction of long-term outcomes ... 77
4.7. Device measured physical activity ... 78
4.7.1. Baseline characteristics ... 78
4.7.2. Prediction of HF hospitalization ... 80
4.7.3. Prediction of composite outcome ... 80
4.7.4. Activity level and CRT response ... 84
4.8. The coronary sinus side branch stenting... 84
4.8.1. The results of long-term follow-up ... 84
4.8.2. The extraction of the stented lead ... 87
5. Discussion ... 89
5.1. PR interval ... 89
5.1.1. General prognostic impact of prolonged PR interval ... 89
5.1.2. Prognostic effect of prolonged PR interval in patients receiving CRT ... 89
5.2. ECG-based risk stratification score ... 91
5.2.1. Electrical resynchronization by QRS evaluation ... 91
5.2.2. Usefulness of the different components of the proposed ECG score ... 92
5.2.3. Clinical perspective ... 93
5.2.4. Limitations ... 94
5.3. T-wave area as an additional predictor of therapy response ... 95
5.3.1. Potential clinical implications ... 97
5.3.2. Limitations ... 97
5.4. T-wave area in prediction of outcome ... 97
5.4.1. T-wave area, an additional predictor of long-term clinical response to CRT ... 98
5.4.2. Potential clinical implications ... 99
5.4.3. Limitations ... 100
5.5. Hyponatremia ... 100
5.6. Hypothyroidism ... 101
5.7. Device measured physical activity ... 103
5.8. The coronary sinus side branch stenting... 105
6. Conclusion ... 107
7. Summary ... 109
8. Összefoglalás ... 110
9. References ... 111
10. List of publications ... 133
Related to the thesis: ... 133
Not related to the thesis: ... 134
11. Acknowledgement ... 136
List of abbreviations
ACE angiotensin-converting-enzyme, 6MWT 6-minute walk test
AF atrial fibrillation
ARB angiotensin II type 1 receptor blocker, AV atrio-ventricular
CABG coronary artery bypass graft, CI confidence interval
CMP cardiomyopathy
CPX cardiopulmonary exercise testing CRT cardiac resynchronization therapy CS coronary sinus
ECG electrocardiogram HF heart failure
HFH heart failure hospitalization HR hazard ratio
HTLD composite endpoint of HF hospitalization, heart transplantation, left ventricular assist device, or death.
ID intrinsicoid deflection LBBB
LAD
left bundle branch block, left axis deviation LV left ventricle
LVAD left ventricular assist device LVEF left ventricular ejection fraction,
LVIDd left ventricular internal dimension diastole;
LVIDs left ventricular internal dimension systole NYHA New York Heart Association
OR odds ratio
PCI percutaneous coronary intervention PNS phrenic nerve stimulation
RBBB right bundle branch block RV right ventricle
TSH thyroid-stimulating hormone VCG vectrocardiogram
1. Introduction
Since the two decades of clinical application, cardiac resynchronization therapy (CRT) has revolutionized the patient care with heart failure and dyssynchrony. (1-3) It also catalyzed the cooperation among different field of cardiology, including electrophysiology, heart failure and cardiac imaging. (4)
1.1. The cardiac resynchronization therapy
The ventricular myocardium is activated by a electrical waveform, through the His- Purkinje system. In altered electrochemical substrates, conduction gets impaired, that can result uneven and slower electrical propagation, leading to an electrical, subsequently mechanical dyssynchrony. The delayed activation is most often the results of left bundle branch block (LBBB), that results interventricular and intraventricular dyssynchrony. Long-standing cardiac dyssynchrony leads to a pathologic remodeling, causing ventricular dilatation, worsening of systolic and diastolic function. Cardiac resynchronization can be achieved by stimulating the delayed ventricular area, by adding a left ventricular lead to a standard pacemaker or implantable defibrillator system. Traditionally, the left ventricular lead is introduced to the side-branches of the coronary sinus (CS).
Nowadays, CRT is a well-established therapeutic strategy for patients with advanced congestive heart failure (HF) and prolonged QRS complex (5-9). It has been shown to improve cardiac pump function, HF symptoms and quality of life. (10)
CRT reduces mortality and morbidity significantly in this population, but despite its proven clinical value, a significant minority of patients do not derive benefit from CRT;
termed “non-responders.” (6, 11-14) The ratio of non-responders ranges from 20-30%
(in studies using soft clinical endpoint, as improvement in NYHA class or quality of life) to 30-50%, where echocardiographic reverse remodeling was examined. (15) Reasons for non-response are likely multifactorial, and part of the explanation may be absence of significant dyssynchrony prior to treatment, or ineffective resynchronization due to suboptimal device programming or lead placement. (16, 17) After the initial learning curve, biventricular devices can be implanted with a success rate ˃90%,
however the long-term device-related event rate remains higher, than in single- or dual- chamber pacemakers and defibrillators. (18) Futhermore, the implantation of biventricular devices and multiple leads mean considerable costs to the health-care system, therefore the best possible application and patient selection is expected from human and financial point of view.
The successful CRT can be forwarded by the following factors:
improved patient selection,
optimal lead positioning,
therapy optimization, and
multidisciplinary postoperative care.
According to the recent European guidelines, CRT is indicated for patients with heart failure and wide QRS complex (Table 1). A QRS duration ≥150 ms is a strong predictor of CRT response, while values between 120 and 150 ms require further evidence. (19, 20) More recently, LBBB morphology of the QRS complex has been shown to be the strongest predictor of CRT response. (8, 21-26) However, definition of LBBB pattern is drawing increased attention: conventionally - and in major clinical trials (MADIT-CRT (8), REVERSE (27)) - it is defined as QRS duration of 121-130 ms, negative QRS in V1 lead and absence of Q wave in V5-6, I and aVL. Clincal guideline of ESC suggest stricter criteria, while definition of Strauss and colleagues require mid-QRS notching or slurring in two or more contiguous lead of V1, V2, V5, V6, I or aVL, as well. Recently, two studies has demonstrated, that refinement of criteria can predict better response, compared to the conventional ones. (25, 28) A relation was also found between the presence of notching or slurring and the mechanical LBBB pattern in 2D longitudinal strain echocardiography.
In patients with RBBB pattern or intraventricular conduction disturbances, the benefits of CRT could not be verified in MADIT-CRT and RAFT trials, or even worse outcomes were found, except for cases with a favourable lead placement. (29)
Table 1. ESC guidelines for CRTv(30) CRT is indicated (class I)
Sinus rhythm, LBBB with a QRS duration >150 ms, and NYHA class II, III, and ambulatory IV (evidence level A)
Sinus rhythm, LBBB with a QRS duration 120–150 ms, and NYHA class II, III, and ambulatory IV (evidence level B)
Conventional pacemaker, high percentage right ventricular pacing, and NYHA class III and ambulatory IV (evidence level B)
CRT should be considered (class IIa)
Sinus rhythm, non-LBBB with a QRS duration >150 ms, and NYHA class II, III, and ambulatory IV (evidence level B)
Chronic atrial fibrillation, a QRS duration ≥120 ms, NYHA class III and ambulatory IV, and near to 100% biventricular pacing guaranteed or concomitant atrioventricular junction ablation (evidence level B)
Chronic atrial fibrillation with uncontrolled heart rate in candidates for atrioventricular junction ablation (evidence level B)
Conventional pacemaker indication and expected high percentage of ventricular pacing (evidence level B)
CRT can be considered (class IIb)
Sinus rhythm, non-LBBB with a QRS duration 120–150 ms, and NYHA class II, III, and ambulatory IV (evidence level B)
CRT is not recommended (class III)
Sinus rhythm, QRS duration <120 ms, and NYHA class II, III, and ambulatory IV (evidence level B)
All patients should have chronic heart failure and a left ventricular ejection fraction
≤35% despite adequate medical treatment. Abbreviations: CRT, cardiac resynchronization therapy; LBBB, left bundle branch block.
Whether the presence of mechanical dyssynchrony has a predictive value, has been debated extensively in the past years. After promising single-center studies, in PROSPECT trial, echocardiography-based mechanical dyssynchrony indices failed to improve the patient selection. (13) The disappointing outcomes can be partly explained
by the usage of tissue Doppler and M-mode techniques, that might be improved by speckle tracking methods. (31) However, patients with mechanical dyssynchrony and narrow QRS did not benefit from CRT, according to EchoCRT trial. (32)
Ischaemic etiology of cardiomyopathy occurs in more than half of CRT patients. Major trials have confirmed, that these patients has non-inferior outcome, compared to the non-ischaemic etiology. (8, 33) Although, presence of scarring can affect the response to CRT, as extensive scarring can diminish the viable tissue that can be recruited by the resynchronization, and pacing in the scar tissue can be ineffective. Therefore, nuclear imaging and cardiac MRI can be helpful in prediction of the outcome of CRT. (34, 35) In early studies of resychronization it was demonstrated, that pacing of the left ventricular free wall can change haemodynamics. (2) Initially, possible lead positions were based on anatomy, however the subsequent studies did not confirm a specific location. Singh and colleagues suggested to avoid apical positions, (36) but other studies showed no difference in outcome, based on apical or basal lead position. (37) Similarly, the benefit of posterolateral pacing site over the anterior wall was debated.
(37, 38) Apparently, a personalized lead positioning strategy is required to achieve optimal resynchronization, that can be facilitated by speckle tracking imaging or by monitoring left ventricular electrical delay during implantation. (39, 40) With novel technological developments, multipole leads and endocardial pacing opportunities provide new alternatives for even more effective resynchronization, with finding the optimal pacing site or transfer multisite pacing.
After the implantation and during follow-up, adjusting of the RV and LV pacing can optimize the ventricular filling, inter- and intraventricular resynchronization. In single- center studies, optimization has improved haemodynamic function and clinical response. (41, 42) However, randomized clinical trials could not serve with unambiguous evidences for echocardiography-based optimization. Besides, the procedure requires multiple, skilled operators from different fields, that is logistically challenging and costy in everyday clinical practice. In canine models, vectorcardiography facilitated optimization, that translated into acute haemodynamic improvement. (43) The novel electrogram-based, vendor-specific AdaptiveCRT algorithm was associated with superior results in terms of outcome, in patients whose LV fusion was optimized. (44)
In order to achieve the electrical and mechanical remodeling, effective biventricular pacing is required. It was shown, that >95% of the heart beats should be biventricular paced, to reach the benefits of CRT. Loss of capture is often observed in patients with atrial fibrillation, that can result suboptimal therapy response in this group of patients.
In this patient group, atrioventricular nodal ablation can increase the therapy response rate to the level of patients in sinus rhythm. (45)
The postoperative care of CRT patients is not well studied yet, however a multidisciplinary approach was associated with improved clinical outcomes and reduced number of hard clinical endpoints, in a single-center experience study. (4) Another study has demonstrated, that during a comprehensive protocol-driven evaluation most of the non-responders had an identifiable reason for suboptimal response, as inadequate device settings (47%), suboptimal mechanical treatment (32%), arrhythmias (32%), inappropriate lead position (21%) or lack of baseline dyssynchrony (9%). After multidisciplinary recommendations device settings and/or medical therapy modifications resulted fewer adverse events in this group. (46) Furthermore, early risk stratification can help to point out those patients, who need a more frequent follow-up at device, heart failure or internal medicine specialists.
With my colleagues, I intended to investigate this complex process from patient selection to post-operative care and contribute to improved care with the following projects:
1.2. PR interval
Atrioventricular dyssynchrony with resulting impaired left ventricular filling is common in patients with wide QRS complex on ECG, and especially in the setting of concomitant prolonged PR interval with AV block I. (47-49). Mechanistically, correction of the prolonged PR interval by CRT pacing should have a positive effect on ventricular filling in diastole “on top of“ the resynchronization of ventricular contraction during systole. On the other hand, a prolonged PR interval can also be a marker of more advanced heart disease and therefore associated with a poorer prognosis (49). There is conflicting evidence regarding the clinical outcomes in CRT for patients with prolonged PR interval (50-53).
1.3. Electrocardiography based score for risk stratification
QRS duration and morphology reflect the electrical timing and activation sequence of the ventricles, hence it is intuitive to evaluate the effect of CRT using pacing-induced changes in ECG findings, since reversal of the electrical pathology indicates a potentially good effect of the treatment. Consequently, an easy to use ECG-based algorithm for optimization of pacemaker lead placement and immediate prediction of response and clinical outcome would be a valuable tool.
1.4. Vectorcardiography-based T-wave area in prediction of therapy
The QRS complex reflects the sequence of electrical activation, that is: depolarization, throughout the ventricular wall. While this activation sequence is clearly central to electrical dyssynchrony, it ignores the importance of the equally vital repolarization phase of the myocardium. We hypothesized that the T-wave may provide additional information, since it is reflective of the plateau and repolarization phases of the myocardial action potential. These phases are determined by the activity of many ion channels, including those that regulate intracellular calcium concentrations, that mediate contraction and relaxation.
In order to explore the predictive value of the T-wave, we retrospectively investigated the electrocardiograms from a large cohort of CRT patients. For more comprehensive analysis of the T-wave, ECG signals were converted into vectorcardiograms (VCG).
The advantage of the VCG is that it contains three-dimensional information of the electrical forces within the heart and might provide more valuable information than the one-dimensional ECG.
1.5. T-wave area in prediction of outcome
Then we examined whether the T-wave area in LBBB patients also predicts the long- term clinical outcome to CRT. In order to do so, we extended the patient group from the previous study with CRT patients with known clinical follow-up of at least 3 years. This potential predictive value was also compared to other relevant electrocardiographic parameters.
1.6. Hyponatremia
Hyponatremia is a common electrolyte abnormality, seen in approximately 20%
of patients with HF and it has been particularly demonstrated to be of much prognostic significance in HF population. (54-57) However, there is a paucity of data looking at how serum sodium levels impact patients who receive CRT.
1.7. Hypothyroidism
Notably, hypothyroidism is a frequent comorbid condition for patients with HF, but to our knowledge has not been previously specifically evaluated for its impact on CRT response. Persistent subclinical hypothyroidism has been associated with the development of HF in patients with and without underlying heart disease. (58, 59) The Health, Aging, Body Composition population based study showed that participants with TSH ≥ 7µU/mL had 3 times higher HF events than euthyroid patients (60).The Cardiovascular Health Study showed a greater incidence of HF events among participants >65 years of age with TSH ≥ 10 µU/mL (58). However, there are also studies with contradictory findings where no relationship was established between hypothyroidism and cardiovascular risk. (61, 62) The prevalence of hypothyroidism in HF patients has been reported from 7% for overt hypothyroidism to 14% for subclinical hypothyroidism. (58, 63) Guidelines from the American College of Cardiology recommend workup for all cases of HF to include screening with thyrotropin levels.
(64)
1.8. Device measured physical activity
For effective clinical management of heart failure patients living with CRT, early risk- stratification to identify potential non-response, and also finding simple and reliable method to evaluate the functional status is important. Although 6-minute walk test (6MWD) and cardiopulmonary exercise testing (CPX) have been shown to provide prognostic information for all-cause hospitalization and mortality in HF population, (65-69) they have significant limitations both logistically and in their reproducibility.
(70) Of note, both of these tests can only be performed periodically, and are thereby reflective of the clinical status of the patient only at that particular point in time. More
recently, data derived from implantable devices have gained considerable attention as risk stratifying measures. (71-73) Most contemporary devices have the ability of measuring daily physical activity via sensors incorporated within the device. The activity information can thereby be acquired on a daily basis over prolonged periods of time. (74) Despite the ease of acquiring this information, there are limited data examining the relationship of device-based physical activity measures and clinical response to CRT.
1.9. Coronary sinus side branch stenting
Despite continuous technical developments in the last few years, implantation of a CRT system may be challenging. The success rate of coronary sinus (CS) lead positioning is 88-96% in previous clinical studies, (75-78) but even in the recently published MADIT CRT trial, 7.5 % of the CS lead implantations were unsuccessful. (79) During follow- up, 5-10 % of patients require re-operation because of CS lead dysfunction. (76, 77, 79-81)
Stent implantation, which anchors the CS electrode to the wall of the coronary sinus side branch, may increase the stability of the lead. A more stable CS lead position may increase implantation success rates and decrease the number of postoperative complications. The procedure was described in a previous single center observational study of our working group and in case reports. (82-85) In this study, long-term follow- up results of coronary sinus stenting are reported in a larger patient population.
2. The aims of our studies
We assessed the relationship between PR interval duration and outcomes in patients undergoing CRT.
We searched for novel predictors based on 12-lead ECG, registered before and after biventricular pacing. Our aim was to establish a simple score for early risk stratification and therapy optimization.
Based on vectorcardiographic analyses, we compared the different
depolarization and repolarization parameters to the established ECG predictor of QRS duration. We also investigated the potential predictive values of these repolarization parameters within different QRS morphologies, in terms of therapy response and long-term clinical outcome.
We examined the effect of pre- and postoperative hyponatremia on HF patients receiving CRT, and the influence of CRT on this electrolyte abnormality and consequently clinical outcomes.
We determined how hypothyroidism in patients with HF impacted response to CRT.
We investigated the prognostic value of device-measured physical activity data as compared to a one-time 6MWT in predicting clinical response to CRT.
We observed the effectiveness, safety and long-term outcome of stent implantation to anchor the lead to the wall of the CS side branch.
3. Methods
3.1. Study population of the therapy prediction projects
The questions regarding the prediction of therapy response and oucome were examined in the CRT patient register of the Massachusetts General Hospital (MGH). These patients who met established indications (New York Heart Association class III/IV symptoms, left ventricular ejection fraction <35% and QRS duration >120 ms) or had QRS<120ms with significant mechanical dyssynchrony), underwent CRT implantation, between 2004 and 2010. (86-88) The patient population consisted of 569 consecutive cases.
The right ventricular (RV) lead was implanted at the RV apex or septum, and the right atrial lead was placed at the right atrial appendage. LV leads were positioned in the most favorable available anatomic branch of the coronary sinus (CS) that resulted adequate lead stability with acceptable pacing parameters, without diaphragmatic stimulation, preferentially in a lateral or posterolateral vein branch of the coronary sinus.
The patients were prospectively followed according to a standardized protocol in a multidisciplinary clinic, including evaluation by electrophysiologists, heart failure specialists and echocardiography imaging specialists (4). Echocardiographic optimization was completed at 1-month follow-up. Atrio-ventricular delay was determined with monitoring the mitral inflow during gradual shortening of the delay, until maximal separation of A and E waves was obtained, without truncation of the A wave. For optimal VV delay, different RV and LV preexitation values were set, while the maximal velocity time integral was measured. Echo-optimization was uniformly performed after October 2005, and 380 of the total 491 patients in the study population underwent the echo-optimization process. The results in the remainder of the patients were similar to those of the entire population, and echo-optimization did not impact the results of the studies.
Clinical events including heart failure hospitalizations, heart transplantation, left ventricular assist devices (LVAD) and mortality were recorded and crosschecked with the social security death index. HF hospitalization was defined as necessity of inpatient admission due to acute cardiac decompensation, symptoms of shortness of breath, signs
of congestion on the chest radiograph, peripheral oedema, or relieve of shortness of breath after intravenous medical therapy. Transthoracic echocardiography was performed in a standardized manner. For assessment of left ventricular ejection fraction Simpson’s biplane method of disks was applied. CRT response was defined as at least 10% improvement of LVEF at the six-month follow-up, compared to baseline. Patients who received a heart transplant or an LVAD prior to the six-month follow-up were categorized as non-responders. The primary endpoint was a composite of all-cause death, heart transplantation, placement of left ventricular assist device (LVAD), and heart failure hospitalization. The project was approved by the Partners Institutional Review Board and Ethics Committee and was conducted in accordance with the Declaration of Helsinki.
3.2. Echocardiography
Transthoracic echocardiography was performed at baseline and at 6-months clinical follow-up. The images were taken by Philips iE33 (Eindhoven, The Netherlands), SONOS 5500/7500 (Andover, MA, USA) and General Electric Vivid 7 (GE, Milwaukee, WI) ultrasound machines. CRT response was defined as absolute increase in LVEF of ≥5% after 6-months of CRT, determined using the biplane method of discs (modified Simpson's method).
3.3. ECG registration
Before CRT implantation and during follow-up visits, supine 12-lead ECGs were recorded digitally by a MAC 5500 ECG Machine (GE Healthcare, Waukesha, WI, USA) at a paper speed of 25 mm/s and a frequency of 250 Hz. All ECGs were stored digitally as PDF files in the MUSE Cardiology Information system (GE Medical System).
3.4. Statistical analysis
The statistical analysis was performed using IBM SPSS statistics software version 21 (SPSS Inc, Chicago, Illinois). Continuous and discrete variables are presented as mean±standard deviation (SD) and counts (percentages), respectively. Normality was examined by Shapiro-Wilk test. Linear correlations were evaluated by Pearson's correlation or Kendall's tau coefficient when appropriate. Comparison between different
patient groups was performed using either one-way ANOVA (continuous variables) or the χ2 test (discrete variables), and Fisher’s exact test in the case of cell sizes of less than five. Follow-up paired comparisons were made using the Tukey test. The classification performance of electrical parameters in identifying CRT response was evaluated by odds ratios (OR) calculated using logistic regression models. The likelihood ratio test was used for comparison of the goodness-of-fit of hierarchical models.
The Kaplan-Meier estimator of survival function was used to evaluate the associations between variables and reaching the primary or secondary endpoints. The log-rank test was used to determine probability values. The predictive performance of electrical parameters in predicting CRT response was evaluated by the Cox proportional hazard regression analyses and tested using the Wald-test. The Cox regression models were fitted for covariates (p<0.10, if not signed differently), where a backward stepwise selection approach was used. A two-sided p-value <0.05 was considered statistically significant.
3.5. Project-specific methods 3.5.1. PR interval
Patients with atrial or ventricular pacing at baseline, atrial fibrillation at baseline, or missing ECG within one year prior to implantation were excluded from analysis.
All ECGs were performed within one year prior to implantation. ECGs recorded at the closest date to implantation date were preferred for use in the analysis. PR interval was defined as the interval from onset of the P-wave deflection to the junction with the QRS complex. The PR intervals were measured automatically by the ECG machine and subsequently verified manually. Based on the intrinsic PR interval measurements, patients were divided into two cohorts: <200 ms and ≥200 ms, in accordance with previous studies. (52)
3.5.1.1. Statistical analysis of the substudy
Clinically relevant baseline covariates were entered into the Cox proportional hazard model at a p value of less than 0.05, and remained in the model if the associated p value
was less than 0.05. Receiver operating curves analysis was performed using the Youden index to identify optimal cut-off value of PR interval measurement for predicting outcomes after the CRT implantation. Based on the results of the ROC analysis, the PR interval was dichotomized with a cutoff value of 200 ms.
3.5.2. ECG-based risk stratification score 3.5.2.1. ECG measurements
The measurements on the ECGs were made with CardioCaliper 3.3 (Iconico Inc., New York, NY, USA). CardioCaliper is publicly available and was used in combination with an on-screen digital view of a pdf file with the ECGs in normal size (100%) and with a time-resolution of 25mm/s. The program shows a caliper on top of the pdf ECG image, and allows a detailed and accurate on-screen assessment of elapsed time and voltage.
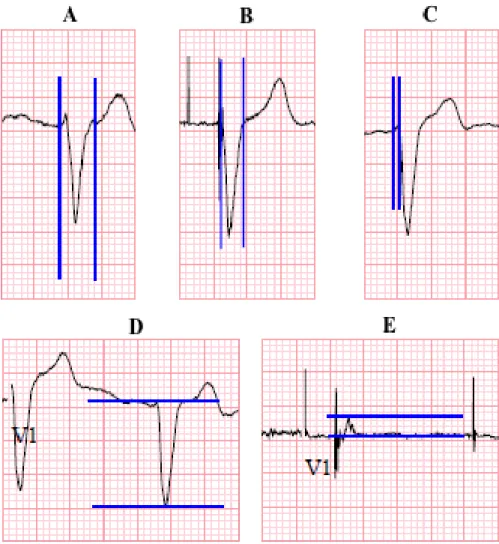
QRS duration was measured on native ECGs from the earliest deflection in any lead of the QRS to the last offset of the QRS wave in any lead (Figure 1A). On paced ECG the start point was uniformly the first ventricular pacing spike (Figure 1B). Among the different leads, the longest duration value was chosen. The summed QRS amplitude was determined in lead V1 by taking the voltage of the maximal R wave and the absolute value of the voltage of the Q or S wave from the baseline and summing them in unit of millivolt (Figure 1D and E). The intrinsicoid deflection (ID) onset was defined as the time from the earliest onset of the QRS morphology in leadV1 to the point where the maximum deflection toward baseline was registered, or immediately after the peak of the R wave, as previously described (Figure 1C) (89). QRS duration and ID onset were registered in milliseconds (msec). The 1-month ECGs obtained for this study were recorded before the optimization process. After the echo-based optimization, additional ECG was not obtained routinely. However, in order evaluate the stability over time of the measured parameters of the score, we also examined the ECGs recorded at the 6- month visits (i.e. after echo optimization at the previous visit). Those parameters showed very high correlations with the 1-month values and no significant changes were noted.
Figure 1. Measuring of the parameters of the score: (A) QRS duration before and (B) QRS duration after biventricular pacing, (C) time to ID in V1 lead, (D) Q+S amplitude before and (E) after CRT.
3.5.2.2. Construction of the score
The predetermined ECG score was based on the standard 12-lead ECG, and included three parameters:
One point was assigned for a reduction of QRS width of at least 20ms compared from baseline ECG to post-implant ECG.
One point was assigned for a reduction of at least 50% in the summed amplitude of R+S in lead V1 from baseline ECG to post-implant ECG.
One point was assigned if the ID point was identified within the first 40ms from QRS onset at the follow-up ECG in the V1 lead.
Thus the total score ranged from 0 to 3 points, and this number was used in the statistical analyses for prediction of clinical endpoints and reverse remodeling. The exact cut-off values were chosen in order to be clinically relevant and easy to appreciate on a standard ECG 25mm/s or 50mm/s printout, without sophisticated extra measuring equipment other than a standard ECG recording facility. Intra- and inter-observer variability for the ECG measurements were very high: The intra-observer correlation coefficient was 0.966 for QRS duration, 0.963 for time to intrinsicoid deflection in V1, and 0.995 for amplitude in V1 (all p<0.01). The corresponding inter-observer coefficients were 0.981, 0.980 and 0.955 respectively (all p<0.01).
3.5.3. Vectorcardiography (VCG) based T-wave area
Patients with a pre-implantation ECG available in digital archives, either in sinus rhythm or atrial fibrillation (AF), were enrolled in this retrospective analysis. ECGs with <3 normal beats (e.g. due to premature ventricular complexes), remarkable interfering noise, or ventricular pacing were excluded from the analysis.
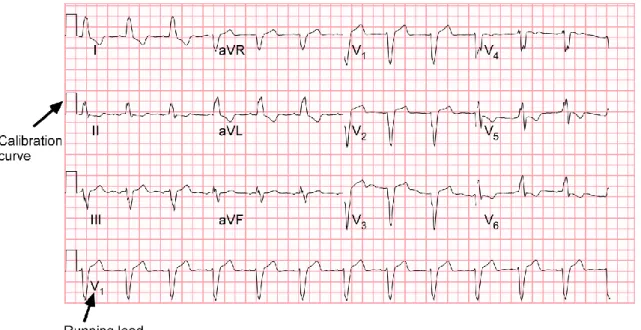
ECGs recorded up to one month before CRT implantation were included into the analysis. The vector graphics of these PDF files were obtained by converting the files to a .svg file using Inkscape version 2 (Boston, MA, USA). The calibration pulses, as indicated in Figure 2, were used to scale the signals to real time and amplitude.
Figure 2: Typical example of the lay-out of a measured 12-lead ECG, showing calibration pulses and lead V1 as running lead.
The digital ECG signals were semi-automatically analyzed using a custom-made computer program written in MATLAB R2010b (MathWorks, Natick, MA). After band-pass filtering between 0.5-40 Hz and baseline wander removal, the beginning and end of the QRS complex could be detected using the curve length transformation. (90) The beginning of the QRS complex corresponded to the last found minimum value and the end of the QRS complex was the first point with maximal cLT value. Additionally, the end of the T-wave was identified as the intersection between baseline and the tangent of the slope of the T-wave.
The QRS axis was calculated using lead I and II, where angles between -30º and -90º were defined as left axis deviation (LAD). Furthermore, patients were classified as LBBB or non-LBBB according to the MADIT-CRT criteria. (21)
3.5.3.1. VCG analysis
From the digital 12-lead ECG signals, a VCG was synthesized using the Kors method.
(91) The matrix proposed by Kors et al. (92), is based on a learning set from the Common Standards for Electrocardiography (CSE) multi-lead library and was generated by multiple linear regressions. The populations included both healthy subjects and patients. (91) The Kors method assumes all eight independent leads measured
simultaneously. However, in our case there were four groups of three leads (1: I, II, III;
2: aVR, aVL, aVF; 3: V1, V2, V3; 4: V4, V5, V6) and one running lead simultaneously measured, as shown in Figure 2. This running lead was needed to select the same beginning and end of an R-R interval in each lead. After selecting one beat for each lead, the VCG was synthesized.
For each patient, the QRS loop and T loop were identified using the same method as described for the ECG analysis. (90) The QRS duration and QT interval were defined as the time between the beginning of the QRS complex and the end of the QRS complex or the T wave, respectively. The QT interval was corrected for heart rate changes using Bazett's method (QTc interval). Subsequently, the maximum QRS- and T-vector were defined (maximal distance from the origin to a point on the loop), and its amplitude and location in space were calculated. The vector angles were expressed as azimuth and elevation. Azimuth is the angle in the transverse plane (0° left, +90° front, -90° back, 180° right). The elevation angle is the angle in the frontal plane defined from 0°
(downwards) to 180° (upwards). The angle between the maximal QRS- and T-vector was defined as the QRS/T angle.
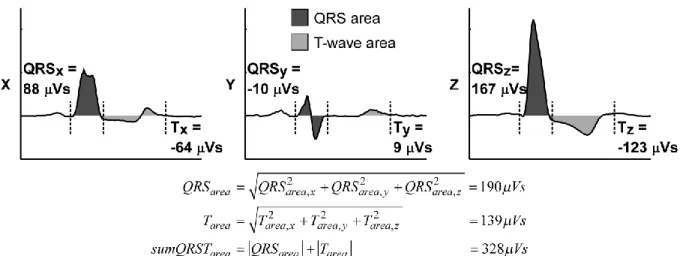
The VCG gave us the opportunity to also analyse the area of the loops. The QRS area is the 'three-dimensional' area between the curve and the baseline from QRS beginning to end in leads X, Y, and Z: 𝑄𝑅𝑆𝑎𝑟𝑒𝑎= √𝑄𝑅𝑆𝑎𝑟𝑒𝑎,𝑥2 + 𝑄𝑅𝑆𝑎𝑟𝑒𝑎,𝑦2 + 𝑄𝑅𝑆𝑎𝑟𝑒𝑎,𝑧2 . The T- wave area was calculated similarly, using the part from the end of the QRS complex to the end of the T wave. The sum QRST area was the sum of the absolute values of the QRS and T-wave area (Figure 3). The ratio between QRS and T-areas was defined as the QRS/T area ratio.
Figure 3. Calculation of the three dimensional QRS and T-wave area using the integral between the signal and the baseline from beginning to end of the QRS complex or from the end of the QRS complex to end of the T-wave, respectively. From the QRS and T- wave area, the sum QRST area was calculated.
3.5.4. T-wave area in prediction of outcome 3.5.4.1. Substudy population
In the present study patients with previous pacing (n=116), frequent premature ventricular contractions or unacceptable noise on the ECG (n=38), or missing baseline ECGs (n=80) were excluded, leading to a total of 335 patients included in the analysis.
This population is equal to the patient group described above, extended with 91 CRT patients whom did not have echocardiographic follow-up but did have long-term clinical follow-up.
3.5.4.2. Statistical analysis of the substudy
For descriptive purposes, analysis of subsets was performed in patients with a baseline T-wave area < and ≥ the median with use of the Breslow-Day test for heterogeneity testing.
3.5.5. Pre- and postoperative hyponatremia
Laboratory values for basic metabolic panel inclusive of serum sodium, potassium, chloride, blood urea nitrogen, creatinine, glucose and bicarbonate were collected at
baseline which was defined as 72 hours prior to device implantation. Sodium level was obtained at follow-up during their at 3-6 month visit. Hyponatremia was defined as sodium level <135 mEq/litre based on the previous description in the OPTIME-CHF trial. (55) Parameters with p<0.05 were selected for multivariate analysis.
3.5.6. Hypothyroidism
Hypothyroidism was defined by clinical history obtained by reviewing electronic medical record, treatment with thyroid hormone repletion and serum TSH around the time of device implantation. Reference range for TSH was 0.40-5.00 μU/mL. TSH level≥5.00 μU/mL was defined as uncontrolled hypothyroidism (if previously diagnosed); 6 patients had TSH level ≥5 and ≤10 μU/mL and were defined as having subclinical hypothyroidism and included in the hypothyroid group. There were 3 patients with hyperthyroidism which was too small a number for relevant analysis; 1 of these 3 patients was on amiodarone. TSH levels within 2 weeks of CRT device implantation were analyzed and were measured in outpatient settings. Other laboratory values of interest that were recorded included serum sodium and creatinine.
3.5.7. Device measured physical activity
This study evaluated 164 consecutive patients, whose detailed device diagnostic data were available. Data points of physical activity that were collected included 6-MWT and physical activity data from the devices.
The 6MWT was conducted according to a standardized manner. (93) The test was carried out in a straight, unimpeded 20 meter long hallway, where chairs were positioned at both ends providing patients a place for rest if needed. The subjects were instructed to walk as much as possible, but they were permitted to slow down or stop as necessary. They were encouraged in a standardized manner without influencing their walking speed. Before and immediately after the test, finger pulse oximetry (SpO2) was measured. If resting SpO2 was < 88% the patient was considered not eligible to begin the test.
Device-based physical activity data was obtained through device interrogations during follow-up visits. Diagnostic data from devices of two different companies (Medtronic &
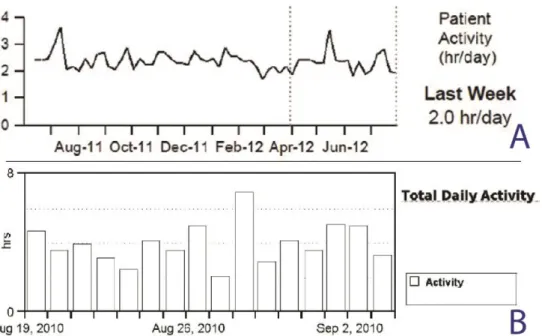
St. Jude Medical) were used for this analysis: 86 patients had Medtronic and 79 patients had St. Jude Medical device implanted. Implanted devices measure activity by an accelerometer, which consists of a piezoelectric crystal and a moving component that enables the sensing of the intensity and frequency of body motion, and then converts it into an electrical signal. The sensor thresholds of measurements and the processing algorithms are variable within the two companies. Importantly, device measures of physical activity were displayed differently between the device companies. Medtronic devices (Medtronic Inc, Minneapolis, MN) recorded the physical activity regardless of mode and rate response programming. The data were averaged for each seven-day period, and the average was plotted for the latest day of that period. The trend demonstrated a line connecting each weekly average value (Figure 4, panel A). The activity threshold was nominally set so that a continuous 60-70 step per minute walk was registered as active for that minute. Most activities of daily living (such as doing dishes, vacuuming, removing the garbage) were considered as "active". St. Jude Medical device (SJM, St Jude Medical Inc., Sylmar, CA) report displayed bar graphs that indicated the number of hours the patients are active each day (Figure 4, panel B).
Activity was defined as input to the sensor that exceeded the resting heart rate. That threshold rate was recorded in the first 48 hours after implant. Notably, there were no duration criteria for the activity level. Importantly, both of the manufacturers reported the daily activity in unit of hour/day.
Figure 4. Device manufacturers present the measurements of physical activity in variant visualization. Examples from CRT device printouts: Panel A = Medtronic; B = St. Jude Medical.
Echocardiographic response was defined as a >10 % improvement in LVEF, after CRT.
(94)
Since there are no defined categories for daily activity and 6MWT, patients were divided into tertiles based on the activity results and 6MWT distances. Cox proportional hazard models were adjusted for covariates significantly associated with 1 month daily activity tertiles (age, CABG, hypertension, ischaemic cardiomyopathy, diuretics) and traditional risk factors (gender, CAD, diabetes, usage of cardiovascular medications, baseline LVEF and creatinine level). During the multivariate modeling the significant univariates (for HF hospitalization end-point gender, CAD, usage of diuretics and digoxin, baseline creatinine; for composite endpoint gender, diuretics, creatinine) were included.
3.5.8. The study population of the coronary sinus side branch stenting study
Coronary sinus stenting has been performed since 2004 in Heart and Vascular Center, Semmelweis University, in selected patients after receiving informed consent. The consent form and the protocol were approved by the Hungarian Scientific and Research
Ethics Committee of the Medical Research Council. Data were collected in consecutive patients who underwent this procedure, between 2004 and 2010.
Table 2. Baseline Characteristics
Mean age 65.4
Male sex 236
Female 76
NYHA class at implantation:
II 12
III 247
IV 53
Left ventricular ejection fraction (%, median)
28 (23–34)
Medication (% of patients):
Aspirin 36
Clopidogrel or ticlopidine 24
Coumarin 48
Aspirin + coumarin 14
Clopidogrel+coumarin 7
Aspirin + clopidogrel 12
Spironolactone 54
Other diuretics 71
Beta-blocker 87
Angiotensin-converting enzyme inhibitors or angiotensin receptor blockers
84
CS side branch stenting was performed in 312 patients with wide QRS (>120 ms).
NYHA functional stage was mainly III-IV despite drug therapy, while 12 patients were in NYHA II stage at implantation, but their preceding clinical status made this treatment reasonable (Table 2). During this period 784 CRT systems were implanted in our institute, so stenting was applied in 39.7 % of CRT patients. Stent fixation of the CS lead was indicated in cases of postoperative dislocation (n=16). Stenting during the first
implantation (n=296) was applied when intraoperative macroscopic or microscopic dislocation occurred and there was no other suitable vein accessible or there was when phrenic nerve stimulation (PNS) was observed in a stable anatomical position in the distal part of the side-branch necessitating the lead to be fixed in a more proximal part of the target vein, where instability was present. (Figure 5A.)
A
B
Figure 5. A. Coronary venogram. Arrow 1: stable, distal wedge position, where PNS was observed. Arrow 2: proximal position with ideal pacing parameters. Intraoperative dislocation was experienced. B. Coronary stent implantation. S: inflation of the stent;
GW: guide wire of the stent; T: tip of the lead in the final position.
CS side branch stenting was executed according to the previously described manner (83): after cannulation of the CS ostium with Scout Pro 8F (Biotronik GmbH&Co, Berlin, Germany; inner diameter: 8F) or Attain LDS 6216A MB2 (Medtronic Inc., Minneapolis, MN, USA; inner diameter: 7F) CS sheaths, coronary sinus venography was performed using an occlusion balloon. Generally “over the wire” left ventricular unipolar passive fixation electrodes were applied: Attain OTW 4193-78 (Medtronic;
n=186), Corox OTW 75 UP/Steroid (Biotronik; n=118) and Quicksite 1056K-86 (St.
Jude, Sylmar, CA, USA; n=1). Seven patients received bipolar passive fixation leads (Corox OTW 75 BP/Steroid, Biotronik). After positioning of the lead, signal amplitude, pacing threshold and pacing impedance were measured. Phrenic nerve stimulation was investigated in all cases. Repositioning of the LV lead was performed if phrenic nerve stimulation was apparent during 10 V @ 0.5 ms pacing. In case the physician performing the implantation decided to use stent implantation, another guide wire was
also introduced into the target vein through the same CS sheath. On this second guide wire a short (mainly 8-15 mm) bare metal coronary stent was positioned into the CS side branch. The distance between the pacing tip (or ring) of the lead and the distal end of the stent was 5 to 35 mm. The diameter of the stents (2.25-4 mm, mainly 3 or 3.5 mm) was chosen according to the diameter of the target CS side branch which was measured on the CS venogram. The applied bare metal stents were as follows: Trimaxx (Abbott Vascular, Redwood City, CA, USA, n=142) Driver (Medtronic, n=57), MicroDriver (Medtronic, n=21), S670 (n=6, Medtronic) Lekton Motion (Biotronik, n=35), ProKinetic (Biotronik, n=29), Liberte (Boston Scientific, Maple Grove, MN, USA, n=19), Tsunami Gold (Terumo, Tokyo, Japan, n=3). After measuring the control pacing threshold and testing phrenic nerve stimulation, the stent was deployed with a pressure of 6 to 14 atmospheres (Figure 5 B). The duration of balloon inflation was 4-6 seconds.
A biventricular pacemaker was implanted in 207 patients, while a biventricular defibrillator was indicated in 105 cases. Decision made between CRT-P and CRT-D was the discretion of the operator, according to the guidelines. In patients with permanent atrial fibrillation (n=99) only right ventricular and CS leads were implanted.
Additional antiplatelet or anticoagulant therapy was not used after CS side branch stenting; only the previous anticoagulant and/or antiplatelet treatment was continued (Table2). Treatment was chosen according to current guidelines. The mean daily dosages were the following: aspirin: 100 mg, clopidogrel: 75 mg, ticlopidine 2x250 mg.
The INR target value was 2-3 for patients with anticoagulation.
Perioperative events were evaluated in all patients. After implantation, patients were seen in the office every six months. Median follow-up time was 28.4 (15-38, max. 70) months. 293 patients completed 6 months, 186 patients 1 year, 153 patients 2 years, 47 patients 3 years, and 13 patients 4 years follow-up. Left ventricular pacing threshold and pacing impedance values measured after the implantation were compared with the values recorded during 6, 24 and 36 months visits. If the patient felt phrenic nerve stimulation, PNS (phrenic nerve stimulation) threshold was also identified using different pulse width values. To minimize phrenic nerve stimulation, changing the pacing amplitude, pulse duration or pacing configuration was attempted. If these maneuvers failed to terminate the intolerable PNS, minimal invasive lead repositioning
was performed (95). A steerable ablation catheter (CelsiusTM , B curve, 36H-37R Biosense Webster, Diamond Bar, CA, USA) was introduced into the right atrium via the right femoral vein. The ablation catheter was looped around the atrial part of the CS lead and was retracted together with the CS electrode.
If stented CS leads were extracted for any reason, macroscopic analysis was fulfilled in all cases looking for injuries on the insulation. When it was possible, microscopic measurements were also executed.
3.5.8.1. Statistical analysis of the coronary sinus side branch stenting study
Statistical analysis was prepared with Prism for Windows 5.00 (GraphPad Software, San Diego, CA, www.graphpad.com). As all of the variables had non-Gaussian distributions, we used nonparametric tests throughout the analysis. We used the Wilcoxon signed rank test for comparisons between two repeated measures. All statistical analyses were two-tailed and p<0.05 was considered significant. Values presented in the text are medians (interquartile ranges), unless otherwise stated.
4. Results 4.1. PR interval
4.1.1. Baseline characteristics
From the total patient population, eighty patients were excluded because of missing ECG within one year prior to implantation, 116 patients who had ventricular pacing at baseline and 90 patients with chronic atrial fibrillation preoperatively. 283 patients were included in the final analysis.
Receiver operating curves analysis was performed to assess the best cut-off value for PR interval. A baseline PR interval value of 209 ms for prediction primary endpoint was identified by receiver operating characteristic curve analysis (area under the curve 0.581). PR interval 209 ms showed 42.1% sensitivity, 72.2% specificity and a positive predictive value of 42.1% for a negative outcome. The cutoff value was then rounded to 200 ms in order to make it clinically applicable and relevant, and the patients were divided into two groups based on normal (<200 ms) or prolonged (≥200 ms) PR interval.
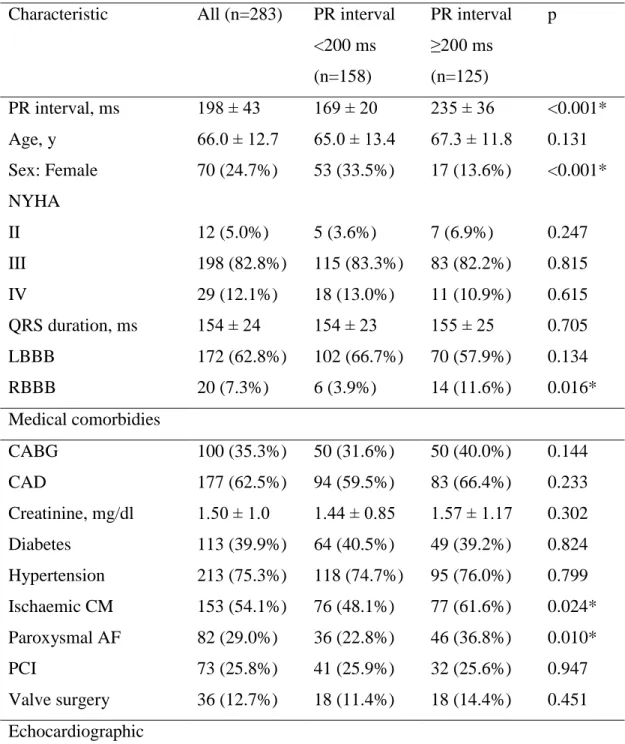
Baseline characteristics of all patients are presented in Table 3, divided into two groups based on the PR-interval. 158 patients (55.8%) had a PR interval <200 ms and 125 patients (44.2%) had a PR interval ≥200 ms. Mean PR interval in whole study cohort was 198±43 ms (169±20 vs 235±36 ms in the respective groups, p<0.001). Patients in the normal PR interval group were less likely to have ischaemic cardiomyopathy (48.1% vs. 61.6%, p=0.024), paroxysmal AF (22.8% vs. 36.8%, p=0.010), right bundle- branch block (3.9% vs. 11.6%, p=0.016) and to be male (66.5%% vs. 86.4%, p<0.001) compared with prolonged PR interval group. Notably, there was no difference in mean QRS duration (154±23 ms vs. 155±25 ms, p=0.705), but there was a trend for more patients with left bundle branch block (LBBB) ECG morphology (66.7% vs. 57.9%, p=0.134). Patients with normal PR interval were more likely to experience an improvement in symptoms (improvement of ≥1 NYHA class) at the 6-month follow-up visit, compared to patients with PR interval ≥200 ms (104 [70.2%] vs. 86 [51.2%], respectively, p=0.007).
Table 3. Baseline characteristics of the entire population categorized by the PR interval Characteristic All (n=283) PR interval
<200 ms (n=158)
PR interval
≥200 ms (n=125)
p
PR interval, ms 198 ± 43 169 ± 20 235 ± 36 <0.001*
Age, y 66.0 ± 12.7 65.0 ± 13.4 67.3 ± 11.8 0.131
Sex: Female 70 (24.7%) 53 (33.5%) 17 (13.6%) <0.001*
NYHA
II 12 (5.0%) 5 (3.6%) 7 (6.9%) 0.247
III 198 (82.8%) 115 (83.3%) 83 (82.2%) 0.815
IV 29 (12.1%) 18 (13.0%) 11 (10.9%) 0.615
QRS duration, ms 154 ± 24 154 ± 23 155 ± 25 0.705
LBBB 172 (62.8%) 102 (66.7%) 70 (57.9%) 0.134
RBBB 20 (7.3%) 6 (3.9%) 14 (11.6%) 0.016*
Medical comorbidies
CABG 100 (35.3%) 50 (31.6%) 50 (40.0%) 0.144
CAD 177 (62.5%) 94 (59.5%) 83 (66.4%) 0.233
Creatinine, mg/dl 1.50 ± 1.0 1.44 ± 0.85 1.57 ± 1.17 0.302
Diabetes 113 (39.9%) 64 (40.5%) 49 (39.2%) 0.824
Hypertension 213 (75.3%) 118 (74.7%) 95 (76.0%) 0.799 Ischaemic CM 153 (54.1%) 76 (48.1%) 77 (61.6%) 0.024*
Paroxysmal AF 82 (29.0%) 36 (22.8%) 46 (36.8%) 0.010*
PCI 73 (25.8%) 41 (25.9%) 32 (25.6%) 0.947
Valve surgery 36 (12.7%) 18 (11.4%) 18 (14.4%) 0.451 Echocardiographic
characteristics
LVEF, % 24 ± 7 24 ± 7 23 ± 8 0.487
LVIDd, mm 63 ± 9 62 ± 9 63 ± 9 0.380
LVIDs, mm 55 ± 10 55 ± 10 55 ± 10 0.526
Medications
ACEi 180 (63.6%) 111 (70.3%) 69 (55.2%) 0.009*
ARB 55 (19.4%) 30 (19.0%) 25 (20.0%) 0.831
Aldosterone antagonist 102 (36.0%) 53 (33.5%) 49 (39.2%) 0.325 Beta-blocker 250 (88.3%) 144 (91.1%) 106 (84.8%) 0.099
Digoxin 86 (30.4%) 45 (28.5%) 41 (32.8%) 0.433
Diuretics 230 (81.3%) 125 (79.1%) 105 (84.0%) 0.295 ACE – angiotensin-converting enzyme; ARB – angiotensin receptor blocker; CABG – coronary artery bypass grafting; CAD – coronary artery disease; CM – cardiomyopathy;
LBBB – left bundle branch block; LVIDd – left ventricular internal dimension diastole;
LVIDs – left ventricular internal dimension systole; LVEF – left ventricular ejection fraction; NYHA – New York Heart Association; PCI – percutaneous coronary intervention; VF – ventricular fibrillation; VT – ventricular tachycardia
4.1.2. Cardiac dimensions and reverse remodeling
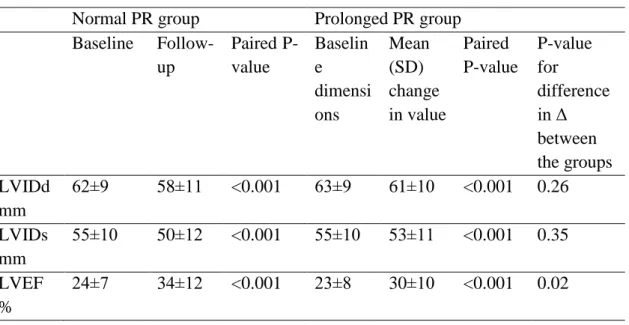
There were no significant differences in cardiac dimensions and LVEF between the groups prior to CRT implant (Table 4). However, patients with prolonged PR interval had a smaller average improvement in LVEF, and were less likely to be echo- responders of LVEF (64% vs. 77%, OR 0.6 CI 0.3-1.0, p=0.06). When stratified for the presence of LBBB, it was evident that this difference was primarily driven by the results for the patients with non-LBBB, where a prolonged PR interval was strongly associated with lower odds ratio for echo-response (OR 0.3 CI 0.1-0.8, p=0.02, whereas for the group with LBBB there was no significant difference (OR 0.8 CI 0.3-1.9, p=0.61).
Table 4. Cardiac dimensions and ejection fraction before and after CRT treatment Normal PR group Prolonged PR group
Baseline Follow- up
Paired P- value
Baselin e dimensi ons
Mean (SD) change in value
Paired P-value
P-value for
difference in Δ between the groups LVIDd
mm
62±9 58±11 <0.001 63±9 61±10 <0.001 0.26 LVIDs
mm
55±10 50±12 <0.001 55±10 53±11 <0.001 0.35 LVEF
%
24±7 34±12 <0.001 23±8 30±10 <0.001 0.02
4.1.3. Clinical outcomes and survival
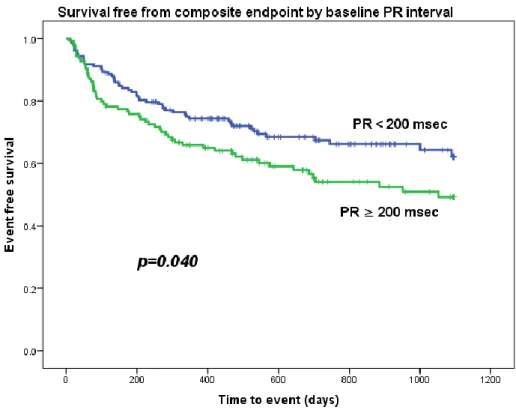
Patients were followed for 30.1±22.0 months after CRT implantation. In the study period, 10 patients underwent heart transplantation, 4 had LVAD implantation, 98 were hospitalized because of HF and 76 died. The primary endpoint of death from any cause, HF hospitalization, implantation of left ventricular assist device or heart transplantation was observed in 51 patients from the normal PR interval group (32.3%) and 56 patients from the prolonged PR interval group (44.8%). Kaplan-Meier analysis showed worse clinical outcomes in the group with prolonged PR interval (Figure 6 and 7, log rank test p=0.040).
Figure 6. Survival free from composite endpoint by baseline PR interval
Figure 7. Survival free from HF hospitalization by baseline PR interval
When stratifying for presence of LBBB, it was again evident that the difference between the groups was primarily in the patients with non-LBBB, whereas in patients with LBBB a prolonged PR interval did not have a significant impact on prognosis (Figure 8A and 8B).
A
B
Figure 8A and 8B. Survival free from composite endpoint by baseline PR interval, for patients with LBBB (A) and non-LBBB (B).
Table 5. presents the results of uni- and multivariate Cox regression analysis of the primary endpoint. In univariate analysis, baseline PR interval, prolonged PR interval (dichotomized) (hazard ratio, HR 1.49; 95% confidence interval, CI 1.02-2.17;
p=0.041), female gender (HR 0.69; 95% CI 0.49-0.96; p=0.041), ischaemic cardiomyopathy, and RBBB on ECG were associated with the primary endpoint.
However, in multivariate analysis only ischaemic cardiomyopathy remained as a statistically significant predictor of poor prognosis (HR 1.64; 95% CI 1,07-2,53;
p=0.024).
We further assessed the relationship between PR interval and hospitalization for heart failure (Table 5). This occurred in 44 patients from the group with normal PR interval (27.8%) and 54 patients from the group with PR interval (43.2%; p=0.015; Figure 7), and PR interval was the only independent predictor of HF hospitalization (HR 1.56;
95% CI 1.04-2.34; p=0.033).
4.2. ECG-based risk stratification score 4.2.1. Baseline characteristics
Out of the total of 569 consecutive patients that received CRT within the study period, 78 patients were excluded because of missing ECG either prior to or after implantation, or ventricular pacing at the baseline ECG.The final study population of 491 patients consisted of 101 women and 390 men with a median age of 71 (IQR 16) years.The full baseline characteristics are presented in Table 6. During the follow-up period 180 patients reached the heart failure hospitalization endpoint, 14 patients underwent cardiac transplantation, 5 patients had an LVAD implanted and 148 patients died.
Table 6. Baseline characteristics.
AF – atrial fibrillation, NYHA – New York Heart Association, CABG – coronary artery bypass grafting, PCI – percutaneous coronary intervention, LBBB – left bundle branch
block, ACEi – angiotensin-converting-enzyme inhibitor, ARB – angiotensin receptor blocker, LVEF – left ventricular ejection fraction
Several of the well-known baseline clinical parameters were correlated to an increased risk for the primary composite endpoint; male gender, diabetes, ischaemic cardiomyopathy, chronic atrial fibrillation, previous CABG, non-LBBB on ECG, higher serum creatinine, loop diuretic therapy and digoxin therapy. Table 7 shows individual hazard ratios and the final multivariate model including correlations for the proposed ECG score.
Table 7. Univariate and multivariate Cox regression analysis for predictors of the combined primary endpoint death, left ventricular assist device, heart transplantation or hospitalization for heart failure.
Univariate analysis Multivariate analysis
Variable HR 95% CI p
Age (years) 1.008 .997-1.019 .143
Female .696 .490-.989 .043 0.9 0.6-1.4 0.66
Hypertension 1.207 .893-1.633 .222
Diabetes 1.390 1.077-1.796 .011 1.5 1.1-2.0 0.02 Ischemic
cardiomyopathy
1.368 1.045-1.790 .023 1.2 0.8-1.7
Chronic AF 1.309 1.001-1.712 .049 0.95 0.7-1.3 0.76 Paroxysmal AF 1.131 .857-1.494 .384
CABG 1.368 1.059-1.766 .016 1.01 0.7-1.4 0.97
Valve surgery .934 .655-1.333 .708
PCI 1.139 .860-1.507 .364
LBBB .675 .517-.811 .004
Baseline creatinine 1.30 1.198-1.422 <0.001 1.3 1.2-1.4 <0.00 1 Diuretics 2.47 1.486-4.101 <0.001 2.7 1.4-5.3 0.002
Aldosterone antagonist .945 .726-1.252 .733
Digoxin 1.409 1.091-1.820 .009 1.3 0.95-1.7 0.11 Beta-blocker .715 .503-1.016 .061
ACEi .796 .615-1.029 .082
ARB .823 .594-1.165 .283
LVEF .989 .970-1.007 .235
Baseline QRS (msec) 1.000 .995—1.005 .989 Lateral lead position .723 .513-1.019 .064 QRS narrowing .655 .477-.900 .009 V1 amplitude decrease .668 .494-.904 .009 ID V1 <40 ms .625 .455-.858 .004
ECG score .645 .536-.777 <0.001 0.7 0.5-0.8 <0.00 1 AF – atrial fibrillation, NYHA – New York Heart Association, CABG – coronary artery bypass grafting, PCI – percutaneous coronary intervention, LBBB – left bundle branch block, ACEi – angiotensin-converting-enzyme inhibitor, ARB – angiotensin receptor blocker, LVEF – left ventricular ejection fraction
4.2.2. QRS duration
The median QRS duration was 166 msec (range 102-273, IQR 45) before CRT and median 155 msec (range 93-279, IQR 29) at the one-month follow-up. At least 20 msec narrowing was observed in 163 (37%) cases. Those patients were more likely to be women (28 vs. 17%, p=0.010), had broader baseline QRS (median 186 vs. 151 msec, p<0.001), less dilated left ventricle (end-systolic left ventricular internal diameter median 50 vs. 55 mm, p<0.001), less frequently a history of CABG (30% vs. 28%, p=0.004) and valve surgery (12 vs. 19%, p=0.044). The patients with at least 20msec reduction in QRS amplitude had a lower risk of experiencing the composite endpoint;
HR 0.66 ([0.48-0.90] p=0.009), and they were more likely to have significant reverse remodeling on echo; OR 2.90 [1.8-4.7], p<0.001).
4.2.3. Summed V1 amplitude
The median summed QRS amplitude in V1 lead was 1.05 mV (range 0.12-4.07, IQR 0.89) at baseline and 0.74 mV (range 0.12-3.43, IQR 0.57) at the one-month follow-up ECG. The summed amplitude in V1 lead decreased in 309 cases (71%) and the magnitude was less than 50% of the baseline value in 194 cases (45%). The patients in this group were more likely to have LBBB morphology (56% vs. 43%, p=0.007), but no other significant differences were noted between the two groups. Decrease in summed amplitude in V1 was associated with a HR of 0.67 ([0.49-0.90], p=0.09) for reaching the primary endpoint, and an OR of 1.3 ([0.85-2.1], p=0.21) for LV remodeling on echocardiography.
4.2.4. Intrinsicoid deflection onset duration
At follow-up, the median time from QRS start to the ID onset was 66 msec (range 0- 233, IQR 75). In 167 (34%) patients the time to onset was ≤40 msec, and this was associated with a HR of 0.62 ([0.46-0.86] p=0.004) for reaching the primary endpoint.
The corresponding odds ratio for significant LV remodeling was 1.6 ([1.03-2.5]
p=0.04). The patients with time to ID onset >40ms were slightly older, more men, were more likely to have ischaemic cardiomyopathy, previous CABG and have chronic atrial fibrillation. They were less likely to have LBBB morphology on ECG prior to implant, and less likely to be on beta-blocker-medication.
4.2.5. ECG score
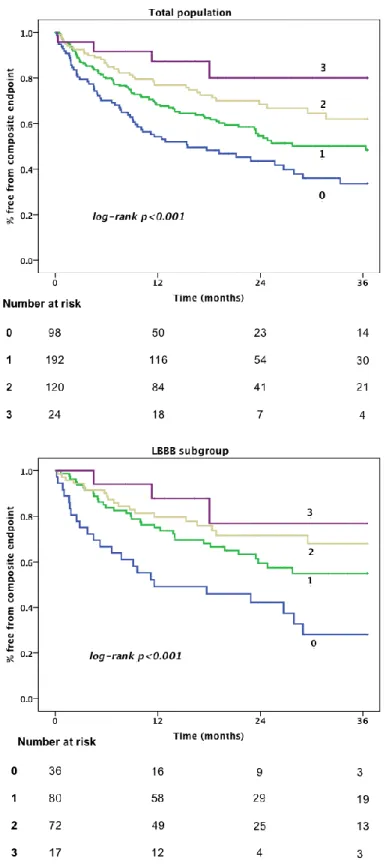
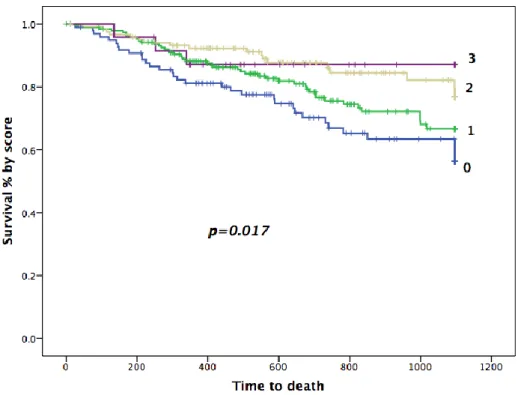
We assigned one point for each predictor investigated above, as the HR and Wald values for the independent predictors were comparable. Overall median score was 1 (IQR 1). In survival analysis increasing total score was associated with a reduced risk for the combined primary endpoint, as well as a reduced risk for heart failure hospitalization (Figure 9). The trends seen in Figure 9 were the same for prediction of all-cause mortality (Figure 10), although numbers of events in this category were more limited (overall 99 events, 33, 45, 18, 3 by the score (0-3), respectively) and the curves less separated.In regression analysis each additional point in the risk score translated to a 42% risk-reduction for reaching the composite endpoint (HR 0.58 [0.44-0.77]
p<0.001). When correcting for other significant predictors in the multivariate model, the independent HR was 0.68 [0.55-0.83] p<0.001). The unadjusted hazard ratio for the score in predicting echo-response (≥10% improvement in LVEF) was 1.8 ([1.4-2.4]
p<0.001) for each increasing point, and the corresponding adjusted HR was 1.7 ([1.3- 2.3] p<0.001).
Figure 9. Kaplan-Meier curves of survival free of composite endpoint according to ECG score, for all patients (above) and for patients with LBBB (below).