Glucose levels show independent and dose-dependent association with worsening acute pancreatitis outcomes: Post-hoc analysis of a prospective, international cohort of 2250 acute pancreatitis cases
Anik o Nagy
a,b,c, M ark F elix Juh asz
b, Anik o G€ orbe
b, Alex V aradi
b, Ferenc Izb eki
d, Aron Vincze
e, Patrícia Sarl os
e, J ozsef Czimmer
e, Zolt an Szepes
f, Tam as Tak acs
f, M aria Papp
g, Eszter Feh er
g, J ozsef Hamvas
h, Klaudia K ar asz
i, Imola T€ or€ ok
j, Davor Stimac
k, Goran Poropat
k, Ali Tüzün Ince
l, B alint Er} oss
b, Katalin M arta
b, D aniel P ecsi
b, D ora Ill es
f, Szil ard V ancsa
b, M aria F€ oldi
b,c,q, N andor Faluhelyi
m, Orsolya Farkas
m, Tam as Nagy
n, P eter Kanizsai
o, Zsolt M arton
p, Andrea Szentesi
b,c,q, P eter Hegyi
b,c,r,s,1, Andrea P arniczky
a,b,c,1,*aHeim Pal National Pediatric Institute, Budapest, Hungary
bInstitute for Translational Medicine, Szentagothai Research Centre, Medical School, University of Pecs, Pecs, Hungary
cDoctoral School of Clinical Medicine, University of Szeged, Szeged, Hungary
dSzent Gy€orgy University Teaching Hospital of Fejer County, Szekesfehervar, Hungary
eDivision of Gastroenterology, First Department of Medicine, Medical School, University of Pecs, Pecs, Hungary
fDepartment of Medicine, University of Szeged, Szeged, Hungary
gDepartment of Internal Medicine, Division of Gastroenterology, University of Debrecen, Debrecen, Hungary
hPeterfy Hospital, Budapest, Hungary
iKanizsai Dorottya Hospital, Nagykanizsa, Hungary
jCounty Emergency Clinical Hospital - Gastroenterology and University of Medicine, Pharmacy, Sciences and Technology, Targu Mures, Romania
kClinical Hospital Center Rijeka, Rijeka, Croatia
lHospital of Bezmialem Vakif University, School of Medicine, Istanbul, Turkey
mDepartment of Medical Imaging, Clinical Centre, Medical School, University of Pecs, Pecs, Hungary
nDepartment of Laboratory Medicine, Medical School, University of Pecs, Pecs, Hungary
oDepartment of Emergency Medicine, Clinical Centre, Medical School, University of Pecs, Pecs, Hungary
pFirst Department of Medicine, Medical School, University of Pecs, Pecs, Hungary
qCentre for Translational Medicine, Department of Medicine, University of Szeged, Szeged, Hungary
rCentre for Translational Medicine, Semmelweis University, Budapest, Hungary
sDivision of Pancreatic Diseases, Heart and Vascular Center, Semmelweis University, Budapest, Hungary
a r t i c l e i n f o
Article history:
Received 20 March 2021 Received in revised form 31 May 2021
Accepted 17 June 2021 Available online xxx
Keywords:
Glucose Hemoglobin A1c Dose-dependency Pancreatotoxicity Acute pancreatitis
a b s t r a c t
Background:Metabolic risk factors, such as obesity, hypertension, and hyperlipidemia are independent risk factors for the development of various complications in acute pancreatitis (AP). Hypertriglyceridemia dose-dependently elicits pancreatotoxicity and worsens the outcomes of AP. The role of hyperglycemia, as a toxic metabolic factor in the clinical course of AP, has not been examined yet.
Methods:We analyzed a prospective, international cohort of 2250 AP patients, examining associations between (1) glycosylated hemoglobin (HbA1c), (2) on-admission glucose, (3) peak in-hospital glucose and clinically important outcomes (mortality, severity, complications, length of hospitalization (LOH), maximal C-reactive protein (CRP)). We conducted a binary logistic regression accounting for age, gender, etiology, diabetes, and our examined variables. Receiver Operating Characteristic Curve (ROC) was applied to detect the diagnostic accuracy of the three variables.
Results:Both on-admission and peak serum glucose are independently associated with AP severity and mortality, accounting for age, gender, known diabetes and AP etiology. They show a dose-dependent
*Corresponding author. Institute for Translational Medicine, Medical School, University of Pecs, Szigeti Street 12., Pecs, H-7624, Hungary.
E-mail addresses: andrea.parniczky@gmail.com, andrea.parniczky@aok.pte.hu (A. Parniczky).
1PH and AP contributed equally.
Contents lists available atScienceDirect
Pancreatology
j o u r n a l h o m e p a g e :w w w .e l se v i e r. co m/ lo ca t e / p a n
https://doi.org/10.1016/j.pan.2021.06.003
1424-3903/©2021 Published by Elsevier B.V. on behalf of IAP and EPC.
Please cite this article as: A. Nagy, M.F. Juhasz, A. G€orbeet al., Glucose levels show independent and dose-dependent association with worsening acute pancreatitis outcomes: Post-hoc analysis of a prospective, international cohort of 2250 acute pancreatitis cases, Pancreatology, https://
doi.org/10.1016/j.pan.2021.06.003
association with severity (p<0.001 in both), mortality (p<0.001), LOH (p<0.001), maximal CRP (p< 0.001), systemic (p <0.001) and local complications (p< 0.001). Patients with peak glucose
>7 mmol/l had a 15 times higher odds for severe AP and afive times higher odds for mortality. We found
a trend of increasing HbA1c with increasing LOH (p<0.001), severity and local complications.
Conclusions: On-admission and peak in-hospital glucose are independently and dose-dependently associated with increasing AP severity and mortality. In-hospital laboratory control of glucose and adequate treatment of hyperglycemia are crucial in the management of AP.
©2021 Published by Elsevier B.V. on behalf of IAP and EPC.
Introduction
Acute pancreatitis (AP) is the inflammation of the pancreas, most often caused by alcohol consumption and biliary obstruction [1]. The incidence of AP is gradually increasing worldwide, now reported to be 4.6e100/100,000 in the general population [2,3]. The severity of the condition varies, with most cases being classified as mild, but in 15e30% and 10e20% of the cases, moderate and severe disease course will occur, resulting in longer hospitalization, organ failure (OF) and higher mortality (up to 40% in severe cases) [4e6].
Szentesi et al. demonstrated that obesity, hypertension and hyperlipidemia are independent risk factors for several complica- tions in AP. Furthermore, the more components of metabolic syn- drome are present, the higher the risk for more severe disease outcomes [7]. A prospective cohort study found that hyper- triglyceridemia dose-dependently increases the severity and rate of AP complications [8]. As a next step infilling the gaps of knowledge regarding the role of toxic metabolic factors in the clinical course, we set out to examine the outcome parameters of AP in the context of serum glucose concentration.
Hyperglycemia is an established independent risk factor in numerous diseases. It independently predicts long-term mortality and is associated with a worse prognosis in acute myocardial infarction, irrespective of the presence of diabetes mellitus (DM) [9,10]. It is also associated with a higher rate of poor functional outcomes and less successful revascularization after acute ischemic stroke [11,12]. Furthermore, not only the acute elevations in serum glucose are of interestestudies describe chronic glucose dysre- gulation to be prognostic for mortality after acute myocardial infarction, both in diabetic and non-diabetic patients [13e15]. In AP, the exact role of glucose dysregulation and its laboratory indicators is yet to be described. However, of the most widely used AP prog- nostic scoring systems, two (the Ranson and the Glasgow-Imrie) include a serum glucose concentration above 10 mmol/L, high- lighting its potential role and association with severity [16].
Our goal was to examine the presence of dose-dependency between glucose dysregulation and clinically important outcomes of AP in a large, multicenter, prospective cohort. In our current cohort analysis (1) previous glucose homeostasis, as assessed by glycosylated hemoglobin (HbA1c) levels; and especially (2) serum glucose levels on admission; and (3) the highest glucose levels during hospitalization have shown dose-dependent associations with key clinically important outcomes of AP. We also established hyperglycemia as an independent and dose-dependent risk factor for mortality.
Methods
Study design, data source
This study presents a post-hoc analysis of a prospective, international, multi- center registryof AP patients, maintained by the Hungarian Pancreatic Study Group (HPSG). Participants were enrolled in the AP registry if they fulfilled the diagnostic
criteria for AP as per the International Association of Pancreatology/American PancreaticAssociation(IAP/APA)andHPSGguidelines[17,18].Theywerefollowedup until the end of their AP associated hospital stay (until oral feeding was reinstated without symptoms and with the normalization of laboratory parameters). A list of study sites can be found in the supplementary material (Supplementary Fig. 1, Supplementary Table 1). Between 2012 and 2019, 2461 adult (18 years old) AP patients'datawerecollected.Toensuredataquality,afour-tierqualitycontrolsystem was applied, described in detail in a previous publication from the registry [19]. Our studyhasapartlyoverlappingpopulationwithpreviouspublicationsfromtheHPSG AP registry.
Participants
In the present analysis, we included 2250 patients from the total of 2461 participants in the AP registry with available data on (1) HbA1c any time during the hospitalization with AP and/or (2) on- admission serum glucose measurement and/or (3) at least two serum glucose measurements during hospitalization.
Three variables were taken into account in dividing our exam- ined cohort into subgroups. To observe the role of the glucose ho- meostasis preceding the admission with APe‘before AP’(BAP)e participants were divided intofive groups based on their HbA1c:
6.50; 6.51e7.00; 7.01e8.00; 8.01e9.00;9.01%. To reflect the on- admission statee‘on-admission AP’(OAP)eseven groups were formed based on on-admission serum glucose levels: 3.99, 4.00e5.99, 6.00e7.79, 7.80e11.09, 11.10e14.99, 15.00e19.99, 20.00 mmol/L. Seven groups were formed based on peak serum glucose during the hospital staye‘during AP’(DAP)eamong those patients who had at least two glucose measurements: 3.99, 4.00e5.99, 6.00e7.79, 7.80e11.09, 11.10e14.99, 15.00e19.99, 20.00 mmol/L. These boundaries were chosen to reflect already established cut-offs (6.5% and 7% for HbA1c, 4.0 mmol/L, 7.8 mmol/
L and 11.1 mmol/L for glucose, as recommended by the World Health Organization, as well as American and European DM asso- ciations/societies [20]), participant and event numbers to maintain statistical power and equal increments to avoid the possibility of arbitrary cut-off selection.
Representativeness
The distribution of epidemiological data and main outcome variables (such as severity and mortality) were compared between the total registry population and our investigated cohort. There were no significant differences between the total population and the OAP subcohort, indicating that this population's characteristics are representative of the general AP population. We found signifi- cant differences from the total cohort: in the length of hospitali- zation (LOH) in the BAP subcohort, and in age, LOH, and severity in the DAP subcohort (glucose values were probably monitored more closely in more severe cases, and thus often older patients) (Supplementary Fig. 2,Supplementary Table 2).
orbe et al. Pancreatology xxx (xxxx) xxx
Variables
A complete list of collected variableseincluding data on labo- ratory parameters, complications, severity and mortalityeis pro- vided in our data quality table in the supplementary material (Supplementary Table 3). Local complications, systemic complica- tions and severity were defined according to the revised Atlanta classification [21].
Glucose measured only within thefirst 24 hours was accepted as on-admission glucose level. Venous measurements were preferred and accounted for most of the on-admission values, but results from capillary samples were also accepted. HbA1c measured any time during the hospitalization was accepted for this analysis. 95%
of measurements occurred within 48 hours of hospitalization. On- admission values were determined from randomly taken samples, as they usually are, that would mean that they are not fasting samplesehowever, most AP patients present after hours-days of abdominal pain, nausea and lack of appetite. On the other hand, while most subsequent in-hospital samples are collected early in the morning, a significant proportion of these patients receives enteral feeding. To conclude, not being able to reliably distinguish fasting and non-fasting samples is an inherent limitation of observational trials of AP.
Statistical analysis
For the descriptive analysis of categorical variables, case number and percentage were computed, while in the case of continuous variables, patient number, mean, standard deviation (SD), median, 25% and 75% quartiles (IQR) were calculated. To identify the three subcohorts' representativeness, we used the Chi-squared test in case of categorical data, the Student's t-test for normally distributed variables, and the Mann-WhitneyUtest for non-normally distrib- uted variables. In‘Table 1’, groups with outlying age (Kruskal-Wallis test) and gender distribution (Fisher exact or Chi-squared test) were sought as well as trends in AP recurrence (RAP), chronic pancreatitis (CP), hyperlipidemia, DM in the medical history (Cochran-Armitage test for trend) and AP episode number among RAP cases (Jonckheere-Terpstra trend test). The dose-dependent effects of HbA1c, on-admission and maximum glucose levels on the investigated outcomes, were tested using the Cochran- Armitage test for trend (in case of categorical variables) and the Jonckheere-Terpstra trend test (in case of continuous variables).
Where an overall significant effect was found, a pairwise test of independence (for nominal variables) or a step-down trend test (for continuous variables) with Benjamini-Hochberg p-value correc- tions was performed as a post-hoc test [22]. Since the overall p- value was significant in case of age in the OAP subcohort, we per- formed the Dunn posthoc test to identify the outlying group, applying the above mentioned correction method (Supplementary Table 5).
To detect the predictive accuracy of HbA1c, on-admission glucose level and maximum glucose level on the mortality and severity, the Receiver Operating Characteristic Curve (ROC) was applied. To check the performance of the classification, we used Area Under the Curve (AUC) with 95% confidence intervals (CI) (depending on the AUC value, the accuracy of the test can be categorized as followed: 0.5e0.6 fail, 0.6e0.7 poor, 0.7e0.8 fair, 0.8e0.9 good and above 0.9 excellent). We calculated the potential best cut-off value as well. Odds ratios (OR) with 95% CI were calculated for severe AP cases and mortality. Binary logistic regression was used to test the independent prognostic role of the three investigated variables. The model contains the following parameters in all cases: age, gender, DM, AP etiology and HbA1c, on-admission glucose level or maximum glucose level. We also
created univariate models for severity and mortality with the same parameters, this can be found in our supplementary material (Supplementary Tables 10 and 11). All calculations were performed with the statistical software R, version 4.0.2 (R Core Team, 2020, Vienna, Austria) using the coin (v1.3-4; Hothorn et al., 2008), rcompanion (v2.3.27; Mangiafico, 2021), DescTools (v0.99.39;
Signorell et al., 2020), PMCMRplus (v1.9.0; Pohlert, 2021) and pROC (v1.17.0.1; Robin et al., 2011), dunn.test (v1.3.5; Dinno, 2017) packages.
Box plots of LOH and CRP included in the main body of the article do not visualize outliers above a certain value to allow for a better interpretation of the figure. The original figures with all outliers can be found in the supplementary material (Supplementary Fig. 3).
Ethical approval
Ethical approval for the registry was granted in 2012 by the Scientific and Research Ethics Committee of the Medical Research Council (22,254e1/2012/EKU). The registry protocol was approved by the institution's human research committee preceding the study initiation. It complies with the ethical guidelines of the Declaration of Helsinki, reaffirmed in 2013. All participants provided written, informed consent for participation.
Study reporting
This study is reported according to the ‘Strengthening the Reporting of Observational Studies in Epidemiology (STROBE) Statement’[23].
Results
Study population
A total of 2250 AP cases were analyzed.Table 1contains the baseline information of participants in each subgroup of all three subcohorts (BAP, OAP and DAP). A statistically significant trend of increasing proportion of hyperlipidemia and DM in the medical history with increasing HbA1c and glucose values was seen in all subcohorts. Among groups with different on-admission glucose values, significant age differences were noted, with the highest mean ages observed in groups 4e6 (glucose 7.8e19.99 mmol/L) and lowest in group 1 (glucose<4 mmol/L).
Etiology distribution
Fig. 1 shows how different etiologies of AP were distributed across our examined subgroups. While most etiologies showed a balanced distribution, hypertriglyceridemia (HTG) increased in higher HbA1c and serum glucose groups, starting at HbA1c>7% in the BAP, and glucose>11.1 mmol/L in the OAP and DAP subcohorts.
A detailed table of etiology distribution can be found in our sup- plementary material (Supplementary Table 4).
BAP: pre-existing disturbance of glucose metabolism shows a trend of increasing AP severity and local complications
While no statistically significant differences were noted (p¼0.394), a trend of increasing HbA1c and increasing AP severity was observed. AP severity was highest in Group 4 (21.4% moderate, 5.8% severe). HbA1c was directly associated with the length of hospitalization (p < 0.001) and maximal CRP (p < 0.001), both peaking in group 4 probably due to the higher proportion of moderate cases, but not with mortality, which was the greatest in
orbe et al. Pancreatology xxx (xxxx) xxx
Table 1
Baseline characteristics of participants in each group of all three subcohorts. AP: acute pancreatitis; BAP: before AP; OAP: on-admission with AP; DAP: during AP; %: per- centage; n: number; SD: standard deviation; p: P-value; RAP: recurrent acute pancreatitis; IQR: interquartile range; CP: chronic pancreatitis; DM: diabetes mellitus in the personal medical history; Hyperlip: hyperlipidemia in the personal medical history.
BAPeHbA1c p
Groups, HbA1c% 6.50 6.51e7.00 7.01e8.00 8.01e9.00 9.01
n (%) 633 (84.0) 28 (3.7) 32 (4.2) 22 (2.9) 39 (5.2)
Age (years), mean (SD) 56.50 (16.76) 63.54 (12.20) 58.38 (12.76) 55.23 (11.59) 53.08 (13.86) 0.068
Female, n (%) 260 (41) 13 (46) 10 (31) 4 (18) 11 (28) 0.078
RAP, n (%) 142 (22) 2 (7) 7 (22) 7 (32) 10 (26) 0.561
Episodes, n, median (IQR)
138; 1.00 (1.00, 2.00) 2; 1.00 (1.00, 1.00) 6; 1.00 (1.00, 1.00) 7; 1.00 (1.00, 3.50) 10; 1.50 (1.00, 2.75)
0.845
CP, n (%) 48 (8) 3 (11) 3 (9) 2 (9) 2 (5) 0.882
DM, n (%) 74 (11.7) 17 (60.7) 28 (87.5) 18 (81.8) 35 (89.7) <0.001
Hyperlip, n (%) 56 (9) 4 (16) 6 (21) 5 (26) 16 (43) <0.001
OAPeon-admission serum glucose p
Groups, mmol/L 3.99 4e5.99 6.00e7.79 7.80e11.09 11.10e14.99 15.00e19.99 20.00
n (%) 21 (1.0) 468 (22.0) 697 (32.7) 613 (28.8) 221 (10.4) 68 (3.2) 41 (1.9)
Age (years), mean (SD) 45.52 (19.88) 51.40 (17.23) 56.12 (17.62) 59.92 (15.56) 61.20 (14.81) 58.62 (13.91) 53.05 (15.23) <0.001
Female, n (%) 12 (57) 208 (44) 294 (42) 266 (43) 96 (43) 23 (34) 14 (34) 0.423
RAP, n (%) 2 (10) 109 (23) 161 (23) 134 (22) 40 (18) 16 (24) 6 (15) 0.216
Episodes, n, median (IQR)
2; 1.50 (1.25, 1.75)
102; 1.00 (1.00, 2.00)
152; 1.00 (1.00, 2.00)
124; 1.00 (1.00, 2.00)
35; 1.00 (1.00, 2.00)
16; 1.00 (1.00, 2.50)
6; 2.50 (2.00, 3.75)
0.227
CP, n (%) 0 (0) 30 (6) 46 (7) 30 (5) 6 (3) 3 (4) 4 (10) 0.259
DM, n (%) 2 (9.5) 24 (5.1) 62 (8.9) 121 (19.7) 105 (47.5) 49 (72.1) 30 (73.2) <0.001
Hyperlip, n (%) 2 (13) 41 (10) 67 (11) 100 (19) 40 (21) 15 (25) 18 (50) <0.001
DAPepeak serum glucose p
Groups, mmol/L 3.99 4.00e5.99 6.00e7.79 7.80e11.09 11.10e14.99 15.00e19.99 20.00
n (%) 6 (1.0) 187 (31.3) 143 (24.0) 123 (20.6) 79 (13.2) 43 (7.2) 16 (2.7)
Age (years), mean (SD) 60.50 (19.21) 58.03 (18.97) 57.83 (16.13) 59.54 (15.19) 60.82 (13.24) 57.84 (14.44) 61.50 (14.02) 0.844
Female, n (%) 4 (67) 88 (47) 63 (44) 50 (41) 29 (37) 19 (44) 8 (50) 0.611
RAP, n (%) 3 (50) 37 (20) 34 (24) 27 (22) 19 (24) 8 (19) 3 (19) 0.868
Episodes, n, median (IQR)
3; 2.00 (1.50, 2.00)
35; 2.00 (1.00, 2.00)
30; 1.00 (1.00, 2.00)
22; 1.00 (1.00, 3.00)
16; 1.00 (1.00, 3.00) 7; 1.00 (1.00, 1.50)
3; 1.00 (1.00, 1.50)
0.577
CP, n (%) 0 (0) 11 (6) 6 (4) 3 (2) 6 (8) 4 (9) 0 (0) 0.770
DM, n (%) 0 (0) 13 (7.0) 17 (11.9) 28 (22.8) 46 (58.2) 29 (67.4) 10 (62.5) <0.001
Hyperlip, n (%) 2 (33) 18 (12) 21 (18) 19 (17) 23 (31) 13 (33) 6 (40) <0.001
Fig. 1.Etiology distribution. The top row shows the classification of groups. The middle row shows how etiologies within each group (etiologies add up to 100%). The bottom row shows group distribution within each etiology (groups add up to 100%). AP: acute pancreatitis; BAP: before AP; OAP: on-admission with AP; DAP: during AP; HbA1c: hemoglobin A1c; Glu: serum glucose; HTG: hypertriglyceridemia; bil: biliary, alc: alcoholic; comb: combined; idiop: idiopathic.
orbe et al. Pancreatology xxx (xxxx) xxx
Group 2 (7.1%) (Fig. 2).
No trends were identified regarding systemic complications (respiratory, renal or heart failure) (p¼0.959); the highest rate of organ failures was found in Group 3 (12.5%) (Fig. 3). On the other hand, an increasing proportion of local complications (peri- pancreaticfluid, pancreas pseudocyst, pancreas necrosis) were seen with increasing HbA1c (Fig. 4), without statistical significance (p¼0.122).
The binary logistic regression did not show HbA1c to be an in- dependent predictor of mortality (OR ¼ 1.211 (95% CI:
0.859e1.646), p ¼ 0.241) or severity (OR ¼ 1.028 (95% CI:
0.768e1.332), p ¼0.843) (Supplementary Tables 8e9). The ROC analysis (Supplementary Fig. 4) showed that HbA1c fails to predict
mortality (AUC ¼0.545) and poorly predicts the severity of AP (AUC¼0.601).
OAP and DAP: on-admission and peak glucose levels demonstrate a dose-dependent association with worse AP outcomes (severity, mortality, complications, LOH, maximal CRP)
A dose-dependent association was seen between on-admission glucose levels, peak in-hospital glucose levels and: severity (p<0.001 in both OAP and DAP), mortality (p<0.001 OAP and DAP), LOH (p<0.001 OAP and DAP), maximal CRP (p<0.001 OAP and DAP) (Fig. 2), systemic complications (p<0.001 OAP and DAP;
Fig. 3) and local complications (p<0.001 OAP and DAP;Fig. 4).
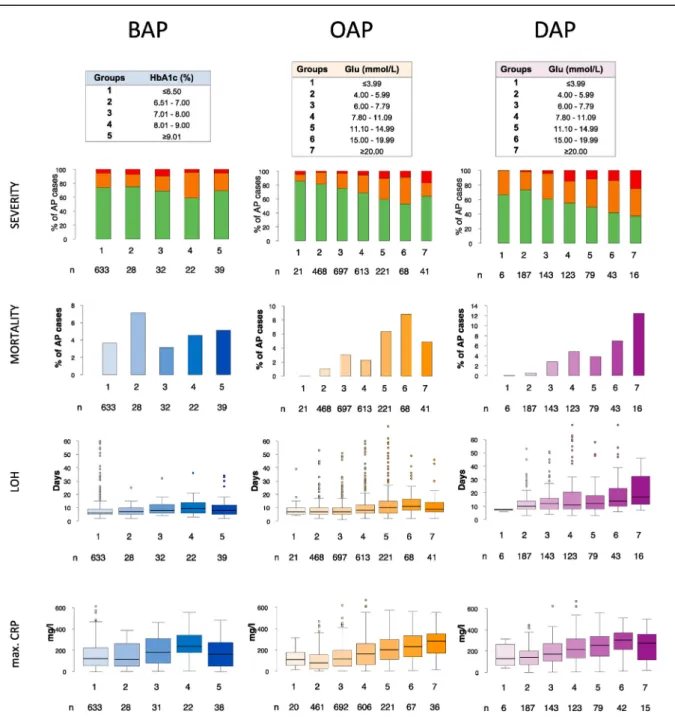
Fig. 2. AP severity, mortality, length of AP-associated hospital stay, maximal CRP. AP: acute pancreatitis; BAP: before AP; OAP: on-admission with AP; DAP: during AP; HbA1c:
hemoglobin A1c; Glu: serum glucose; LOH: length of AP associated hospitalization; max. CRP: maximal C-reactive protein. Some statisctical outliers were removed (not omitted) in case of the LOH and max. CRP boxplots to facilitate interpretation, originalfigures can be found in the supplementary material (Supplementary Fig. 3).
orbe et al. Pancreatology xxx (xxxx) xxx
The group with a peak in-hospital glucose20 mmol/L (Group 7) noted the highest severity (37.5% moderate, 25.0% severe), mortality (12.5%), systemic (43.8%) and local complications (62.5%).
While similarly, on-admission glucose Group 7 saw the highest rate of local complications (36.6%), Group 6 (serum glucose 15e19.99 mmol/L) had the highest severity (38.2% moderate, 8.8%
severe), mortality (8.8%), and rate of systemic complications (14.7%).
The binary logistic regression established both on-admission and peak in-hospital serum glucose to be independently
associated with mortality (OR ¼ 1.133 (95% CI: 1.064e1.204), p < 0.001 and OR ¼ 1.089 (95% CI: 1.020e1.161), p ¼ 0.006, respectively) and severity (OR ¼ 1.131 (95% CI: 1.078e1.186), p < 0.001 and OR ¼ 1.093 (95% CI: 1.039e1.152), p < 0.001, respectively) (Supplementary Tables 8e9). The ROC analysis (Supplementary Fig. 4) showed on-admission glucose to be a poor predictor of mortality (AUC ¼0.636 for an estimated cut-off of 10.635 mmol/l) and severity (AUC¼0.671 for an estimated cut-off of 9.435 mmol/l). An on-admission glucose>10 mmol/l had an OR of 3.140 (95% CI: 2.106e4.682) for severe AP and an OR of 2.666 Fig. 3. Systemic complications as defined by the revised Atlanta classification and Marshall criteria. The top row shows the classification of groups. The second row shows the percentage of AP cases with organ failure (one or more of lungs, heart and kidney). The third, fourth, and bottom rows show the percentage of AP cases with respiratory, heart and renal failure, respectively, in each group. AP: acute pancreatitis; BAP: before AP; OAP: on-admission with AP; DAP: during AP; HbA1c: hemoglobin A1c; Glu: serum glucose.
orbe et al. Pancreatology xxx (xxxx) xxx
(95% CI: 1.587e4.478) for mortality. The ROC analysis indicated that peak in-hospital glucose is a fair predictor of mortality (AUC¼0.703 for an estimated cut-off of 6.665 mmol/l) and severity (AUC¼0.732 for an estimated cut-off of 7.355 mmol/l). A peak in- hospital glucose >7 mmol/l had an OR of 14.490 (95% CI:
4.443e47.264) for severe AP and an OR of 4.750 (95% CI:
1.370e16.476) for mortality.
Hypoglycemia (Group 1) was associated with a higher rate of organ failure and maximal CRP in both the OAP and DAP subcohorts
and higher severity only in the DAP subcohort. Increased mortality, LOH or local complications were not seen.
Additional trends, intergroup differences
The results of additional trend tests not discussed in the article's main body and P-values corresponding to intergroup differences for all examined outcomes can be found in the supplementary material (Supplementary Tables 5e7).
Fig. 4.Local pancreatic complications as defined by the revised Atlanta classification. The top row shows the classification of groups. The second row shows the percentage of AP cases with local complications (one or more of acute peripancreaticfluid collection, pancreas pseudocyst, pancreas necrosiseno distinction between acute necrotic collection and walled-off necrosis). The third, fourth, and bottom rows show the percentage of AP cases with acute peripancreaticfluid collection, pancreas pseudocyst and pancreas necrosis, respectively, in each group. AP: acute pancreatitis; BAP: before AP; OAP: on-admission with AP; DAP: during AP; HbA1c: hemoglobin A1c; Glu: serum glucose.
orbe et al. Pancreatology xxx (xxxx) xxx
Discussion
Pancreatic inflammation together with cell death are the end steps of an intricate interplay of eventseas described by the model of“multiple hits on multiple targets”, various signaling pathways are activated resulting in the clinical entity of AP [24]. The main alterations observed inside the acinar cells are the increase in cal- cium concentration, increase in the number of lysosomes and zymogen granules, leading to mitochondrial dysfunction, endo- plasmic reticulum stress and premature trypsinogen activation [3].
These changes can be initiated either by ductal obstruction [25,26]
or by the direct acinar effect of various pancreatotoxic agents [27,28]. The most common culprits responsible for pancreatic toxicity are bile acids, alcohol and its metabolites, but fatty acids and fatty acid ethyl esters are also described to initiate the above- mentioned pathways in a dose-dependent manner [27,29e32].
And observations go beyond basic sciencee cohort studies also describe hypertriglyceridemia to be dose-dependently associated with increasing severity and rate of complications [8]. Some drugs as well and smoking are presumed to directly damage the pancreas in a dose dependent manner [33,34].
There is a layered relationship between DM and AP. In severe AP cases with substantial pancreatic necrosis,b-cell loss can lead to the development of DM [35]. But even in moderate and mild AP, impaired b-cell function and insulin resistance are observed in more than 30% of the cases [36], leading to a two-fold risk for developing diabetes after experiencing a single episode [37,38]. At the same time, cohort studies described a 1.5e3 times higher risk of AP among type 2 diabetic individualsea possible reason behind this are the overlapping risk factors (e.g., obesity and hyper- triglyceridemia) [7,39e41]. Another key point in the many in- tersections between these two conditions is the higher severity of AP in individuals with pre-existing DM. A meta-analysis of cohort studies described a significantly higher risk of complications, intensive care unit (ICU) admission, and mortality as compared to non-DM individuals [42]. In a pancreatitis rat model, streptozotocin-induced hyperglycemia significantly reduced the pancreatic amylase content, which the investigators believed to be due to the direct harmful effects on acinar cells [43]. This indicates that glucose itself could be involved in AP as a potential pan- creatotoxic agent. So far, clinical investigations were limited to discussing the role of DMeand neglected the glycemic state.
Our study is thefirst to focus on how alterations of the glucose homeostasis affect clinically relevant outcomes of AP. We found on- admission and peak in-hospital serum glucose concentrations to have a statistically significant dose-dependent relationship with AP severity, mortality, LOH, maximal CRP, systemic and local compli- cations. Both these variables are independently (accounting for DM, age, gender and etiology) associated with AP severity and mortality, a peak in-hospital glucose >7 mmol/l being associated with a 15 times higher likelihood of severe AP andfive times higher likeli- hood of death. While statistically significant dose-dependency was only identified with LOH and maximal CRP in case of HbA1c, a trend of increasing severity and rate of local complications was also noted. In light of the currently available scientific literature on the matter, these findings strongly suggest that glucose has a direct pancreatotoxic effect.
The main step in glucose-mediated cytotoxicity is the intracel- lular increase in reactive oxygen species (ROS) [44]. ROS also have a central role in the process of pancreatic inflammation, promoting pathways towards mitochondrial dysfunction, cell death and inflammation in a self-amplifying manner [45,46]. Another way in which glucose could potentially harm the pancreas is via influ- encing its vasculature. Increased ROS production inside endothelial cells in hyperglycemia causes microvascular endothelial
dysfunction by decreasing nitric oxide availability and increasing permeability, leukocyte adhesion and procoagulant activity [47].
Such microvascular disturbances contribute to the inflammation of the ischemia-sensitive pancreas [48].
While we demonstrated dose-dependency and independent association with AP severity and mortality, the whole extent of worsening AP outcomes should not exclusively be attributed to glucose. As hyperglycemia often presents in the context of DM and metabolic syndrome, the prevalence of these conditions accumu- lates with increasing glucose concentration. Here, an increased rate of hypertriglyceridemia, cholelithiasis and possiblyb-cell hyper- trophy facilitate the formation of AP [49e52], with hyper- triglyceridemia also being associated with a more severe disease course in most studies, although controversy still exists [53e55].
Accordingly, in our cohort, we observed a growing proportion of hypertriglyceridemia with increasing serum glucose and HbA1c values. Severity and mortality however, only increased parallelly with on-admission and peak glucose, but not HbA1c. This might partly be due to the low participant and event numbers in the higher HbA1c groupse83.9% of cases had HbA1c values below 6.5%
- and partly because HbA1c indicates the preceding three months' glucose homeostasis, not necessarily reflecting glucose levels at the time of the AP. All in all, the fact that the proportion of hyper- triglyceridemia increased with all three variables, but severity and mortality only did so with serum glucose further reinforces the results of our binary logistic regression, underlining the potential pancreatotoxic nature of hyperglycemia.
Apart from signaling a transient dysregulation, on-admission and especially peak in-hospital hyperglycemia could also be caused by new-onset pancreatogenic DM. A common concern is that AP episodes that are more severe might have a higher likeli- hood of substantialb-cell death; this could increase the proportion of severe cases among those with high glucose values. However, clinical studies do not support the association between AP severity and newly diagnosed DM [56]. DM and thus pathological serum glucose values can be overrepresented in CP cases, 25e80% of CP patients develop DM [57]. Acute exacerbations in people with CP are known to be less severe [58], possibly decreasing severity and mortality in higher HbA1c and glucose groups, but we found a balanced distribution of CP among groups.
Strengths and limitations
Strengths: To our knowledge, this is the first clinical study focusing on the role of glucose homeostasis in AP, observing the presence of dose-dependency with its clinically important out- comes. We succeeded in demonstrating dose-dependency and in- dependent association with AP severity and mortality for both on- admission and peak in-hospital serum glucose. The data source is a prospective cohort, boasting an impressive number of patients from multiple centers worldwide, enhancing the applicability of our results. As described in the 'Methods' section we also applied a rigorous quality control system, to ensure the validity of our data.
Limitations: A limitation to our study is that glucose values cannot be separated from the underlying DM and metabolic comorbidities, possibly influencing outcomes. Nevertheless, we feel that they should not be separated: although more likely in diabetic patients, hyperglycemia can occur and elicit pan- creatotoxicity in any subpopulation. Distinguishing exactly what causes the dysregulation in each patient was beyond the scope of this clinically oriented cohort analysise an interesting question nonetheless for future studies. Another limitation is that DM is overrepresented in the BAP subcohort (23.0% of HbA1c measure- ments happened in known diabetic participants). Only 26.5% of patients had at least two glucose measurements during their
orbe et al. Pancreatology xxx (xxxx) xxx
hospitalization, predominantly those with abnormal on-admission values (44.7%). As mentioned in the 'Methods' section, capillary glucose values (although representing the minority of cases) were also accepted. In an attempt to form groups based on established cut-offs and equal increments, some groups ended up having relatively low participant numbers, weakening statistical power.
Implications
Prevention: Increased HbA1c was associated with higher severity and a higher rate of local complications. Maintaining a normal glucose homeostasis might reduce the risk of these events.
Prognosis: Increased on-admission glucose has a dose- dependent association with increasing severity, mortality, LOH and complications of AP.
Prompt treatment: High peak glucose is dose-dependently associated with a higher rate of severe cases, mortality, systemic complications and increased LOH. Hyperglycemia does not neces- sarily present on admission, monitoring serum glucose during the course of AP is crucial. Adequate in-hospital control of hypergly- cemia could greatly contribute to the treatment of AP.
Author contributions
AN and AP drafted the original concept, and conducted the majority of data interpretation, AN wrote the majority of the manuscript. MFJ helped prepare the raw data for statistical analysis, participated in patient enrolment, supervised data quality and wrote the‘Methods’section. AG and AV conducted the statistical analyses. FI,AV, PS, JC, ZS, TT, MP, EF, HJ, KK, IT, DS, GP, ATI, BE, KM, DP, DI, OF, TN, PK, ZM all provided a substantial number of enrolled participants. SV and MF participated in patient enrolment, orga- nized and prepared raw data for statistical analysis. NF acted as a radiological supervisor, evaluating radiologicalfindings and help- ing interpretation. AS, PH and AP acted as supervisors of the article writing process. All co-authors (1) made contributions to the concept and design of the study as well as the data analysis and interpretation; (2) aided the drafting of the article especially in regards to intellectual content; (3) read and approved the final version of the manuscript.
Declaration of competing interest Authors declare no conflict of interest.
Acknowledgements
Our study was supported by the Human Resources Develop- ment Operational Programme Grant [Grant Number: EFOP-3.6.2- 16-2017-00006 e LIVE LONGER], co-financed by the European Union (European Regional Development Fund) within the frame- work of Programme Szechenyi 2020 (PH), a Janos Bolyai Research Scholarship and New National Excellence Programme Grant from the Hungarian Academy of Sciences (AP), New National Excellence Programme Grants from the Hungarian Academy of Sciences (MFJ, MF and SV), a National Research, Development and Innovation Office Project Grant (K116634, PH). The funders played no role in planning the concept, data analysis, interpretation, writing of the manuscript and choosing to publish. The authors are very thankful to those collaborators who uploaded clinical data but did not reach the necessary contribution to be among the authors, as well as all data managers and clinical administrators taking part in the quality control of these cases, making this work possible.
Appendix A. Supplementary data
Supplementary data to this article can be found online at https://doi.org/10.1016/j.pan.2021.06.003.
References
[1] Lankisch PG, Apte M, Banks PA. Acute pancreatitis. Lancet 2015;386:85e96.
[2] Roberts SE, Morrison-Rees S, John A, Williams JG, Brown TH, Samuel DG. The incidence and aetiology of acute pancreatitis across europe. Pancreatology 2017;17:155e65.
[3] Lee PJ, Papachristou GI. New insights into acute pancreatitis. Nat Rev Gas- troenterol Hepatol 2019;16:479e96.
[4] Boxhoorn L, Voermans RP, Bouwense SA, Bruno MJ, Verdonk RC, Boermeester MA, et al. Acute pancreatitis. Lancet 2020;396:726e34.
[5] Parniczky A, Kui B, Szentesi A, Balazs A, Sz}ucsA, Mosztbacher D, et al. Pro- spective, multicentre, nationwide clinical data from 600 cases of acute pancreatitis. PloS One 2016;11. e0165309-e0165309.
[6] Portelli M, Jones CD. Severe acute pancreatitis: pathogenesis, diagnosis and surgical management. Hepatobiliary Pancreat Dis Int 2017;16:155e9.
[7] Szentesi A, Parniczky A, VinczeA, Bajor J, G odi S, Sarlos P, et al. Multiple hits in acute pancreatitis: components of metabolic syndrome synergize each other's deteriorating effects. Front Physiol 2019;10. 1202-1202.
[8] Mosztbacher D, Hanak L, Farkas N, Szentesi A, Miko A, Bajor J, et al. Hyper- triglyceridemia-induced acute pancreatitis: a prospective, multicenter, inter- national cohort analysis of 716 acute pancreatitis cases. Pancreatology 2020;20:608e16.
[9] Wahab NN, Cowden EA, Pearce NJ, Gardner MJ, Merry H, Cox JL. Is blood glucose an independent predictor of mortality in acute myocardial infarction in the thrombolytic era? J Am Coll Cardiol 2002;40:1748e54.
[10] Stranders I, Diamant M, van Gelder RE, Spruijt HJ, Twisk JW, Heine RJ, et al.
Admission blood glucose level as risk indicator of death after myocardial infarction in patients with and without diabetes mellitus. Arch Intern Med 2004;164:982e8.
[11] Hallevi H, Barreto AD, Liebeskind DS, Morales MM, Martin-Schild SB, Abraham AT, et al. Identifying patients at high risk for poor outcome after intra-arterial therapy for acute ischemic stroke. Stroke 2009;40:1780e5.
[12] Natarajan SK, Dandona P, Karmon Y, Yoo AJ, Kalia JS, Hao Q, et al. Prediction of adverse outcomes by blood glucose level after endovascular therapy for acute ischemic stroke. J Neurosurg 2011;114:1785e99.
[13] Gustafsson I, Kistorp CN, James MK, Faber JO, Dickstein K, Hildebrandt PR.
Unrecognized glycometabolic disturbance as measured by hemoglobin a1c is associated with a poor outcome after acute myocardial infarction. Am Heart J 2007;154:470e6.
[14] Cakmak M, Cakmak N, Cetemen S, Tanriverdi H, Enc Y, Teskin O, et al. The value of admission glycosylated hemoglobin level in patients with acute myocardial infarction. Can J Cardiol 2008;24:375e8.
[15] Arnold M, Mattle S, Galimanis A, Kappeler L, Fischer U, Jung S, et al. Impact of admission glucose and diabetes on recanalization and outcome after intra- arterial thrombolysis for ischaemic stroke. Int J Stroke 2014;9:985e91.
[16] Simoes M, Alves P, Esperto H, Canha C, Meira E, Ferreira E, et al. Predicting acute pancreatitis severity: comparison of prognostic scores. Gastroenterol Res 2011;4:216e22.
[17] Iap/apa evidence-based guidelines for the management of acute pancreatitis.
Pancreatology 2013;13:e1e15.
[18] Hritz I, Czako L, Dubravcsik Z, Farkas G, Kelemen D, Lasztity N, et al. [acute pancreatitis. Evidence-based practice guidelines, prepared by the Hungarian pancreatic study group]. Orv Hetil 2015;156:244e61.
[19] Parniczky A, Lantos T, Toth EM, Szakacs Z, Godi S, Hagendorn R, et al. Anti- biotic therapy in acute pancreatitis: from global overuse to evidence based recommendations. Pancreatology 2019;19:488e99.
[20] World Health O, International Diabetes F. Definition and diagnosis of diabetes mellitus and intermediate hyperglycaemia : report of a who/idf consultation.
Geneva: World Health Organization; 2006.
[21] Banks PA, Bollen TL, Dervenis C, Gooszen HG, Johnson CD, Sarr MG, et al.
Classification of acute pancreatitis–2012: revision of the atlanta classification and definitions by international consensus. Gut 2013;62:102e11.
[22] Benjamini Y, Hochberg Y. Controlling the false discovery rate: a practical and powerful approach to multiple testing. J Roy Stat Soc B 1995;57:289e300.
[23] von Elm E, Altman DG, Egger M, Pocock SJ, Gøtzsche PC, Vandenbroucke JP.
The strengthening the reporting of observational studies in epidemiology (strobe) statement: guidelines for reporting observational studies. Lancet 2007;370:1453e7.
[24] Sahin-Toth M, Hegyi P. Smoking and drinking synergize in pancreatitis:
multiple hits on multiple targets. Gastroenterology 2017;153:1479e81.
[25] Venglovecz V, Pallagi P, Kemeny LV, Balazs A, Balla Z, Becskehazi E, et al. The importance of aquaporin 1 in pancreatitis and its relation to the cftr cl(-) channel. Front Physiol 2018;9:854.
[26] Hegyi P, Pandol S, Venglovecz V, Rakonczay Jr Z. The acinar-ductal tango in the pathogenesis of acute pancreatitis. Gut 2011;60:544e52.
[27] Criddle DN, McLaughlin E, Murphy JA, Petersen OH, Sutton R. The pancreas misled: signals to pancreatitis. Pancreatology 2007;7:436e46.
[28] Wu JS, Li WM, Chen YN, Zhao Q, Chen QF. Endoplasmic reticulum stress is
orbe et al. Pancreatology xxx (xxxx) xxx
activated in acute pancreatitis. J Dig Dis 2016;17:295e303.
[29] Maleth J, Hegyi P. Ca2þtoxicity and mitochondrial damage in acute pancre- atitis: translational overview. Philos Trans R Soc Lond B Biol Sci 2016;371.
[30] Mosztbacher D, Farkas N, Solymar M, Par G, Bajor J, Sz}ucsA, et al. Restoration of energy level in the early phase of acute pediatric pancreatitis. World J Gastroenterol 2017;23:957e63.
[31] Criddle DN. The role of fat and alcohol in acute pancreatitis: a dangerous liaison. Pancreatology 2015;15:S6es12.
[32] Maleth J, Hegyi P, Rakonczay Jr Z, Venglovecz V. Breakdown of bioenergetics evoked by mitochondrial damage in acute pancreatitis: mechanisms and consequences. Pancreatology 2015;15:S18e22.
[33] Simons-Linares CR, Elkhouly MA, Salazar MJ. Drug-induced acute pancreatitis in adults: an update. Pancreas 2019;48:1263e73.
[34] Wittel UA, Pandey KK, Andrianifahanana M, Johansson SL, Cullen DM, Akhter MP, et al. Chronic pancreatic inflammation induced by environmental tobacco smoke inhalation in rats. Am J Gastroenterol 2006;101:148e59.
[35] Meier JJ, Breuer TG, Bonadonna RC, Tannapfel A, Uhl W, Schmidt WE, et al.
Pancreatic diabetes manifests when beta cell area declines by approximately 65% in humans. Diabetologia 2012;55:1346e54.
[36] Symersky T, van Hoorn B, Masclee AA. The outcome of a long-term follow-up of pancreatic function after recovery from acute pancreatitis. Jop 2006;7:
447e53.
[37] Shen HN, Yang CC, Chang YH, Lu CL, Li CY. Risk of diabetes mellitus afterfirst- attack acute pancreatitis: a national population-based study. Am J Gastro- enterol 2015;110:1698e706.
[38] Lee Y-K, Huang M-Y, Hsu C-Y, Su Y-C. Bidirectional relationship between diabetes and acute pancreatitis: a population-based cohort study in taiwan.
Medicine (Baltim) 2016;95. e2448-e2448.
[39] Noel RA, Braun DK, Patterson RE, Bloomgren GL. Increased risk of acute pancreatitis and biliary disease observed in patients with type 2 diabetes: a retrospective cohort study. Diabetes Care 2009;32:834e8.
[40] Girman CJ, Kou TD, Cai B, Alexander CM, O'Neill EA, Williams-Herman DE, et al. Patients with type 2 diabetes mellitus have higher risk for acute pancreatitis compared with those without diabetes. Diabetes Obes Metabol 2010;12:766e71.
[41] Lai SW, Muo CH, Liao KF, Sung FC, Chen PC. Risk of acute pancreatitis in type 2 diabetes and risk reduction on anti-diabetic drugs: a population-based cohort study in taiwan. Am J Gastroenterol 2011;106:1697e704.
[42] Miko A, Farkas N, Garami A, Szabo I, VinczeA, Veres G, et al. Preexisting diabetes elevates risk of local and systemic complications in acute pancrea- titis: systematic review and meta-analysis. Pancreas 2018;47:917e23.
[43] Hegyi P, Takacs T, Tiszlavicz L, Czako L, Lonovics J. Recovery of exocrine pancreas six months following pancreatitis induction with l-arginine in streptozotocin-diabetic rats. J Physiol Paris 2000;94:51e5.
[44] Kawahito S, Kitahata H, Oshita S. Problems associated with glucose toxicity:
role of hyperglycemia-induced oxidative stress. World J Gastroenterol 2009;15:4137e42.
[45] Cao WL, Xiang XH, Chen K, Xu W, Xia SH. Potential role of nadph oxidase in pathogenesis of pancreatitis. World J Gastrointest Pathophysiol 2014;5:
169e77.
[46] Leung PS, Chan YC. Role of oxidative stress in pancreatic inflammation. An- tioxidants Redox Signal 2009;11:135e65.
[47] Stehouwer CDA. Microvascular dysfunction and hyperglycemia: a vicious cycle with widespread consequences. Diabetes 2018;67:1729e41.
[48] Cuthbertson CM, Christophi C. Disturbances of the microcirculation in acute pancreatitis. Br J Surg 2006;93:518e30.
[49] Khatua B, El-Kurdi B, Singh VP. Obesity and pancreatitis. Curr Opin Gastro- enterol 2017;33:374e82.
[50] Radmard AR, Merat S, Kooraki S, Ashraf M, Keshtkar A, Sharafkhah M, et al.
Gallstone disease and obesity: a population-based study on abdominal fat distribution and gender differences. Ann Hepatol 2015;14:702e9.
[51] Mondragon A, Davidsson D, Kyriakoudi S, Bertling A, Gomes-Faria R, Cohen P, et al. Divergent effects of liraglutide, exendin-4, and sitagliptin on beta-cell mass and indicators of pancreatitis in a mouse model of hyperglycaemia.
PloS One 2014;9:e104873.
[52] Albai O, Roman D, Frandes M. Hypertriglyceridemia, an important and inde- pendent risk factor for acute pancreatitis in patients with type 2 diabetes mellitus. Therapeut Clin Risk Manag 2017;13:515e22.
[53] Kiss L, F}ur G, Matrai P, Hegyi P, Ivany E, Cazacu IM, et al. The effect of serum triglyceride concentration on the outcome of acute pancreatitis: systematic review and meta-analysis. Sci Rep 2018;8:14096.
[54] Balint ER, F}ur G, Kiss L, Nemeth DI, Soos A, Hegyi P, et al. Assessment of the course of acute pancreatitis in the light of aetiology: a systematic review and meta-analysis. Sci Rep 2020;10. 17936-17936.
[55] Pothoulakis I, Paragomi P, Archibugi L, Tuft M, Talukdar R, Kochhar R, et al.
Clinical features of hypertriglyceridemia-induced acute pancreatitis in an in- ternational, multicenter, prospective cohort (apprentice consortium). Pan- creatology 2020;20:325e30.
[56] Das SL, Singh PP, Phillips AR, Murphy R, Windsor JA, Petrov MS. Newly diagnosed diabetes mellitus after acute pancreatitis: a systematic review and meta-analysis. Gut 2014;63:818e31.
[57] Hart PA, Bellin MD, Andersen DK, Bradley D, Cruz-Monserrate Z, Forsmark CE, et al. Type 3c (pancreatogenic) diabetes mellitus secondary to chronic pancreatitis and pancreatic cancer. Lancet Gastroenterol Hepatol 2016;1:
226e37.
[58] Hegyi PJ, Soos A, Toth E,Ebert A, Venglovecz V, Marta K, et al. Evidence for diagnosis of early chronic pancreatitis after three episodes of acute pancrea- titis: a cross-sectional multicentre international study with experimental animal model. Sci Rep 2021;11:1367.
orbe et al. Pancreatology xxx (xxxx) xxx