Association Study with 77 SNPs Confirms the Robust Role for the rs10830963/G of MTNR1B Variant and Identifies Two Novel Associations in Gestational Diabetes Mellitus Development
Klara Rosta1,2, Zahra Al-Aissa3, Orsolya Hadarits2, Ju¨ rgen Harreiter4, A´ kos Na´dasdi3, Fanni Kelemen5, Dagmar Bancher-Todesca1, Zsolt Komlo´ si6, La´szlo´ Ne´meth7, Ja´nos Rigo´ , Jr.2, Istva´n Sziller8, Aniko´ Somogyi3, Alexandra Kautzky-Willer4, Ga´bor Firneisz3,9*
1 Department of Obstetrics and Gynecology, Medical University of Vienna, Vienna, Austria, 2 1stDepartment of Obstetrics and Gynecology, Semmelweis University, Budapest, Hungary, 3 2ndDepartment of Internal Medicine, Semmelweis University, Budapest, Hungary, 4 Gender Medicine Unit, Division of Endocrinology and Metabolism, Department of Internal Medicine III, Medical University of Vienna, Vienna, Austria, 5 University of Szeged, Faculty of Medicine, Szeged, Hungary, 6 Department of Pulmonology, Semmelweis University, Budapest, Hungary, 7 Department of Probability Theory and Statistics, Eo¨tvo¨s Lora´nd University, Budapest, Hungary, 8 Department of Obstetrics and Gynecology, Szent Imre Teaching Hospital, Budapest, Hungary, 9 Hungarian Academy of Sciences - Semmelweis University, Molecular Medicine Research Group, Budapest, Hungary
*firneisz.gabor@med.semmelweis-univ.hu
Abstract
Context
Genetic variation in human maternal DNA contributes to the susceptibility for development of gestational diabetes mellitus (GDM).
Objective
We assessed 77 maternal single nucleotide gene polymorphisms (SNPs) for associations with GDM or plasma glucose levels at OGTT in pregnancy.
Methods
960 pregnant women (after dropouts 820: case/control: m99’WHO: 303/517, IADPSG: 287/
533) were enrolled in two countries into this case-control study. After genomic DNA isolation the 820 samples were collected in a GDM biobank and assessed using KASP (LGC Geno- mics) genotyping assay. Logistic regression risk models were used to calculate ORs accord- ing to IADPSG/m’99WHO criteria based on standard OGTT values.
Results
The most important risk alleles associated with GDM were rs10830963/G of MTNR1B (OR = 1.84/1.64 [IADPSG/m’99WHO], p = 0.0007/0.006), rs7754840/C (OR = 1.51/NS, p = 0.016) of CDKAL1 and rs1799884/T (OR = 1.4/1.56, p = 0.04/0.006) of GCK. The rs13266634/T a1111111111
a1111111111 a1111111111 a1111111111 a1111111111
OPEN ACCESS
Citation: Rosta K, Al-Aissa Z, Hadarits O, Harreiter J, Na´dasdi A´, Kelemen F, et al. (2017) Association Study with 77 SNPs Confirms the Robust Role for the rs10830963/G of MTNR1B Variant and Identifies Two Novel Associations in Gestational Diabetes Mellitus Development. PLoS ONE 12(1):
e0169781. doi:10.1371/journal.pone.0169781 Editor: Yvonne Bo¨ttcher, University of Oslo, NORWAY
Received: August 1, 2016 Accepted: December 21, 2016 Published: January 10, 2017
Copyright:©2017 Rosta et al. This is an open access article distributed under the terms of the Creative Commons Attribution License, which permits unrestricted use, distribution, and reproduction in any medium, provided the original author and source are credited.
Data Availability Statement: All relevant data are within the paper and its Supporting Information files.
Funding: This work was supported by the European Foundation for the Study of Diabetes (EFSD): New Horizons Collaborative Research Initiative (http://www.europeandiabetesfoundation.
org/index.php/ct-menu-item-9/14-sample-data- articles/168-efsd-new-horizons-collaborative- research-initiative). The funder had no role in study
(SLC30A8, OR = 0.74/0.71, p = 0.05/0.02) and rs7578326/G (LOC646736/IRS1, OR = 0.62/
0.60, p = 0.001/0.006) variants were associated with lower risk to develop GDM. Carrying a minor allele of rs10830963 (MTNR1B); rs7903146 (TCF7L2); rs1799884 (GCK) SNPs were associated with increased plasma glucose levels at routine OGTT.
Conclusions
We confirmed the robust association of MTNR1B rs10830963/G variant with GDM binary and glycemic traits in this Caucasian case-control study. As novel associations we report the minor, G allele of the rs7578326 SNP in the LOC646736/IRS1 region as a significant and the rs13266634/T SNP (SLC30A8) as a suggestive protective variant against GDM development. Genetic susceptibility appears to be more preponderant in individuals who meet both the modified 99’WHO and the IADPSG GDM diagnostic criteria.
Introduction
Abnormal glucose tolerance first recognized during pregnancy is defined as gestational diabe- tes mellitus (GDM). The estimated prevalence of GDM varies according to the study popula- tion and diagnostic criteria. A plethora of different GDM classification methods and diagnostic guidelines are available [1]. Prevalence estimates of gestational diabetes mellitus indicate that it is a common disease in developed countries with a prevalence ranging from 8.1–14.8% in Hun- gary (HUN) [2] and>10% in Austria (AT) [1], depending on the diagnostic criteria applied.
Pregnancy is generally characterized by increased adiposity and increased insulin resis- tance. Insulin resistance during pregnancy occurs partially due to the increased production of human placental lactogen, estrogen and prolactin especially in the second and third trimes- ters and also due to weight gain. Individuals with limited beta cell response to compensate for physiologically increased insulin resistance are more prone to develop GDM.
Due to the trends in modern societies the more prevalent clinical risk factors, such as higher pre-pregnancy body mass index (BMI) [3] and advanced age [4] at pregnancy resulted in increased insulin- resistance and a need for a compensatory increase in beta cell response. In line with this the prevalence of GDM started to increase sharply in the early 90s [4].
The role for genetic factors in disease development is confirmed by findings that women with a diabetic sibling have an 8.4-fold increased risk of GDM [5]. Since beta cell dysfunction is known to play a critical role in GDM [6,7] recent evidence from a twin study demonstrating a 75% heritability in insulin secretion variability in younger adults [8] underlines the impor- tance of genetic components in the development of GDM.
As GDM and type 2 diabetes mellitus (T2D) share similarities in their pathogenesis with respect to impaired insulin secretion and increased insulin resistance, research efforts focused on mapping their genetic properties. These studies demonstrated that GDM and T2D share common genetic background, with similar magnitude of effect sizes on the same risk alleles [9]. A few authors even suggested that GDM and type 2 diabetes are two aspects of the same entity [10]
Despite the number of genome wide associations studies (GWAS) performed and reports on associations for selected genotypes in GDM, the protective and risk genetic loci of GDM are still not fully elucidated [9,11–17]. This might be due to differences in the study populations (ethnicity), small sample size and the different diagnostic criteria used. Most of the GWAS
design, data collection and analysis, decision to publish, or preparation of the manuscript.
Competing Interests: The authors have declared that no competing interests exist.
studies in this disease were conducted in Asian populations [11], highlighting the need for con- firmation in Caucasian populations [18].
In our study, we aimed to identify maternal gene variants that are associated with GDM or influence fasting and 2-hour glucose levels after a routine 75 g oral glucose tolerance test (OGTT) during pregnancy (24-28thgestational week [gw]). A set of 77 gene variants single nucleotide polymorphisms (SNPs) were selected and the majority of these variants were com- mon variants previously reported to be associated with either T2D, GDM or with important metabolic traits, such as hemoglobin A1c levels, fasting and 2 hour plasma glucose levels, insu- lin-resistance indices, proinsulin levels or with other related traits such as the BMI [19]. We compared the impact of two different diagnostic criteria of GDM on the association of gene variants with GDM. In Austria, we used the International Association of the Diabetes and Pregnancy Study Groups (IADPSG) criteria [GDM: 75gCH OGTT at 24–28 gw: fasting plasma glucose (FPG)5.1mmol/L, 60 min plasma glucose (PG)10.0 mmol/L, 120 min PG8.5 mmol/L], while the Hungarian centers used the modified 1999 World Health Organization (WHO) recommendation [GDM: 75gCH OGTT at 24–28 gw: FPG6.1 mmol/L, 120 min PG7.8 mmol/L].
We assessed T2D susceptibility gene variants to confirm the interrelated genetic back- ground of GDM in a Caucasian population. We also hypothesized, that patient selection by different diagnostic criteria in GDM might influence the results of the genetic association study, as different threshold values in OGTT can have an influence on patient distribution between the control (CNTRL) and GDM group and thus could represent a bias if remains without adjustment.
Our results support the conception of a similar genetic background to GDM and T2D, however there are variances in the effect sizes of the risk/protective SNPs in between the two diseases. We confirmed the robust role of rs10830963/Gof Melatonin receptor 1B(MTNR1B) gene variant in developing GDM or glycemic traits. Furthermore, we identified two novel associations, namely the minor,Gallele of the rs7578326 SNP in theLOC646736/IRS1region as a significant, and the rs13266634/TSNP Solute carrier family 30 member 8 (SLC30A8) as a suggestive protective variant against GDM development. According to our findings, the minor allele frequency of the known common causalMTNR1Bvariant, rs10830963 is significantly higher in the GDM subgroup which meet both the modified 99’ WHO and the IADPSG diag- nostic criteria.
Materials and Methods Patients
The institutional (Semmelweis University, Regional and Institutional Committee of Science and Research Ethics and Ethics Committee of the Medical University of Vienna) and the national ethical bodies of Hungary (Medical Research Council Scientific and Research Com- mittee) and Austria (Federal Office for Safety and Health care) have approved the study, which was conducted according to the declaration of Helsinki. Pregnant women were enrolled to the study after signing the informed consent for the whole project and a special consent for storing their samples in a biobank for use in anonymized genetic studies.
Patients were recruited from two Hungarian and a single Austrian centers in the framework of the European Foundation for the Study of Diabetes New Horizons initiative.
Inclusion criteria
The diagnosis of GDM (inclusion criteria) has been established according to the national rec- ommendations of the two countries: the Austrian study center applied the IADPSG criteria
[GDM: 75gCH OGTT at 24–28 gw: FPG5.1mmol/L, 60 min PG10.0 mmol/L, 120 min PG8.5 mmol/L], while the Hungarian centers used the modified 1999 WHO recommenda- tion [GDM: 75gCH OGTT at 24–28 gw: FPG6.1 mmol/L, 120 min PG7.8 mmol/L] [20, 21].
Exclusion criteria
Exclusion criteria were based in part on the STrengthening the Reporting of observational (case-control) studies in Epidemiology statement for Genetic Association studies (STREGA) guidelines [22]. In addition we excluded patients with: diabetes in pregnancy (i.e. overt diabe- tes)and diabetes categories other than GDM (e.g.: autoimmune), any apparent major disease or chronically treated with medication with known impact on glycemic control, in vitro fertili- zation, missing major clinical data, twin pregnancies or variables likely to be associated with population stratification (e.g.: non-European ancestry).
Clinical data collection
We collected all relevant clinical information that was used in the case- control study or quali- tative trait assessments, including the result of the OGTT, pre-pregnancy BMI, maternal age and the birth-weight percentiles [23].
Research design
As two different diagnostic GDM criteria were applied (IADPSG or the modified 99’ WHO) in the two participating countries the following protocol was employed for the analysis of geno- type associations: we first had to reclassify the entire dataset of the whole study population according to both criteria based on the OGTT results (FPG and 2 hour PG values) as a ‘diagno- sis stratification procedure’. This was possible since there was no medical intervention prior to the 75g OGTT and the test itself was performed in the standardized time-frame of gestation (24th-28thgestational week). Those individuals in whom the GDM diagnosis was established exclusively on the basis of the 60 min OGTT result remained in the GDM group in the ‘diag- nosis stratification procedure’. Such cases are rare (less than 5.7% according to the Hyperglyce- mia and Adverse Pregnancy Outcomes (HAPO) Study [24] and 13% in the participating Austrian study population). We have performed all binary analysis twice, first using the 99’
modified WHO criteria and second using the IADPSG criteria.
A set of 77 SNPs were selected based on the results of prior genome wide association studies (GWAS) on T2D, BMI, Insulin resistance (IR), Insulin secretion/ beta cell function, plasma glucose or serum insulin level traits. Functionally, the reported genes were suggested to be implicated in the incretin effect, beta-cell function or genesis, potassium channel function, amyloid formation, zinc transport, insulin resistance, obesity development, insulin-like growth factor (IGF) system, vessel formation, glucose homeostasis, circadian rhythm, neuronal regula- tion of appetite, energy balance or immunoregulation (S1 Table).
Subsequently we provided two numerically different odds ratios and p-values for each gene variants that were significantly associated with GDM according to the corresponding diagnos- tic system applied in the analysis.
Genomic DNA isolation and genotyping
Genomic DNA was isolated using a magnetic bead based robotized approach (Hamilton Robotics, Magna Starlet, Bonaduz, Switzerland) from EDTA-anticoagulated whole blood sam- ples obtained from cubital veins. Kompetitive Allele Specific PCR (KASP™) genotyping (FRET
[fluorescence resonant energy transfer] based assay) (LGC Genomics, Teddington, Middlesex, UK) was used for the bi-allelic discrimination of 77 SNPs. The overall call rate for all SNPs assessed exceeded the 97% and no discordant genotypes were identified in the control samples of which genomic DNA were isolated in two different runs and subsequently genotyped sepa- rately in duplicates for all SNPs. Results were presented using the SNP viewer software (version 1.99, Hoddesdon, UK) and genotype data were extracted for statistical analysis.
Statistical analysis
GDM as binary trait. All statistical analyses of this case-control study were carried out in a specially designed program in R-project language. We first analyzed associations between genotypes according to the 77 assessed SNPs and the diagnosis of gestational diabetes mellitus as a case-control study. As the diagnosis of GDM was originally established according to crite- ria (IADPSG or modified 99’ WHO) which was used in the center of the patient care provider, we first had to reclassify the entire dataset of the whole study population according to both cri- teria based on the OGTT results (FPG and 2 hour PG values) as a ‘diagnosis stratification pro- cedure’. Subsequently, we analyzed the data using the logistic regression method under both the dominant and the additive genetic models. We calculated odds ratio (OR), statistical power and p-value for every SNP and used the Benjamini-Hochberg p-correction method to minimize false discovery. ORs were reflective for the Effect Sizes in our case-control study for binary outcomes and were calculated to represent the effects of carrying the reported minor alleles under the dominant model or the effect of the minor allele under the additive genetic model (S2 Table). Subsequently minor allele frequencies were also calculated for each 77 SNPs assessed (S3 Table).
We adjusted our result to the maternal age and pre-pregnancy BMI (S2 Table, Panel A) as covariates in both models, provided that there were no published prior data or direct result in this analysis for the association between the assessed SNPs and pre-pregnancy BMI. If an asso- ciation between the SNP assessed and pre-pregnancy BMI was observed then only age was used as covariate in adjustment calculations.
Due to that an effect through the causative chain still can be a potential risk for disease development and that BMI-adjustment might possibly be important even if there is a signifi- cant SNP-BMI association we reported the p-values and ORs for each 77 SNPs association with GDM one adjusted for age (S2 Table, Panel B) and additionally adjusted for age and pre-pregnancy BMI also (S2 Table, Panel A). However the literature suggests to use the adjusted data by age and BMI as these are often neglected confounders and concludes that this approach results in a more accurate analysis compared to the direct use of unadjusted raw data [18]. Therefore—after exclusion of the causative chain for our most significant findings—we indicate these genetic association results adjusted by age and BMI. Deviations from the Hardy- Weinberg equilibrium in the genotype distributions were assessed for all SNPs using Chi Squared test (S4 Table). We used post-hoc analysis for power calculation. From the p value and statistical power we calculated the exact probability of the existing effect for each gene var- iant associated significantly with GDM.
Glycemic traits. In addition we performed analysis for the associations between geno- types according to 77 assessed SNPs and glycemic traits, such as the fasting and 2 hour plasma glucose levels at OGTT and pre-pregnancy BMI using linear regression both under the addi- tive and also under the dominant genetic models. Coefficient values were calculated for signifi- cantly associated SNPs in the glycemic trait analysis representing effect sizes both on the fasting and the 2-hour plasma glucose levels and expressed in mmol/L.
To further improve the applied statistics we also re-analyzed our data using a bootstrap resampling method for the linear regression to confirm results when the glycemic traits were analyzed. The bootstrap application was used due to that it is a statistically appropriate way to control and check the stability of the results.
All data were assessed according to the guidelines of STREGA which is an extension of the STrengthening the Reporting of OBservational studies in Epidemiology (STROBE) statement [22].
Clinical characteristics. Both the Shapiro—Wilks and the Kolmogorov—Smirnov tests were used to assess normality. Mann—Whitney U-test (MWU) was used to compare means and detect differences in case of nonparametric distributions, and 2-tailed t-test with indepen- dent variables was used when the distribution was normal. For this re-classified analysis of clinical data we have used Welch-test for comparisons between the countries as the standard deviation (SD) values were not known (and distributions of these parameters are usually asymptotic normal in literature). The, U‘ test was performed with two-sided counterhypothesis due to that we did not hypothesize difference between the two countries.
Results
Altogether 960 pregnant women were enrolled to the study. Dropouts due to insufficient sam- pling and withdrawn consent eventually reduced the final sample size to 820. Out of the 820, 303 would be diagnosed with GDM according to the 99’ modified WHO criteria and 287 according to the IADPSG criteria. The clinical characteristics of the pregnant population stud- ied are indicated inTable 1.
The clinical data (0 min and 120 min plasma glucose values at 75g OGTT, pre-pregnancy BMI, age) were also reclassified according both the IADPSG and m99‘ WHO criteria for the entire (joint Austrian and Hungarian) study population (S5 Table).
In addition to the differences in the plasma glucose values at OGTT significant differences were detected in pre-pregnancy BMI and age at delivery between the GDM and control popu- lations in both countries. We also found differences in the 0’ PG values (HUN>AT, 4.52mM vs. 4.38mM, p<0.05), weight gain during pregnancy in the controls (HUN>AT 13.80kg vs.
9.47kg, p<0.05) and in the 0’ PG (AT>HUN 5.14mM vs. 4.96mM, p<0.05) and 120’ PG (HUN>AT 8.72mM vs.7.38mM, p<0.05) values and age at delivery (HUN>AT 33.7 years vs.
32.04 years, p<0.05) between the GDM groups of the two countries. However differences in the clinical characteristics between Austria and Hungary are unlikely to affect the genetic study as the clinical characteristics were compared using the country designated diagnosis as grouping variable, in contrast to the genetic analysis, when we regrouped the study population based on the 75g OGTT results according to both GDM diagnostic criteria.
Associations found at significant or suggestive levels in the case-control analysis are indi- cated inTable 2. There was no significant deviation from the Hardy-Weinberg equilibrium (S4 Table) in the genotype distributions of SNPs with significant results.
GDM as binary trait
Association ofMTNR1Brs10830963 with GDM. The most significant findings were related to the rs10830963 polymorphism of the melatonin receptor 1B (MTNR1B): carrying a Gallele of the rs10830963 polymorphism of theMTNR1Bsignificantly increased the risk of developing GDM (Table 2) in our case-control study.
The associations of rs10830963 with GDM binary trait resulted in better significance (IADPSG / m99’WHO p: 7x10⁻⁴/6x10-3) and higher odds ratios (ORs: 1.84/1.64) under the dominant model compared to the additive model (p: 0.003/0.012, OR: 1.48/1.39, respectively)
after adjustment to maternal age and pre-pregnancy BMI covariates. This association remained significant under the dominant model, when adjusted p-values were further cor- rected using the Benjamini-Hochberg (B-H) method. Accordingly, minor allele frequencies (MAF) were higher in the GDM groups than in the control groups under each diagnostic crite- ria applied (IADPSG: 36% vs. 28%, m99’WHO: 36% vs. 28%; GDM vs. Control groups respec- tively,Table 2).
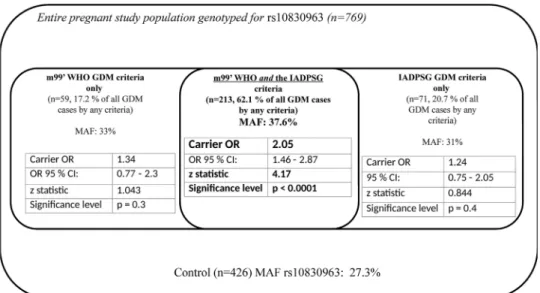
Carrying theGrisk allele of theMTNR1Brs10830963 in any form was associated with sub- stantially higher odds of disease development in the group of patients who could meet both the m99’ WHO and the IADPSG criteria (OR: 2.05, p<10−4, z statistic: 4.17) than in those who could be diagnosed with GDM according to only one of the two criteria (Fig 1).
Odds ratios were calculated under the dominant model. Higher OR values indicate the significance of genetic predisposition in those pregnant women who meet both m99’WHO/
IADPSG GDM diagnostic criteria compared to all the other participating pregnant individuals.
CDKAL1rs7754840 andGCKrs799884 risk polymorphisms in GDM. Significant asso- ciations were found with the intron variant (rs7754840) of the CDK5 regulatory subunit associated protein 1 like 1 (CDKAL1) gene and with the rs1799884 intron variant of the Gluco- kinase (GCK) gene after adjustment to maternal age and pre-pregnancy BMI covariates under the dominant model (OR rs7754840 IADPSG: 1.51, p = 0.016 and OR rs1799884 IADPSG / m99’WHO 1.4 / 1.56, p = 0.04/0.006). Results (ORs, MAFs and adjusted p-values) according to the different diagnostic criteria are indicated inTable 2.
Protective polymorphisms, including a novel association signal with GDM. The minor alleles of two common gene variants reduced the risk of developing GDM. A protec- tive common polymorphism was identified as the rs7578326 SNP in theLOC646736/IRS1 region (OR forGallele [IADPSG/m99’ WHO]: 0.62/0,60, p = 0.001/0.006) under the
Table 1. Clinical characteristics of the pregnant population studied.
75g CH OGTT plasma glucose values in GDM
group (mM)
75g CH OGTT plasma glucose values in Control group (mM)
Pre-pregnancy BMI (kg/m2)
Age at delivery (years)
Weight gain during pregnancy (kg)
HbA1c %6¼ (IFCC Unit- mmol/mol)
0’ 60’# 120’ 0’ 60’# 120’ GDM Control GDM Control GDM Control GDM
Austria Mean 5.14*˚ 9.68* 7.38*˚ 4.38*˚ 6.80* 5.42* 28.31* 23.40* 32.04+˚ 30.51* 9.68 9.47˚ 5.30 (34) n = 183/147
(Cntrl/GDM)
95%CI of the Difference (between GDM and Cntrl study
groups)
0.63–
0.87 2.47–
3.28 1.61–
2.30 0.63–
0.87 2.47–
3.28 1.61–
2.30
2.72–7.09 0.08–2.97 -1.63–2.04 95%CI
(GDM only):
5.21–5.38 (33–35)
Hungary Mean 4.96*˚ NA 8.72*˚ 4.52*˚ NA 5.45* 26.78* 23.32* 33.70*˚ 31.25* 8.72* 13.80*˚ 5.20 (33)
n = 408/195 (Cntrl/GDM)
95%CI of the Difference (between GDM and Cntrl study
groups)
0.34–
0.54
NA 3.06–
3.47 0.34–
0.54
NA 0.34–
0.54
2.55–4.36 1.54–3.36 -6.07–-4.07 95%CI
(GDM only):
5.10–5.30 (32–34) Significant differences were found between the GDM and the Control groups as follows:
*p<10−4;
+p<0.05 (t—test or MWU).
Significant differences found between the Hungarian and Austrian study populations
˚ p<0.05.
#60’ plasma glucose values at OGTT were only assessed in Austria.
6¼HbA1c values were only determined in patients with GDM, but not in the controls.
doi:10.1371/journal.pone.0169781.t001
Table2.Associationbetweenmaternalgenevariantsandgestationaldiabetesmellitus(GDM)usingboththeInternationalAssociationofDiabetesandPregnancyStudy Group(IADPSG)andthemodified99’WorldHealthOrganization(WHO)GDMdiagnosticcriteria. SNP— (major/ minorallele) Reported Gene(HGNC Symbol) SNPlocus (chr:base)˚
Functional class GenefunctionPrior GWAS Priorassn. studies MAFin GDMcases IADPSG/ m99’WHO MAFin Cntrl IADPSG/ m99’WHO MAFin 1000 Genomesin EU pIADPSG /m99’ WHO OR IADPSG/ m99’WHO Effectsize IADPSG/ m99’WHO ModelProbabi-lity ofexisting effect IADPSG/ m99’WHO
Statistical Power IADPSG/ m99’WHO rs10830963 (C/G)MTNR1B11: 92975544intronvariantEncodesoneoftwohigh affinityformsofareceptor formelatonin.Melatonin. mayregulateglucose metabolismbyaffecting circadianandfirstphase insulinsecretion.
GDMGDM0.36/0.360.28/0.280.290.0007a/ 0.0061.84/1.64 (95%CI: 1.54–2.21/ 1.38–1.97) 0.308/ 0.249D>99%/99%0.9/0.73 [11,14] FPG levels
[15] [25]T2D T2D[9] [26] rs7578326 (A/G)*LOC646736 /IRS1*2: 226155937lncRNA (RNAgene) variant
UnknownT2DIFGT2D MetS0.31/0.320.39/0.380.350.001a/ 0.0060.62/0.60 (95%CI: 0.46–0.67/ 0.51–0.73)
0.285/ 0.247D>99%/99%0.65/0.65 [27][28] rs1799884 (C/T)GCK7:44189469intronvariantGCK(Glucokinase (Hexokinase4))encodes anenzymethatcatalyzes theinitialstepinutilization ofglucosebythebeta-cell andliveratphysiological glucoseconcentration.
HbA1cGDM0.17/0.180.15/0.140.180.04/ 0.0061.4/1.56 (95%CI: 1.18–1.65/ 1.34–1.84)
0.173/ 0.229A93%/99%(0.51/0.7) [29][13] rs7754840 (G/C)CDKAL16:20661019intronvariantAmemberofthemethyl- thiotransferasefamily. Proteintranslation.insulin synthesis.Earlyphase insulinresponse.
GDMMeta- analysis T2D 0.33/0.320.30/0.310.320.016b/ NS1.51b/NS (95%CI: 1.26–1.79/ NA)
0.147/NRD97%/NA0.61/NA [11][32] T2D [26,30– 32] rs13266634 (C/T)**SLC30A8**8: 117172544intron variant. missense
Encodesazinctransporter involvedinthe accumulationofzincin intracellularvesicles.High levelonlyinthepancreas, particularlyinisletsof LangerhansinInsulin- secretingcells.
2TDReduced first-phase insulin releasein T2D offspring 0.25/0.240.30/0.300.280.05/0.020.74/0.71 (95%CI: 0.65–0.87/ 0.61–0.82)
0.188/ 0.220A88%/95%0.36/0.42 [32] HbA1c levels
[34] [27,33] Effectofminorallelesofthecorrespondingsinglenucleotidepolymorphismondiseasedevelopmentasoddsratios(OR). pvaluesindicatedareafteradjustmenttopre-pregnancybodymassindex(BMI)andagecovariates. Priorgenomewideassociationstudiesandreportedgenefunctionsandaresummarized D=dominantgeneticmodel A=additivegeneticmodel aSignificantafteradjustmenttoageandBMIandBenjamini-Hochbergcorrection. bAdjustmenttoageascovariateonly(duetosignificantassociationwiththepre-pregnancyBMI). *NovelsignificantgeneticassociationreportedinGDMdisease. **NovelsuggestivegeneticassociationreportedinGDMdisease. ˚ToindicatethechromosomalpositiontheNCBISNPdatabase(release:107.)wasused. doi:10.1371/journal.pone.0169781.t002
dominant model and adjusting to age and pre-pregnancy BMI. Carrying aTallele of rs13266634C/Tof theSLC30A8gene significantly reduced the risk of developing GDM under both diagnostic criteria under the additive model (OR [IADPSG/m99’ WHO]: 0.74/
0.71, p = 0.05/0.02) (Table 2).
A causative chain (when the association is not significant after age and BMI adjustments only after age adjustment and the SNP associated effect on GDM develops via BMI) might potentially be existing for a few gene variants (HNF1 homeobox B—HNF1B[TCF2]
-rs4430796, -rs7501939, clock circadian regulator—CLOCK-rs6832769,—“S2 Table”), how- ever it needs confirmation with larger sample sizes and we may not yet report these associa- tions as clinically meaningful causative chains due to the diminutive p-value differences after the two adjustments.
Association between MTNR1B, GCK, TCF7L2, SLC30A8, LOC646736/
IRS1 gene variants and glycemic traits
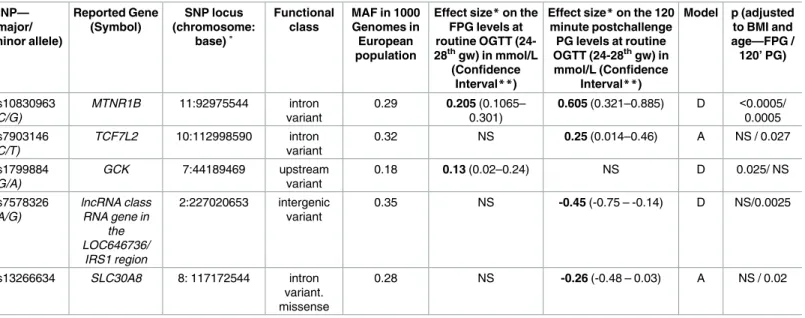
Fasting plasma glucose levels. MTNR1Brs10830963 was the most significantly associated SNP with the fasting plasma glucose levels (FPG) (mean effect size: 0.21 mmol/L increase, p<5x10⁻⁴). TheAallele of the rs1799884 polymorphism of theGCKgene was also significantly associated with increased FPG levels (mean effect size 0.13mmol/L increase, p = 0.025). All effect sizes are reported inTable 3after adjustment to pre-pregnancy BMI and age covariates.
Two hour plasma glucose levels at OGTT. TheMTNR1Brs10830963 was the most sig- nificantly associated SNP with the 2 hour PG levels (mean effect size 0.605 mmol/L increase, p = 5x10⁻⁴) after adjustments to pre-pregnancy BMI and age covariates and this remained significant even when the adjusted p-value was further corrected to reduce FDR using the Benjamini-Hochberg method (p = 0.044). In addition we found an association between the rs7903146 polymorphism of the transcription factor 7-like 2 (TCF7L2) gene and 2 hour PG values (mean effect size perTallele 0.25mmol/L increase, p = 0.027) after adjustment for pre- pregnancy BMI and age. The rs7578326 SNP in theLOC646736/IRS1region was associated with decreased (effect size: -0.45 mmol/L, p = 0.0025) 2 hour plasma glucose levels, such as the rs13266634 of theSLC30A8gene (effect size perTallele: -0.26mmol/L, p = 0.02) (Table 3).
Fig 1. MTNR1B rs10830963 (true causal gene variant, risk allele G) associated odds ratios of developing GDM by different diagnostic criteria.
doi:10.1371/journal.pone.0169781.g001
Pre-pregnancy body mass index
All assessed SNPs of the Melanocortin 4 receptor (MC4R, rs10871777, rs571312, rs17782313) were associated with higher pre-pregnancy BMI values at significant level after adjustment to age and using the Benjamini-Hochberg FDR correction method. The LDL receptor related protein 1B (LRP1B, rs2890652), Potassium voltage-gated channel subfamily J member 11 (KCNJ11, rs5219), CDK5 regulatory subunit associated protein 1 like 1 (CDKAL1, rs7754840) and Fat mass and obesity (FTO, rs11642841) gene polymorphisms were associated with pre- pregnancy BMI at suggestive levels (Table 4).
Discussion
We conducted a case-control genetic association study in a Caucasian population with 77 gene variants that were either earlier reported to be associated with the GDM or with T2D due to that GDM and T2D share similar genetic susceptibility background [18]. In addition a few other gene variants (SNPs) with potential contribution to an important metabolic condition were also assessed to detect associations with GDM or other related traits.
We found that theMTNR1Brs10830963/Gallele had the most robust association with GDM and also with glycemic traits, including both the FPG and the post-challenge (2 h) PG values at 75g OGTT.
In a recent meta-analysis on GDM genetics the authors concluded that pooled OR for the MTNR1Brs10830963 risk variant was lower in Asians (1.23) compared to Caucasians (1.49).
Table 3. Association of common gene variants with fasting and 120 minute plasma glucose values at oral glucose tolerance test (OGTT) in preg- nant population.
SNP—
(major/
minor allele)
Reported Gene (Symbol)
SNP locus (chromosome:
base) ˚
Functional class
MAF in 1000 Genomes in European population
Effect size*on the FPG levels at routine OGTT (24- 28thgw) in mmol/L
(Confidence Interval**)
Effect size*on the 120 minute postchallenge PG levels at routine OGTT (24-28thgw) in mmol/L (Confidence
Interval**)
Model p (adjusted to BMI and age—FPG / 120’ PG)
rs10830963 (C/G)
MTNR1B 11:92975544 intron variant
0.29 0.205 (0.1065–
0.301)
0.605 (0.321–0.885) D <0.0005/
0.0005 rs7903146
(C/T)
TCF7L2 10:112998590 intron variant
0.32 NS 0.25 (0.014–0.46) A NS / 0.027
rs1799884 (G/A)
GCK 7:44189469 upstream
variant
0.18 0.13 (0.02–0.24) NS D 0.025/ NS
rs7578326 (A/G)
lncRNA class RNA gene in
the LOC646736/
IRS1 region
2:227020653 intergenic variant
0.35 NS -0.45 (-0.75 – -0.14) D NS/0.0025
rs13266634 SLC30A8 8: 117172544 intron
variant.
missense
0.28 NS -0.26 (-0.48 – 0.03) A NS / 0.02
The p-values were adjusted to age and pre-pregnancy body mass index (BMI).
*Effect size of different single nucleotide polymorphisms (SNPs) on FPG/120min and post challenge PG values were calculated according to the genetic model applied.
Dominant model („D”): effect per carrying the reported minor allele.
Additive model („A”): effect per minor allele.
**Confidence intervals were calculated using bootstrap method.
˚ To indicate the chromosomal position the NCBI SNP database (release: 107.) was used.
doi:10.1371/journal.pone.0169781.t003
Authors found that only in studies which included subjects with mean pre-pregnancy BMI higher than 25 kg/m2, but not with lower mean pre-pregnancy BMI values theMTNR1B rs10830963 risk variant was significantly associated with GDM [18]. Furthermore, in a recent study with early intervention (diet, lifestyle intervention from the 13thgw) applied in high GDM risk individuals (BMI>30kg/m2) only non-carriers of the risk alleleGbenefited from the 3 months intervention assessed by PG values at routine OGTT suggesting thatMTNR1B rs10830963 variant could modify the efficacy of lifestyle interventions [35]. We found that the rs10830963MTNR1Bgene variant is characterized with ORs between 1.84 and 1.64 (dominant model), depending on the diagnostic criteria (IADPSG / m99’WHO) applied. Corroborating reports of higher OR values for rs10830963/G MTNR1Bfound in Caucasians compared to Asians are in accordance with these higher OR values we report here due to that our case cohort was with a mean pre pregnancy BMI higher than 25kg/m2(both in Austria and Hun- gary) [9,11,14,15,17,36,37].
Table 4. Association of common gene variants with pre-pregnancy body mass index.
SNP—(major/
minor allele)
Reported Gene (Symbol)
SNP locus (chromosome:
base) ˚
Gene function Functional
class
MAF in 1000 Genomes in European population
Genetic model
Effect size
p (adjusted
to age)
rs10871777 (A/G) MC4R 18:60184530 Membrane-bound receptor and member of the melanocortin receptor family. Defects in this gene are a cause of autosomal
dominant obesity.
intergenic variant
0.25 A 1.083 0.0019
rs571312 (C/A) MC4R 18:60172536 intron variant 0.24 A 1.123 0.0019
rs17782313 (T/C) MC4R 18:60183864 intergenic
variant
0.24 A 1.103 0.0018
rs2890652 (T/C) LRP1B 2:142202362 Cell surface proteins that bind and internalize ligands in the process of receptor-mediated
endocytosis.
intergenic variant
0.17 A -1.125 0.006
rs5215 (T/C) KCNJ11 11:17387083 Inward-rectifier type potassium channel. Associated with the
sulfonylurea receptor SUR.
Mutations in this gene are a cause of different types of
diabetes.
missense, nc transcript
variant
0.35 A 0.604 0.048
rs5219 (C/T) KCNJ11 11:17388025 missense, nc
transcript variant
0.35 A 0.696 0.022
rs7754840 (G/C) CDKAL1 6:20661019 Member of the
methylthiotransferase family.
Gene function is unknown. Gene variants associated with susceptibility to type 2 diabetes.
intron variant 0.32 D 1.157 0.007
rs7756992 (A/G) CDKAL1 6:20679478 intron variant 0.28 D 0.923 0.033
rs4712526 (T/A) CDKAL1 6:20662804 intron variant 0.32 D 1.008 0.018
rs11642841 (C/A) FTO 16:53811575 Exact function is unknown.
Association with body mass index, obesity risk, and type 2
diabetes.
intron variant 0.41 A 0.529 0.07
MC4R: Melanocortin 4 Receptor
LRP1B Low Density Lipoprotein Receptor-Related Protein 1B
KCNJ11 Potassium Channel, Inwardly Rectifying Subfamily J, Member 11 CDKAL1:CDK5 Regulatory Subunit Associated Protein 1-Like 1
FTO: Fat Mass and Obesity-Associated Protein.
All p values were adjusted to age.
˚ To indicate the chromosomal position the NCBI SNP database (release: 107.) was used D = dominant genetic model
A = additive genetic model doi:10.1371/journal.pone.0169781.t004
Accordingly, although several studies found that the rs10830963MTNR1Bvariant was not associated or only in subgroups associated with fasting and 2 hour glycemic traits, we consis- tently found associations both with the fasting and post-challenge values with mean 0.21 and 0.61 mmol/L increases in PG levels at OGTT under the dominant model, respectively [11,12, 14,15].
Functionally it is important that theMTNR1Brs10830963 riskGallele is predicted to create a recognition motif that matches the consensus sequences of neuronal differentiation 1 (NEU- ROD1) and other transcription factors. This was suggested to be consistent with that the risk Gallele promotes islet MTNR1B expression [38] and the riskGallele also increases FOXA2- bound enhancer activity in islet- and liver-derived cells.
TheMTNR1Brs10830963 intron gene variant seems to be a credible causal gene variant which is the driving association signal in contrast to other candidate SNPs (i.e. rs10830962) that may be retrospectively interpreted as lead gene variants [11,38].
MTNR1Bgene encodes one of two high affinity forms of a receptor for melatonin, a pineal gland hormone that regulates glucose metabolism by affecting circadian insulin secretion.
MTNR1Bvariants were associated with FPG values [25] and defectiveMTNR1BG-protein-cou- pled receptor signaling on human beta cells decreased glucose sensitivity and impaired insulin secretion [39]. The rs10830963 was associated with impaired first-phase insulin secretion and decreased Homeostasis Model Assessment—Beta (HOMA-B) even in GDM populations [9,40].
In a GWAS performed using over 2 million (imputed) initial gene variants Korean authors reported the rs7754840 variant ofCDKAL1and also the rs10830963 variant ofMTNR1Bas risk polymorphisms in GDM [11]. In our study on a Caucasian population however,CDKAL1 rs7754840 gene variant was only associated with GDM at a suggestive level. In contrast, the minor,Gallele of the rs7578326 SNP in theLOC646736/IRS1region is first reported here to decrease the risk to develop GDM and to be associated with decreased fasting and 2 hour plasma glucose levels. This protective effect of the minor, G allele is in concordance with prior reports that identified the major, A allele as the risk allele for T2D in a large-scale association analysis [27]. TheIRS1gene is localized over 500kb downstream of theLOC646736genomic region harboring the rs7578326 SNP and the genomic distance of linkage is typically less than 200kb. TheLOC646736locus and its relation to insulin resistance was characterized and authors suggested clear genotype effects on insulin signaling in skeletal muscle, however did not argue for causality ofIRS1. Additional pathology might be possible, either via the transla- tion ofLOC646736transcripts, however due to the lack of putative protein expression identifi- cation in human tissues, it is possible that LOC646736 transcripts are linc (long intergenic non-coding) RNAs that alter insulin signal transduction by either cis or trans regulation [41].
These mechanisms may potentially explain the protective effect of the (minor,G) variant of the rs7578326 in theLOC646736region we first describe in association with GDM develop- ment and also with glycemic traits during pregnancy.
The other protective minor (T) variant identified in this analysis, the rs13266634 (C/T) affects the amino acid residue 325 at the C-terminal of the zinc transporter 8 (ZnT8,
SLC30A8), which influences zinc homeostasis. In line with prior [11] reports in Asian popula- tion our findings confirm the role of thisSLC30A8variant in Caucasian populations in GDM development. Susceptibility likely evolves via the altered regulation of zinc homeostasis and related changes in insulin production and beta cell function.
The other associations we found with glycemic traits such as the common rs1799884 pro- moter variant ofGCK(with increased FPG levels) and the rs7903146 variant of theTCF7L2 gene (with increased post-challenge PG levels) were reported in prior GDM genetic studies [13,42,43].
Regarding the overall architecture of genetic susceptibility of GDM, it should be recognized that many of the gene variants we report here (MTNR1B,CDKAL1,SLC30A8,TCF7L2and potentially exerts similar effect) were reported to be associated with a reduced first phase insu- lin secretion, while the second-phase insulin secretion remained intact [34,44–47]. In contrast to the above set of gene variants the rs7578326 SNP in theLOC646736/IRS 1region clearly affected insulin sensitivity in previous studies [28,41].
This genetic architecture of GDM predisposition might be especially relevant nowadays, when clinical risk factors, such as higher pre-pregnancy BMI and age [3,4] at pregnancy become more prevalent resulting in increased insulin resistance and a need for a compensatory increase in beta cell response and the latter might be substantially limited in genetically suscep- tible individuals.
According to our findings (Fig 1) the most robust association of the causalMTNR1Bvariant rs10830963, is more preponderant in those pregnant individuals who meet both the modified 99’ WHO and the IADPSG diagnostic criteria. In contrast it appears to have a more limited role in determining the odds of disease development in those who could be diagnosed as GDM only according to one of the above diagnostic recommendations, but not by the other. This observation, the “clustering of genetic risk” might points towards precision medicine. Individ- uals with a susceptible genetic background at risk for developing GDM could potentially bene- fit from earlier diagnosis and treatment than the currently applied general routine testing (OGTT between the 24-28th gestational week). On the other hand, those who might be diag- nosed only according to one of the diagnostic recommendations, the role of lifestyle modifica- tions, age at delivery and related epigenetics may be more substantial factors in determining the odds of disease development (Fig 1).
Genetic markers could possibly also have everyday clinical utility due to that the accuracy of methods predicting GDM and the identification of individuals who are at high risk of devel- oping GDM with pre-pregnancy tests are still inadequate. The sensitivity of clinical risk factor based GDM predictions (conventional risk factors: age, BMI, ethnicity, DM family history, obstetric history—or novel approaches: circulating adiponectin) remains lower than 70%
[48,49].
A limitation of our study is that the sample size allows only the identification of the most robust genetic associations with GDM development (i.e.: OR>1.4) or related traits and did not allow to detect other genetic susceptibility factors that may have a smaller, but still significant effects on disease development or glycemic traits. These data would need confirmation a in a well-powered replication follow-up study.
Supporting Information
S1 Table. List of the 77 SNPs assessed and their reported major function and disease / pathology association.
(PDF)
S2 Table. Panel—A. Odds Ratios and Standardized Effect Sizes for each gene variant (SNP) assessed in the study after adjustment by age and BMI. Data are presented for the two GDM diagnostic criterion (m’99 WHO and IADPSG) systems applied in the study both under the dominant and the additive genetic models. The SNPs identified in this study with GDM as a binary trait are indicated in bold. (See alsoTable 2for details). Panel—B Odds Ratios and Standardized Effect Sizes for each gene variant (SNP) assessed in the Study.
Data are presented for the two GDM diagnostic criterion (m’99 WHO and IADPSG) systems applied in the study both under the dominant and the additive genetic models and adjusted by
age only.
(PDF)
S3 Table. Minor Allele Frequencies (MAF) in the case-control study populations according to the two GDM diagnostic criteria applied and in the European general population.
(PDF)
S4 Table. Chi Squared test results for the assessment of the deviation from the Hardy- Weinberg Equilibrium (HWE) genotype distributions.
(PDF)
S5 Table. The re-calculated mean clinical data of the Austrian and Hungarian pregnant populations.
(PDF)
Acknowledgments
The authors thank Dr. Andra´s Zemple´ni and Dr. Tama´s Pro¨hle from the Department of Prob- ability Theory and Statistics, Eo¨tvo¨s Lora´nd University, Budapest, Hungary for their guidance, help and contribution to the statistical analysis of data. We are also grateful for Andrew Symons, Ph.D. for English language editing.
Author Contributions
Conceptualization: GF KR AS AK-W.
Data curation: GF.
Formal analysis: GF KR AS AK-W ZA OH JH A´ N.
Funding acquisition: GF KR AS AK-W.
Investigation: GF KR AS AK-W ZA OH JH DB-T ISz A´ N FK ZsK.
Methodology: GF KR AS AK-W ZsK.
Project administration: GF AK-W.
Resources: GF KR AS AK-W.
Software: LN.
Supervision: GF AS AK-W JR.
Validation: GF KR.
Visualization: GF A´ N.
Writing – original draft: GF KR JH AS AK-W.
Writing – review & editing: GF KR JH AS AK-W ZA ISz A´ N ZsK LN.
References
1. Buckley BS, Harreiter J, Damm P, Corcoy R, Chico A, Simmons D, et al. Gestational diabetes mellitus in Europe: prevalence, current screening practice and barriers to screening. A review. Diabet Med.
2012; 29(7):844–54. doi:10.1111/j.1464-5491.2011.03541.xPMID:22150506
2. Kun A., Tornoczky J., Sudar Z., Kerenyi Z., Tabak A.G.. Pregnancy outcomes of women with untreated GDM (according to the WHO 2013 diagnostic criteria). Diabetologia. 2015; 58 (Suppl 1):S74.
3. Chu SY, Callaghan WM, Kim SY, Schmid CH, Lau J, England LJ, et al. Maternal obesity and risk of ges- tational diabetes mellitus. Diabetes Care. 2007; 30(8):2070–6. doi:10.2337/dc06-2559aPMID:
17416786
4. Ferrara A. Increasing prevalence of gestational diabetes mellitus: a public health perspective. Diabetes Care. 2007; 30 Suppl 2:S141–6.
5. Williams MA, Qiu C, Dempsey JC, Luthy DA. Familial aggregation of type 2 diabetes and chronic hyper- tension in women with gestational diabetes mellitus. J Reprod Med. 2003; 48(12):955–62. PMID:
14738023
6. Saisho Y, Miyakoshi K, Tanaka M, Shimada A, Ikenoue S, Kadohira I, et al. Beta cell dysfunction and its clinical significance in gestational diabetes. Endocr J. 2010; 57(11):973–80. PMID:20847480
7. Kautzky-Willer A, Prager R, Waldhausl W, Pacini G, Thomaseth K, Wagner OF, et al. Pronounced insu- lin resistance and inadequate beta-cell secretion characterize lean gestational diabetes during and after pregnancy. Diabetes Care. 1997; 20(11):1717–23. PMID:9353615
8. Poulsen P, Levin K, Petersen I, Christensen K, Beck-Nielsen H, Vaag A. Heritability of insulin secretion, peripheral and hepatic insulin action, and intracellular glucose partitioning in young and old Danish twins. Diabetes. 2005; 54(1):275–83. PMID:15616039
9. Huopio H, Cederberg H, Vangipurapu J, Hakkarainen H, Paakkonen M, Kuulasmaa T, et al. Association of risk variants for type 2 diabetes and hyperglycemia with gestational diabetes. Eur J Endocrinol. 2013;
169(3):291–7. doi:10.1530/EJE-13-0286PMID:23761423
10. Lauenborg J, Grarup N, Damm P, Borch-Johnsen K, Jorgensen T, Pedersen O, et al. Common type 2 diabetes risk gene variants associate with gestational diabetes. J Clin Endocrinol Metab. 2009; 94 (1):145–50. doi:10.1210/jc.2008-1336PMID:18984664
11. Kwak SH, Kim S-H, Cho YM, Go MJ, Cho YS, Choi SH, et al. A Genome-Wide Association Study of Gestational Diabetes Mellitus in Korean Women. Diabetes. 2012; 61(2):531–41. doi:10.2337/db11- 1034PMID:22233651
12. Cho YM, Kim TH, Lim S, Choi SH, Shin HD, Lee HK, et al. Type 2 diabetes-associated genetic variants discovered in the recent genome-wide association studies are related to gestational diabetes mellitus in the Korean population. Diabetologia. 2009; 52(2):253–61. doi:10.1007/s00125-008-1196-4PMID:
19002430
13. Freathy RM, Hayes MG, Urbanek M, Lowe LP, Lee H, Ackerman C, et al. Hyperglycemia and Adverse Pregnancy Outcome (HAPO) study: common genetic variants in GCK and TCF7L2 are associated with fasting and postchallenge glucose levels in pregnancy and with the new consensus definition of gesta- tional diabetes mellitus from the International Association of Diabetes and Pregnancy Study Groups.
Diabetes. 2010; 59(10):2682–9. doi:10.2337/db10-0177PMID:20682688
14. Liao S, Liu Y, Tan Y, Gan L, Mei J, Song W, et al. Association of genetic variants of melatonin receptor 1B with gestational plasma glucose level and risk of glucose intolerance in pregnant Chinese women.
PLoS One. 2012; 7(7):e40113. doi:10.1371/journal.pone.0040113PMID:22768333
15. Vejrazkova D, Lukasova P, Vankova M, Vcelak J, Bradnova O, Cirmanova V, et al. MTNR1B Genetic Variability Is Associated with Gestational Diabetes in Czech Women. Int J Endocrinol. 2014;
2014:508923. doi:10.1155/2014/508923PMID:25132852
16. Robitaille J, Grant AM. The genetics of gestational diabetes mellitus: evidence for relationship with type 2 diabetes mellitus. Genetics in medicine: official journal of the American College of Medical Genetics.
2008; 10(4):240–50.
17. Mao H, Li Q, Gao S. Meta-analysis of the relationship between common type 2 diabetes risk gene vari- ants with gestational diabetes mellitus. PloS one. 2012; 7(9):e45882. doi:10.1371/journal.pone.
0045882PMID:23029294
18. Wu L, Cui L, Tam WH, Ma RC, Wang CC. Genetic variants associated with gestational diabetes melli- tus: a meta-analysis and subgroup analysis. Sci Rep. 2016; 6:30539. doi:10.1038/srep30539PMID:
27468700
19. Prasad RB, Groop L. Genetics of type 2 diabetes-pitfalls and possibilities. Genes. 2015; 6(1):87–123.
doi:10.3390/genes6010087PMID:25774817
20. WHO. Definition, Diagnosis and Classification of Diabetes Mellitus and its Complications. Part 1: Diag- nosis and Classification of Diabetes Mellitus. WHO/NCD/NCS/992 ed.
21. International Association of Diabetes, Pregnancy Study Groups Consensus P, Metzger BE, Gabbe SG, Persson B, Buchanan TA, et al. International association of diabetes and pregnancy study groups rec- ommendations on the diagnosis and classification of hyperglycemia in pregnancy. Diabetes Care.
2010; 33(3):676–82. doi:10.2337/dc09-1848PMID:20190296
22. Little J, Higgins JP, Ioannidis JP, Moher D, Gagnon F, von Elm E, et al. Strengthening the reporting of genetic association studies (STREGA): an extension of the strengthening the reporting of observational