using a reference testbed building
Mohammad Reza Ganjali Bonjar
1, Krist of Roland Horv ath
1, B alint Baranyai
2,3and Istv an Kistelegdi
2,3p1Marcel Breuer Doctoral School, Department of Building Constructions and Energy Design, Institute of Architecture, Faculty of Engineering and Information Technology, University of Pecs,
Boszorkanyut 2, H-7624 Pecs, Hungary
2Department of Building Constructions and Energy Design, Institute of Architecture, Faculty of Engineering and Information Technology, University of Pecs, Boszorkanyut 2, H-7624 Pecs, Hungary
3Energia Design Building Technology Research Group, Szentagothai Research Centre, University of Pecs, Ifjusagutja 20, H-7624 Pecs, Hungary
Received: February 27, 2020 • Revised manuscript received: July 23, 2020 • Accepted: September 14, 2020 Published online: April 1, 2021
ABSTRACT
The purpose of this research is the application of a passive design strategy for office buildings, the wall- window-ratio optimization under moderate climate. A simplified thermal and lighting simulation model of an office research building served as reference testbed for thermal comfort, daylight factor and illuminance as well as heating, cooling and lighting energy demand assessment. These six performance types of similarly oriented room groups are evaluated via a self-developed weighting process to determine the orientation dependent optimal wall-window-ratio of all room groups. This multi objective optimization applies in a broad range of office buildings under moderate climate.
KEYWORDS
office, envelope fenestration ratio, simulation, energy, thermal comfort, visual comfort
1. INTRODUCTION
The worldwide largest share on public building sector comprises office buildings with high energy demand and, as a concomitant phenomenon, indoor visual and thermal discomfort.
The cooling demand is decisively high; due to offices’characteristic it uses high internal heat loads. This effect has further increased by the common high Wall-Window-Ratio (WWR) of the building envelope (e.g., widespread of fully glazed facades). Moreover, the incompetently design glazed façades often inflict summer overheating and glare effect in today’s Information Technology (IT) governed office indoor environment.
The present problem is an investigation domain of several simulation supported studies, aiming to improve comfort and energy performance with help of the active services systems and/or with application of passive, architectural design strategies. Diverse energy-refur- bishment measures and policy evaluations are carried out in the building envelope, struc- tures, mass services systems [1, 2] and measurement aided natural ventilation strategies.
Building envelope investigations concentrate on fenestration WWR, geometry, orientation and form ratio [3–5], thermal insulation and thermal performance of glazing [6], transparent insulated facades [7].“Hybrid optimization”, meaning combined active and passive strategies achieve improvements deal with Void Insulation Panels (VIPs), windows with adaptive long wave reflectance and Light Emitting Diode (LED) systems, energy-retrofitting audits based window replacement, thermal insulation and shading installation, as well as renewal of the heat generating central system. Further studies couple thermal mass, under-floor heating,
Pollack Periodica • An International Journal for Engineering and Information Sciences
16 (2021) 2, 124–129
DOI:
10.1556/606.2020.00212
© 2020 The Author(s)
ORIGINAL RESEARCH PAPER
pCorresponding author.
E-mail:kistelegdisoma@mik.pte.hu
heat pump and natural ventilation using measurement based model validation, or high-performance glazing with low Solar Heat Gain Coefficient (SHGC) and high light trans- mission (τ-value) with efficiencies of Heating, Ventilation and Air Conditioning (HVAC) systems and control algo- rithms of the automations system [8, 9].
In a multi-stage research program introduced in a pre- vious study, a typical, renewable energy utilizing European office and laboratory building serves as a test reference for optimization purposes. A simplified lighting and thermal simulation model of the Szentagothai Research Centre (SRC) building was created. Current paper delivers a comprehensive study about experiments of diverse WWR strategies in the façades by assessing the thermal and daylight comfort performance and heating, cooling as well as lighting energy demand. Through a weighted evaluation, an optimum WWR was proposed in each alternating oriented facades. The sensitivity analysis results will be well applicable in generic office building design as well, since use, size, structures, and HVAC systems are of a general nature.
2. WWR MODEL EXPERIMENTS
The SRC reference building with over 7,000 m2 net floor space is an ensemble of 4 different building parts:“Cube A” serves as administration and education unit,“Cube B and C” are labs and“Building K”is a 300 person auditorium. The
“audiomax”is not subject of the actual study, since it has no windows due to its functionality. The building was modeled in a lighting and thermal simulation framework (IDA ICE 4.8) [10] with all relevant geometries, structures, HVAC systems and internal use and equipment. Due to high level of complexity, the climate zones and services systems were simplified. Thefirst part of the passive system optimization work package determined the facades’ most advantageous, orientation dependent WWR.
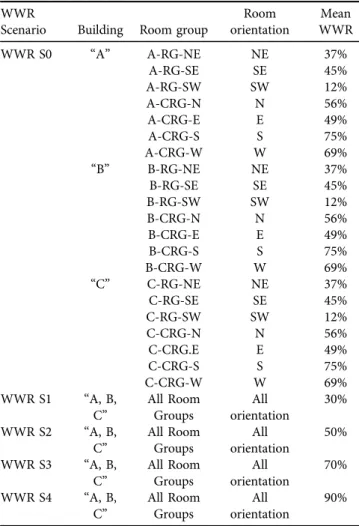
The simulation model was elaborated in a former study, consisting of 30 climate zones in“Cube A”, 49 thermal blocks in“Cube B”and 71 rooms in“Cube C”. All HVAC systems are modeled identically to the calibrated model’s systems, except the lighting system’s operation. While in the real building (and in the validated model) lighting is manually controlled, a daylight illumination control maintains the lighting dimming and on/off-switch automation. The 3D- climate model includes the WWR distribution of the present state, representing approx. 25% glazing ratio with exception of the main entrance façade in“Cube A”, a fully glazed climate façade for experimental purposes.Figure 1shows the 30 and 90% WWR versions of the simulation model. 4 different WWR Scenarios (WWR S) were proposed to the buildings’
diversely oriented facades in order to assess a comprehensive result database with all relevant WWR size-steps. Table 1 presents the existing WWR scenario (WWR, S0) by creating room groups of spaces with 1 external wall with window (1 orientation) assigned as A-Room Group (A-RG) (Room in
“Cube A” for instance) and spaces with 2 external wall including windows (2 orientation) assigned as A-Corner
Room Group (A-CRG) (e.g. Corner-Room in“Cube A”). The further, assessment-scenarios (WWR S1 - WWR S4) calculate comfort and energy performance of successively growing 30, 50, 70, and 90% WWR of the room groups. Accordingly Fig. 1also demonstrates the 3D-simulation models with the different WWR S1–WWR S4 scenarios.
Figure 2gives an example of the evolved Room Groups (RGs) dependent on the diverse façade orientations in“Cube A”. All building geometries, structures, materials, HVAC system parameters and set-points were identically modeled to ensure theoretically same indoor comfort conditions.
Fig. 1.3D simulation models: 30% WWR (up); 90% WWR (down)
Table 1.Existing WWR scenario and façade WWR test cases WWR
Scenario Building Room group
Room orientation
Mean WWR
WWR S0 “A” A-RG-NE NE 37%
A-RG-SE SE 45%
A-RG-SW SW 12%
A-CRG-N N 56%
A-CRG-E E 49%
A-CRG-S S 75%
A-CRG-W W 69%
“B” B-RG-NE NE 37%
B-RG-SE SE 45%
B-RG-SW SW 12%
B-CRG-N N 56%
B-CRG-E E 49%
B-CRG-S S 75%
B-CRG-W W 69%
“C” C-RG-NE NE 37%
C-RG-SE SE 45%
C-RG-SW SW 12%
C-CRG-N N 56%
C-CRG.E E 49%
C-CRG-S S 75%
C-CRG-W W 69%
WWR S1 “A, B,
C” All Room
Groups
All orientation
30%
WWR S2 “A, B,
C” All Room
Groups
All orientation
50%
WWR S3 “A, B,
C” All Room
Groups
All orientation
70%
WWR S4 “A, B,
C” All Room
Groups
All orientation
90%
In this way, the services systems try to generate as precisely as possible the commanded comfort level with alternating energy requirements. However, some comfort results may differ as well (e.g., day-lighting, operative temperatures based on HVAC system limits), hence an evaluation should enable to find the most beneficial orientation dependent WWR in the performance combination of thermal and visual comforts, as well as heating, cooling and lighting energy consumption.
3. RESULTS AND DISCUSSION
The comfort results and the used energy demand perfor- mance of the room groups in the building sections are pre- sented inFigs 3–5.According to EN 15251 [11], the thermal comfort is assessed as the number of hours in the building (daytime with global illuminance) with Predicted Mean Vote (PMV), 0.5> PMV <þ0.5 (for normal expectations rec- ommended for new and renovated buildings) related to the total occupancy hours. The visual comfort is modeled under Comission Internationale d’Eclairage (CIE) overcast mixed sky conditions [12] to compare the respective netfloor space ratio with a Daylight Factor (DF) that satisfies DF>DT 5 2.76%, calculated with Eq. (1).Ev,d,medis the median external diffuse illuminance for different nations/capitals (Budapest, latitude 47.48 N, longitude 19.04). The indoor illuminance (E) under clear sky conditions is determined as the number of hours performingE> 500lx(the required level for office buildings by virtue of EN 12464-1, [13]) related to daylight daytime hours,
DT ¼Required illuminance
Ev;d;med ¼ 500lx
18100lx$100½% ¼2:76 %: (1) The used energy demand values comprise used heating and cooling energy (sensible only), as well as lighting per- formance in form of emitted heat by the artificial lighting system. All comfort and energy results are assessed space by space then cumulated in the according room groups.
In “Cube A” the lighting system operates successively approx. 35.56–59.65% less as the WWR gradually increases from WWR S1 to WWR S4, while heating demand increases by approx. 128.06–203.8% and cooling demand by approx.
228.91–649.3%. Reason for that is the amplification of winter losses by transmission and thermal bridges, further the growing summer solar load through the increasing WWR.
The reference model’s (WWR S0) room groups have smaller WWR than in WWR S2, thus heating demand is even approx. slightly lower than WWR S1, while cooling has settled at low volumes as well and lighting performs highest values.
Exceptionally, the room groups A-RG-South-Est (SE) and A- CRG-East (E) in the reference case possesses larger WWR than the next cases, hence WWR S0 has greater heating and cooling (in A-CRG-South (S) only cooling) and smaller lighting demand. Additionally, in A-CRG-S the increasing winter losses and summer gains balances each other, therefore the heating demand does not changes by growing WWR. A- CRG-North (N) and A-CRG-West (W) have approx. 5 times lower cooling demands than the remaining RG-s due to lower solar loads through north oriented facades. Best heating and cooling performance is achieved by WWR S1 (WWR 30%) due to lowest heat losses and gains, while the lighting opera- tion optimum is delivered by WWR S4 (WWR 90%) due to greatest solar irradiation penetration. In total, the reference WWR S0 possesses lowest heating (approx. 2.52% lower than WWR S1), medium cooling demand and second highest Fig. 2.Example of diverse oriented room groups of“Cube A”1st
floor (A-RG) with 1 external wall and window; as well as corner room groups (A-CRG) with 2 external wall and 2 windows
Fig. 3.Used energy demand and visual and thermal comfort of the Room Groups in“Cube A”
lighting performance (approx. 16.49%, slightly lower than WWR S1). This is due to the higher solar gains via large sized SE-oriented climate façade and the smaller WWR in the remaining facades, compared to WWR S1.
Similar lighting requirement decreasing (approx. 36.8–
61.17%) and heating requirement increasing (approx.
111.22–133.95%) as well as cooling growing (approx. 110.8– 139.2%) is obtained in“Cube B”s room groups due to WWR enlargement. In B-CRG-N, B-CRG-S and B-CRG-W the cooling demand is approx. 5 times lower than in the remaining RG-s, because the summer solar gains and the net floor space (only in B-CRG-S) are lower than in the other RG-s. Best heating and cooling demand is generated by WWR S1 (WWR 30%) due to lowest heat losses and loads, while the best lighting demand is delivered by WWR S4 (WWR 90%) due to greatest light penetration. Summing up, WWR S0 possesses lowest heating (approx. 17.81% lower than WWR S1), lowest cooling demand (slightly lower than WWR S1) and highest lighting performance (approx.
29.82% higher than WWR S1). Reason for that are lower solar gains and winter losses via smaller WWR in the facades as it is the case of WWR S1.
The growing WWR reduced the lighting by 35.68– 58.97%, heating by 115.26–153.73% and cooling by 124.74–
176.18% in“Cube C”. C-RG-SW consists of labs with high, 9-16 Air CHange (ACH) rate, causing greatest, over 2-times higher heating performance among the RG-s. C-CRG-E and C-DRG-S possess greater amount of solar exposed trans- parent envelope gaining greater solar heat from radiation.
This results factor 2.65 higher cooling demands in these RG- s. The minimum in heating and cooling demand is provided by WWR S1 (WWR 30%) and the best lighting demand is delivered by WWR S4 (WWR 90%) due to same physical background as in the neighbor building parts. In total, WWR S0 has lowest heating (approx. 14.05% lower than WWR S1), second lowest cooling demand (slightly higher than WWR S1) and greatest lighting requirement (approx.
50.78% higher than WWR S1). The lower solar loads and winter heat losses through smaller WWR as in WWR S1 are the main reasons for that.
The daylight factor distribution in “Cube A” is in accordance with the cooling profile and in contrast to the lighting graph, meaning that the greater the WWR the bigger the solar radiation penetration and as an effect the higher the space area with higher DF performance. By virtue of the same reason, the illuminance based daylight autonomy graph follows the DF and cooling profiles as Fig. 4.Used energy demand and visual and thermal comfort of the
Room Groups in“Cube B” Fig. 5.Used energy demand and visual and thermal comfort of the Room Groups in“Cube C”
well, with exception of A-RG-SouthWest (SW), since here the WWR S0 is larger than WWR S1. DF increases approx.
236.52–415.15% in the RG-s and E grows approx. 117.18–
169.04%. On the other side, the PMV results show analog trend to the lighting performance, as well as the opposite characteristic as of the heating profile, proving that the WWR and its heat balance is proportional to the thermal comfort property of the spaces. The PMV shrinks from 73 to 70% in the cases.
In “Cube B” DF and illuminance performance levels showed similar behavior to “Cube A” by increasing DF approx. 249.31–487.1% and illuminance by 138.65–151%.
The PMV result distribution demonstrates the contrary course to the heating demand distribution with minimal change.
In case of “Cube C”, DF and illuminance levels increased by 273.2–522.97% and 135–164.72% compared to Cube “B” respectively, with similar characteristic as in the previous building sections. The only exceptions are C- RG-NE and C-RG-SW, because the reference model has higher fenestration ratio. The PMV values show once again a contrary distribution to the heating demand results with slightly higher changes in the WWR scenarios (2.61–
4.86%).
4. MULTI OBJECTIVE OPTIMIZATION
However, after analyzing the simulated results, it is apparent that the lower the WWR the better energy per- formance is achieved, while in contrast, the higher the WWR the better visual comfort prevails in the investigated spaces. This paradox between energy performance and visual lighting comfort makes the detection of the optimal WWR model difficult. Therefore, an order creation was necessary to identify the orientation dependent WWR of the facades with the best comfort and energy performance.
Different weighting factors were elaborated for the 3 en- ergy and the 3 comfort performance results of the room groups, in order to create a multi objective optimization.
The PMV and illuminance performance were firstly weighted by setting them in relation to the respective oc- cupancy and daytime hours. The DF weighting coefficient is derived from the relation of the number of daytime hours and the overcast fraction of this time. The number of hours was calculated with help of a climate database (Meteonorm 7) [14]. The overcast hours were identified by calculating sky clearness («) based on the following equation, [15, 16]:
«¼
ðEedþEesÞ
Eed þ1:041Z3
1þ1:041Z3 ; (2)
where«determines the sky clearness,Zis the corresponds to
½-radians,Eedis the diffuse horizontal irradiance andEesis the direct normal irradiance. 8 intervals of«coefficient were defined by the range of clear sky R. Perez [16], dis- tinguishing between overcast (interval 1–2) and clear sky
clearness (7–8). The number of overcast hours (2,776 h) was divided by the sum of daytime duration (5,590 h of a year) resulting the weighting factor for DF 0.5. The 3 comfort performance became a 2nd weighting factor to determine each comfort type’s average value related to the total sum of all room groups’3 average comfort performance values. The energy results were weighted by setting their proportional total average values (interpreting it as 100%) in relation to the average heating, cooling and lighting values. The weighting factors are as follows: heating 53.72%, cooling:
38.38%, lighting: 7.9%.
Each case in the energy and comfort performance types received a score, for instance, in heating performance ranking the model with lowest heating demand scored 95 point, while the model with highest heating demand become 1 point and vice versa in comfort ranking scores. Thereafter, the heating weighting factor was applied to these heating performance scores. In this way, all energy and comfort performance types were weighted and the energy and comfort order were set. As a last step, the energy and comfort scores derived from the order were calculated, resulting in the final-score of the models. Models with highest energy and comfort total-score received 95 point, while the lowest ones become 1. The highest final-score represent the optimum WWR version in each room groups.
The best performing orientation dependent WWR was found in each room group in the building parts is shown in Fig. 6. In the 21 room groups, 30% WWR is only in 2 RG-s optimal, 50% WWR applies as well only for 2 RG-s, while 90% WWR represent optimum in 6 RG-s, followed by 70%
WWR for 7 RG-s.
5. CONCLUSION
This paper represents the first step of an optimization pro- cedure of office buildings applying passive design strategies.
Major focus is set on the building envelope, whereby an estimated validated simulation model via a monitored reference building’s energy measurement could be applied as reference testbed for fenestration ratio experiments. An orientation dependent optimum on WWR in the facades of the similarly oriented diver’s room groups could be achieved with help of thermal and lighting simulations, assessing Fig. 6.All room groups with respective scores evaluated in the multi objective weighting process, the cases represent the optimum
WWR in the various room groups
visual (illuminance and daylight factor) and thermal comfort (PMV) as well as heating, cooling and lighting energy de- mand. A self-developed weighting system could synthetize between the 6 different performance types of all room groups to determine the optimal WWR in dependency of orientation. This multi objective optimization will be further developed in next research stage, conducting considerations about further passive strategies (e.g. shading, thermals mass, natural ventilation), as well as implementing the intensive amplification of the building envelope’s opacity (until 0%
WWR) with integrated internal atria, as a new building concept for comfort and energy optimization.
REFERENCES
[1] A. Aksamija,“Regenerative design and adaptive reuse of existing commercial buildings for net-zero energy use”,Sustain. Cities and Soc., vol. 27, pp. 185‒195, 2016.
[2] E. Mozsonics and I. Kistelegdi, Jr,“Typological investigation of climate systems and design of multifunctional shading structures for the facade of the Szentagothai Research Center”, Pollack Periodica, vol. 10, no. 1, pp. 61–70, 2015.
[3] I. Susorova, M. Tabibzadeh, A. Rahman, H. L. Clack., and M.
Elnimeiri,“The effect of geometry factors on fenestration energy performance and energy savings in office buildings”,Energy and Buildings, vol. 57, pp. 6‒13, 2013.
[4] F. Goia,“Search for the optimal window-to-wall ratio in office buildings in different European climates and the implications on total energy saving potential”,Solar Energy, vol. 132, pp. 467‒492, 2016.
[5] F. Goia, M. Haase, and M. Perino,“Optimizing the configuration of a façade module for office buildings by means of integrated thermal and lighting simulations in a total energy perspective”, Appl. Energ., vol. 108, pp. 515‒527, 2013.
[6] M. Soleimani-Mohseni, G. Nair, and R. Hasselrot,“Energy simulation for a high-rise building using IDA ICE: Investigations in different climates”,Building Simulation, vol. 9, no. 6, pp. 629‒640, 2016.
[7] L. Wong, P. Eames, and S. Perera, “Energy simulations of a transparent insulated office façade retrofit in London, UK”,Smart and Sustain. Built Environ., vol. 1, no. 3, pp. 253‒276, 2012.
[8] G. K}ovari and I. Kistelegdi, Jr,“Optimized building automation and control for the improvement of energy efficiency and climate comfort of office buildings”,Pollack Periodica, vol. 10, no. 1, pp.
71–82, 2015.
[9] R. Andarini,“The role of building thermal simulation for energy efficient building design”, Energ. Proced., vol. 47, pp. 217‒226, 2014.
[10]EQUA-IDA ICE Simulation Software. [Online]. Available: www.
equa.se/en/ida-ice. Accessed: February 26, 2020.
[11]EN 15251:2007, Indoor Environmental Input Parameters for Design and Assessment of Energy Performance of Buildings Addressing Indoor Air Quality, Thermal Environment, Lighting and Acoustics. Brussels: CEN, 2007.
[12]ISO 15469:2004 (E)/CIE S 011/E:2003, CIE S003:1996, CIE Stan- dard overcast sky and clear sky. [Online]. Available:http://www.
cie.co.at/publications/cie-standard-overcast-sky-and-clear-sky.
Accessed: February 26, 2020.
[13]EN 12464-1:2002, Lumen Light Pro, Light and Lighting - Lighting of Work Places–Part 1: Indoor Workplaces. Brussels: CEN, 2002.
[14]Meteonorm 7. [Online]. Available: https://meteonorm.com/en/.
Accessed: March 19, 2020.
[15] M. B. Piderit, C. Cauwerts, and M. Diaz, “Definition of the CIE standard skies and application of high dynamic range imaging technique to characterize the spatial distribution of daylight in Chile”,J. Counstruct., 2014, vol. 13, no. 2, pp. 22‒ 30, 2014.
[16] R. Perez, R. Seals, and J. Michalsky,“All-weather model for sky luminance distribution - preliminary configuration and valida- tion”,Solar Energy, vol. 50, no. 3, pp. 235‒245, 1993.
Open Access. This is an open-access article distributed under the terms of the Creative Commons Attribution 4.0 International License (https://creativecommons.org/
licenses/by/4.0/), which permits unrestricted use, distribution, and reproduction in any medium, provided the original author and source are credited, a link to the CC License is provided, and changes–if any–are indicated. (SID_1)