DOI: 10.1556/606.2019.14.3.13 Vol. 14, No. 3, pp. 131–140 (2019) www.akademiai.com
WATER BODY EFFECT ON MICROCLIMATE IN SUMMERTIME: A CASE STUDY FROM PÉCS
1 Mohammad S. ALBDOUR*, 2 Balint BARANYAI
1 Marcel Breuer Doctoral School, Faculty of Engineering and Information Technology University of Pécs, Boszorkany u. 2, 7624 Pécs, Hungary, e-mail: albdour_m@yahoo.com
2 Department of Building Structures and Energy Design, Institute of Architecture Faculty of Engineering and Information Technology, Boszorkány u. 2 and János Szentágothai Research Center, Ifjúság u. 20, University of Pécs
H-7624 Pécs, Hungary, e-mail: balint.baranyai@mik.pte.hu Received 2 January 2019; accepted 21 March 2019
Abstract: The relationship between water body (fountains) scale and climate parameters like wind speed, air temperature, relative humidity, as well as thermal comfort index was modeled and analyzed via Envi-met code. Taking the water impact and factors analysis as a research object, the factors mainly discussed in this research are square area to water-body area ratio and the location of the water element. However, the computational fluid dynamics simulations were conducted on the following scenarios: 3% (original base case), 6%, and 9% of the total square’s area, then the outputs of the two simulation results were compared to the original base case. The results revealed that water scale has a slight effect on the micro-climate of the built environment in the summertime in moderately warm-wet climate zone. However, it is beneficial to adjust temperature and humidity in public spaces of central European cities. Nonetheless, the main aim of this paper is to quantitatively investigate the impact of the water bodies on the urban weather parameters and human thermal comfort under the influence of different scale ratios in Pecs- Hungary.
Keywords: Water body, Microclimate, Summertime, Numerical tool
1. Introduction
The energy demand of the built environment is almost 50% of the total energy demand of a national economy [1]. Water bodies have the ability to adjust the surrounding microclimate. The temperature mitigating capacity of water bodies in an urban environment can potentially reduce energy consumption, increase outdoor
* Corresponding Author
thermal comfort and mitigate the Urban Heat Island (UHI) effect [2]. X. Sihan conducted studies on the water effects of China’s traditional Lingnan garden and found that water can effectively adjust the microclimate environment of garden [3], [4]. H. Du taking Shanghai, for example, found that with a fixed area of the water body, the geometry of the water body should be relatively simple. However, the existing studies mainly focus on the climate effect of large-scale waters, the researches on the influence of small-scale water on the public spaces are rare [3], [5]. Moreover, Mirela Robitu found that greening and water have certain effect on the sunshine, temperature, humidity and wind speed of square in summer through the simulation analysis on two models which the difference is whether having the greening and water [3], [6].
1.1. Physical characteristic of water
The physical characteristics of the water include the area, depth, and shape. The expansion of the water area can increase the evaporation area of the water surface, and then increase the latent heat exchange between water and atmospheric environment [7].
1.2. Water body effects on urban microclimate
In order to control the urban temperature, architects and urban planners have employed water bodies in their design [8]. A study in Singapore found that air temperatures near water features, like ponds and water walls, were found cooler by up to 1.8°C as compared to surrounding built areas during sunny, clear days [9].
Furthermore, a study by Nishimura [10] shows that air temperatures above an urban water pond was 1°C to 2°C lower as compared to the surrounding park during the daytime and with the introduction of water sprays the reduction is increased. Although most of the researches have shown clear evidence of water bodies’ cooling effect, there is still a need to have a better understanding of the issues of thermal environments being influenced by the urban water bodies and its association with the microclimate.
Therefore, the effective use of urban water bodies could be established within limited spaces in urban areas needs more investigation.
2. Methodology
As a practicing architect, who have to deal with energy efficiency in real urban condition [1], the heterogeneity makes it difficult to assess the cooling benefits and to isolate the effects of the individual parameters (like shape, surface area, wind condition or solar radiation) under the complex physic process involved in the urban meteorology [2]. As an alternative method, an outdoor numerical model was conducted in the summertime at Széchenyi square in Pécs-Hungary. In this section, the methodology is presented.
2.1. Model description
The weather parameters namely (air temperature (TA), relative humidity (RH), Wind Speed (WS), Main Radiant Temperature (MRT), as well as the Predicted Mean
Vote (PMV) will be studied. However, in order to investigate the effects of water, different scales are simulated to evaluate the role of the water body in the case study’s area.
2.2. Numerical simulation and settings
Problem-solving matrix creates sustainable solutions without common and widely used technical systems is employed [11], with the aim to predict the microclimatic changes in an urban environment, the work started by creating a simulation model via ENVI-met and unified set parameters, the original case study being used in this work is the urban setting and water body of Pécs city center as shown in Fig. 1. In addition, the Original Base Case (OBC), two more scenarios were posited, in all cases, the wind direction is 5◦ (blowing North-East), Geographic coordinates of Pécs, Hungary’s Latitude: 46°04′59″ N, longitude: 18°13′59″ E, elevation above sea level is 153 m, and the total area is almost 11222 m2.
Fig. 1. ENVI-met original base case model
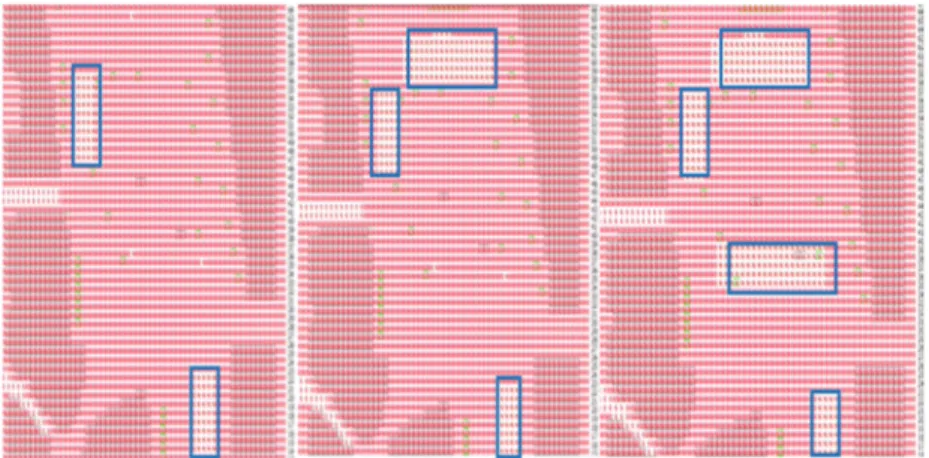
On one hand two independent water bodies in the public square had previously designed and constructed. However, they were modeled by the author for simulating water area occupancy, the case was named the original base case (the real situation in the square at the present). On the other hand, two more of water body scales are simulated and compared with each other as well as with the original bas case. The water area is divided into three occupies of 3%, 6%, 9%, in order to illustrate the effects of
water surface on the surrounding microclimate. Nonetheless, Fig. 2 shows the satellite image of the real scenario (original base case), in this case, water constitutes around 3%
of the total site’s area as it can be seen in Table I.
Fig. 2. The water bodies location of the case study’s site [12]
Table I
The water element analysis of the case study’s site (original case)
Water element number Area m2
1 169
2 120
Total 289 m2 (3%) of the total study area
In additional to the original case two more scenarios were modeled, which can be seen in Fig. 3. They are 6% and 9% water-square area ratio as it can be seen in two, three, and four rectangles. However, the water elements will be positioned in a way not to block or hinder the motion in and around the square with achieving the highest water body area ratio as shown in Fig. 3.
Fig. 3. The original case, first scenario and second scenario from left to right, respectively
3. Results and discussion
3.1. The effect of water body on air temperature and relative humidity
The simulation results of the air temperature and relative humidity on the original base case 3%, 6%, and 9% of the water-square area ratio are shown in Fig. 4 and discussed below:
• On average the air temperature on the 21st of July at 14:00 PM is 305 K, which means the temperature ranges from warm to hot;
• Moreover, the relative humidity is 34.5%, which falls within the comfort range in the summertime;
• It can be noticed from the mentioned figure that the air temperature over most of the spaces is constant or with little enhancement 0.3 K compared to original base case;
• The average relative humidity was found to increase with increasing the water element scale;
• Nine percent water-square ratio scenario has achieved the minimum temperature among the set of scenarios 304.5 K as well as the higher relative humidity 36.7%;
• It can be noticed from the mentioned figures that the air temperature over most of the spaces is constant or with little enhancement 0.3 K compared to original base case;
• The temperature of the water element is lower than the temperature of the surrounding built-up area by 0.6-1.5 K;
• Relatively large water has shown a high temperature impact close to their edges and in downwind areas;
• The average relative humidity was found to increase with increasing the water element scale;
• Evaporation from open water bodies may lower the temperature, but on the other hand also increases the humidity, which dampens the positive effect on thermal comfort.
It can be clearly seen from Fig. 4 that areas close to water body experienced a lower air temperature and higher relative humidity than other cases. However, the water element has a significant impact on TA and RH just within 1-2 meters distance from the water body. It can therefore be concluded that the evaporation cooling effect on water body is strongly impacted nearby spaces.
Furthermore, this research shows a very little thermal response due to the larger scale of the square when compared with the water scale.
Original (3%) 6% 9%
Fig. 4. The effect of water body current situation, 6%, and 9% water-square ratio on air temperature and relative humidity
3.2. The effect of water body on wind speed and mean radiant temperature
Three parameters of the water body were conducted and analyzed. However, Fig. 5 shows the average wind speed and mean radiant temperature in the cases after applying
X (m)
0 10 20 30 40 50
Y (m)
5 15 25 35 45 55 65 75 85 95 105
X (m)
0 10 20 30 40 50
Y (m)
5 15 25 35 45 55 65 75 85 95 105
X (m)
0 10 20 30 40 50
Y (m)
5 15 25 35 45 55 65 75 85 95 105
X (m)
0 10 20 30 40 50
Y (m)
5 15 25 35 45 55 65 75 85 95 105
X (m)
0 10 20 30 40 50
Y (m)
5 15 25 35 45 55 65 75 85 95 105
X (m)
0 10 20 30 40 50
Y (m)
5 15 25 35 45 55 65 75 85 95 105
Pot. Temperature
below 303.55 K 303.55 to 303.97 K 303.97 to 304.39 K 304.39 to 304.81 K 304.81 to 305.23 K 305.23 to 305.66 K 305.66 to 306.08 K 306.08 to 306.50 K 306.50 to 306.92 K above 306.92 K
Relative Humidity
below 30.30 % 30.30 to 31.27 % 31.27 to 32.25 % 32.25 to 33.22 % 33.22 to 34.20 % 34.20 to 35.17 % 35.17 to 36.15 % 36.15 to 37.13 % 37.13 to 38.10 % above 38.10 %
the proposed water scales to the selected square. In general, it can be seen from the results below that:
• The water body has no effect on increasing or decreasing the wind speed 1.4 m/s was seen in almost all scenarios;
• Water body has a significant impact on MRT, the improvement of (7 K) compared to the original base case was observed (Fig. 5);
• On average radiant temperature was found to decrease with increasing the water element scale;
• Areas close to water body experienced to lower mean radiant temperature than other cases of the public place. However, the water element has a significant impact on MRT just within 1-2 meters distance from the water body. It can therefore be concluded that the evaporation cooling effect on water bodies is strongly impacted nearby spaces.
Original (3%) 6% 9%
Fig. 5. The effect of water body current situation, 6%, and 9% water-square ratio on wind speed and mean radiant temperature
X (m)
0 10 20 30 40 50
Y (m)
5 15 25 35 45 55 65 75 85 95 105
X (m)
0 10 20 30 40 50
Y (m)
5 15 25 35 45 55 65 75 85 95 105
X (m)
0 10 20 30 40 50
Y (m)
5 15 25 35 45 55 65 75 85 95 105
Wind Speed
below 0.23 m/s 0.23 to 0.45 m/s 0.45 to 0.67 m/s 0.67 to 0.89 m/s 0.89 to 1.11 m/s 1.11 to 1.33 m/s 1.33 to 1.56 m/s 1.56 to 1.78 m/s 1.78 to 2.00 m/s above 2.00 m/s
Mean Radiant Temperature below 310.10 K 310.10 to 315.89 K 315.89 to 321.68 K 321.68 to 327.47 K 327.47 to 333.25 K 333.25 to 339.04 K 339.04 to 344.83 K 344.83 to 350.62 K 350.62 to 356.41 K above 356.41 K
X (m)
0 10 20 30 40 50
Y (m)
5 15 25 35 45 55 65 75 85 95 105
X (m)
0 10 20 30 40 50
Y (m)
5 15 25 35 45 55 65 75 85 95 105
X (m)
0 10 20 30 40 50
Y (m)
5 15 25 35 45 55 65 75 85 95 105
3.3. The effect of water body on predicated mean vote and CO2
Numerical simulation was used to analyze the water body effect on predicated mean vote and CO2 in the summertime. Nevertheless, results revealed that:
• The water body has only minor effect on increasing or decreasing the predicted mean vote and negligible impact on CO2 in this particular work. Moreover, water body has a modest effect on PMV, the enhancement of 0.4 when compared to the original base case was spotted (Fig. 6).
Original (3%) 6% 9%
Fig. 6. The effect of water body current situation, 6%, and 9% water-square ratio on PMV and CO2
4. Conclusion
Through the numerical simulation to analyze the water body’s effect on microclimate in summer, it can be concluded that:
X (m)
0 10 20 30 40 50
Y (m)
5 15 25 35 45 55 65 75 85 95 105
X (m)
0 10 20 30 40 50
Y (m)
5 15 25 35 45 55 65 75 85 95 105
CO2
below 356.15 ppm 356.15 to 356.73 ppm 356.73 to 357.31 ppm 357.31 to 357.90 ppm 357.90 to 358.48 ppm 358.48 to 359.06 ppm 359.06 to 359.65 ppm 359.65 to 360.23 ppm 360.23 to 360.82 ppm above 360.82 ppm
X (m)
0 10 20 30 40 50
Y (m)
5 15 25 35 45 55 65 75 85 95 105
X (m)
0 10 20 30 40 50
Y (m)
5 15 25 35 45 55 65 75 85 95 105
X (m)
0 10 20 30 40 50
Y (m)
5 15 25 35 45 55 65 75 85 95 105
PMV Value below 2.39 [??]
2.39 to 2.80 [??]
2.80 to 3.21 [??]
3.21 to 3.62 [??]
3.62 to 4.03 [??]
4.03 to 4.44 [??]
4.44 to 4.85 [??]
4.85 to 5.26 [??]
5.26 to 5.67 [??]
above 5.67 [??]
X (m)
0 10 20 30 40 50
Y (m)
5 15 25 35 45 55 65 75 85 95 105
• Water body has only a slight effect on increasing or decreasing the predicted mean vote and other weather parameters except on relative humidity and air temperature;
• The temperature of a water element is lower than the temperature of the surrounding built-up area by 0.6-1.5 K;
• The water element has a significant impact on TA and RH within 1-2 meters distance from the water body;
• Water body has a great effect on mean radiant temperature, the improvement of 7 K compared to the original base case was observed.
5. Recommendation for future study
• More investigations are needed in different climate zones especially in hot-dry regions;
• Further researches are required to study the large water bodies like (rivers and lakes) effects on microclimate in Central Europe.
Open Access statement
This is an open-access article distributed under the terms of the Creative Commons Attribution 4.0 International License (https://creativecommons.org/licenses/by/4.0/), which permits unrestricted use, distribution, and reproduction in any medium, provided the original author and source are credited, a link to the CC License is provided, and changes - if any - are indicated. (SID_1)
Reference
[1] Baranyai B., Kistelegdi I. Energy management monitoring and control of public buildings, Pollack Periodica, Vol. 9, No. 2, 2014, pp. 77–88.
[2] Syafii N. I., Ichinose M., Wong N. H., Kumakura E., Jusuf S. K., Chigusa K. Experimental Study on the Influence of urban water body on thermal environment at outdoor scale model, Procedia Engineering, Vol. 169, 2016, pp. 191–198.
[3] Jin H., Shao T., Zhang R. Effect of water body forms on microclimate of residential district, Energy Procedia, Vol. 134, 2017, pp. 256–265.
[4] XUE Si-han, WAnG Kun, XIAO Yi-qiang. A simulation research on the thermal environment around water body in the traditional Lingnan Garden Taking Yu Yin Shan Fang as an example, Landscape Architecture, No. 6, 2014, pp. 50‒53.
[5] Du H., Xuejun S., Hong J., Zenghui K., Zhibao W., Yongli C. Research on the cooling island effects of water body: A case study of Shanghai, China, Ecological Indicators, Vol. 67, 2016, pp. 31–38.
[6] Robitu M., Musy M., Inard C., Groleau D. Modeling the influence of vegetation and water pond on urban microclimate, Solar Energy, Vol. 80, No. 4, 2006, pp. 435–447.
[7] Zeng Z., Zhou X., Li L. The impact of water on microclimate in Lingnan Area, Procedia Engineering, Vol. 205, 2017, pp. 2034–2040.
[8] Shafaghat A., Manteghi G., Keyvanfar A., Lamit H. B. Saito K. Street geometry factors influence urban microclimate in tropical coastal cities: A review, Environmental and Climate Technologies, Vol. 17, No. 1, 2016, pp. 61–75.
[9] Syafii, N., M. Ichinose, E. Kumakura, K. Chigusa, S. Jusuf, and N. Wong. Enhancing the potential cooling benefits of urban water bodies, Journal of Environmental Design and Planning, Vol. 13, 2017, pp. 29‒40.
[10] Nishimura N., Nomura T., Iyota H., Kimoto S. Novel water facilities for creation of comfortable urban micrometeorology, Solar Energy, Vol. 64, No. 4-6, 1998, pp. 197–207.
[11] Kistelegdi I., Baranyai B. Dynamic simulations supported indoor climate and energy building modeling, International Journal of Engineering and Technology, Vol. 5, No. 2, 2013, pp. 181–186.
[12] Google Search, Google, www.google.com/maps/@46.0767199,18.2284531,320a,35y, 3.69h,0.48t/data=!3m1!1e3, (last visited 1 March 2019).

![Fig. 2. The water bodies location of the case study’s site [12]](https://thumb-eu.123doks.com/thumbv2/9dokorg/1063305.70208/4.892.283.685.263.691/fig-water-bodies-location-case-study-s-site.webp)