thermal comfort
Bal azs Cak o
1p, Dalma Lovig
2and Andr as Ózdi
31Department of Building Services and Building Engineering, Institute of Smart Technology and Engineering, Faculty of Engineering and Information Technology, University of Pecs, Boszorkany u.
2, H-7624, Pecs, Hungary
2Marcel Breuer Doctoral School, Faculty of Engineering and Information Technology, University of Pecs, Boszorkany u. 2, H-7624, Pecs, Hungary
3Faculty of Engineering and Information Technology, University of Pecs, Boszorkany u. 2, H-7624, Pecs, Hungary
Received: December 30, 2020 • Revised manuscript received: April 7, 2021 • Accepted: April 14, 2021 Published online: May 29, 2021
ABSTRACT
During the following research project, the effects of an electrically heated window on the thermal comfort parameters of permanently occupied spaces were examined. A thermal manikin and a Testo 400 comfort-meter were used for the tests. To characterize the space, the predicted mean vote and predicted percentage of dis-satisfied method was applied. The examination of the comfort indices took place in the vicinity of an electrically heated window glass. During the measurements the surface temperature of the glazing was changed, alongside the distance from the glazing at which the measuring instruments were set up. The project aimed to assess the results measured by the thermal manikin and assess the usability of heated window glazing, taking thermal comfort into account.
KEYWORDS
heated window glass, thermal glazing, thermal manikin, comfort theory
1. INTRODUCTION
The purpose of the measurements conducted at the University of Pecs, Faculty of Engi- neering and Information Technology was to investigate the effects of an electrically heated window on general thermal comfort factors. There are two methods for the thermal evalu- ation of enclosed spaces, in the form of laboratory and on-site measurements. In this case, based on the constraints of the heated window glass and the equipment used, it was given that the measurements would take place in the thermal engineering laboratory in the Department of Building Services and Building Engineering. Within the laboratory, inside a thermal chamber the assessment of the given comfort conditions were performed using a so called thermal manikin and an indoor air quality instrument manufactured by Testo. It can be stated that a thermal manikin, which is essentially a human sized, complex measuring system, complements live subject studies, based on existing literature and previous studies [1]. Other thermal comfort related measurements involving a manikin were performed at the Faculty of Engineering and Informatics at the University of Pecs many years before [2].
A thermal comfort test essentially means the categorization of an indoor space based on what the human bodies’ heat perception will be in that given enclosure. The human heat sensing is based on number factors. Furthermore, it is important to know the mechanism of action of these parameters. The degree of heat load in an interior space is also a determinant of human heat sensation [3]. Numerous studies and subjective evaluations have shown, which factors usually have a decisive influence on a person’s thermal comfort and well-being.
Four technically measurable parameters must be recorded during laboratory measurements.
Pollack Periodica • An International Journal for Engineering and Information Sciences
16 (2021) 3, 114–119
DOI:
10.1556/606.2021.00361
© 2021 The Author(s)
ORIGINAL RESEARCH PAPER
pCorresponding author.
E-mail:cako.balazs@mik.pte.hu
These include the air temperature of the room, its spatial and temporal distribution, the prevailing air velocity, the relative humidity and the mean radiant temperature of the boundary surfaces [3]. It is important to highlight the sig- nificance of proper indoor air quality, as people spend a great portion of their life in enclosed spaces. Ensuring that these values are within an acceptable range creates a comfortable living and working environment. More impor- tantly, it potentially prevents health related issues in the long run [4].
There are two additional, difficult to measure compo- nents that are necessary. These include the activity level of the occupants and the clothing worn by them. The activity level, as in Metabolic Equivalent of Task (MET) is the objective measure of the rate at which a person expends energy [5]. Thus, during the measurement process, the goal is to determine these parameters and to evaluate the given microclimate on the basis of the comfort indices calculated from the values. The basic idea therefore is to determine the comfort parameters effecting heat perception the most, and evaluates the given microclimate on the basis of the comfort indices calculated from these factors. Uniqueness of the project is that a 190 cm wide and 170 cm tall electrically heated glass surface was installed in the climate chamber, along with the fact that an uncommon measuring instru- ment, the aforementioned thermal manikin was at disposal.
2. MATERIALS AND METHODS
The thermal manikin used in the experiment was manu- factured by a Danish company specializing in producing research manikin systems, specifically for the analysis of human comfort. The model’s size and weight are equal to average adult males. Its body is divided into 22 individually controllable body parts. It is important to note that the thermal manikin is a model that can be used to study the dry heat exchange between humans and the environment. Based on literature, like the ASHRAE 55:2017 standard [6] and of course personal experiences, it is known that dry heat ex- change occurs through conduction, convection, and radia- tion. In technical practice, the process of heat transfer by conduction must be treated together with convective heat dissipation as heat exchange by conduction is relatively low.
With the manikin, this can be modeled over the entire body surface in all directions with the so-called“comfort mode”. Other modes allow a constant skin temperature to be set, a constant heat loss setting at which comfort indices can still be measured and the previously mentions comfort mode, which represents the human bodies heat dissipation the closest. A heating wire network is recessed in each of its distinct parts, which are independently regulated and the temperature of each body part can be pre-set if desired. The top layer of plastic is designed to represent human skin and perform a protective function. The structure of the model is fiberglass reinforced. It is formed with polyoxymethylene joints with favorable mechanical properties, allowing the
manikin to withstand continuous movement, dressing and undressing. Polyoxymethylene, also known as polyacetal, is a synthetic, so-called engineering plastic [7]. Figure 1 shows the manikin used in the project in a sitting position wearing typical summer clothing. The clothing items include a short sleeved, light shirt, socks and straight, light trousers.
Alongside the manikin a measuring instrument manu- factured by Testo was used that has the comfort level measuring functionality necessary. With a globe thermom- eter, indoor air quality sensor and directional air speed meter, the factors influencing human heat perception can be evaluated at any given point in space. These instruments are part of the Testo 400 comfort-meter kit. The parameters include air temperature, mean radiant temperature, relative humidity and air velocity [8].
The measuring instruments described are required to determine said parameters. Mean radiant temperature is measured with a globe thermometer. The globe thermom- eter is a copper sphere 150 mm in diameter, painted black on the outside, with the temperature sensor (type K thermo- couple) in the center. The globe thermometer shall be located at the point in the enclosure where the mean radiant temperature is to be determined. In the globe, an equilib- rium temperature is formed due to radiant heat exchange and partly convective heat exchange, which is called globe temperature [9].
Air temperature and relative humidity were measured with an indoor air quality meter. In addition to the dry air temperature, the perception of heat is also affected by the relative humidity of the air. The principle of operation is an accurate method based on the simultaneous measurement of dry and wet temperatures in a given air velocity with two Fig. 1.The thermal manikin in a sitting position within the thermal
chamber
thermometers, one dry and one humidified with water. In this case, the relative humidity is determined from the dif- ference between the two types of measured temperature (dry and wet), the so-called “psychrometric temperature differ- ence”[10].
A turbulence probe can be used to determine the air velocity. In this case a compact probe heats a wire that is cooled by the given air flow. The higher electrical current prevents or compensates for the cooling of the wire. Such an instrument can determine the degree of turbulence and the draught risk with high-precision, even at low air velocities.
The stand on which the listed measuring devices were mounted was set at a height of 0.6 m at a predetermined point in the measuring chamber. The dimensions of the chamber equal to 433.5 m. Its internal height, taking into account the ceiling cooling panels, is 2.9 m. The rear part of the chamber used for assembly was closed during the measurement, so the actual floor area was 12 m2. The other surfaces of the measuring chamber are also equipped with water-based surface heating or cooling and 10 cm of thermal insulation towards the environment. During the measure- ment, wall surfaces opposite the glass were operated in cooling mode to dissipate energy introduced by the heating glass.
The manikin was placed 2 m from the heated glass sur- face and then at 1 m, during the second series of measure- ments, specifically in a sitting position representing a calm state as it is in shown inFig. 2.
The comfort-meter was also placed in front of the heating surface. Unfortunately. the manufacturer of the electrically heated window did not specify all the details regarding the product, it is known however that three layers of glazing was used and the special coating allowing the heat production is located on the inner most layer of the struc- ture.
During the measurement, the activity level, which is a measure of a person’s metabolism, was a set value. The Basal Metabolic Rate (BMR) of a person at rest is 0.8 met, where 1 met558.2 W/m2 heat loss [11]. The clothing index also remained constant, which was approximately 0.06975 m2$8C/W. This is equivalent to summer clothing or 0.4–0.5 clo, where clo is a value that describes the degree of
insulation provided by an article of clothing, 1 clo50.155 m2K/W [12]. The clo value can be determined from tables provided by standards or with the help of a thermal manikin it is possible to calculate it for any given clothing item. This is realized byfirst operating the model in a nude setting, and using the insulating capabilities of the manikin’s skin as reference to then determine the actual clo value of clothing items, during a second series of measure- ments. The glass surface temperature was changed from 25 8C to 50 8C with the control unit provided by the manu- facturer.
In order to evaluate the measured values, it is important that the data recording takes place after the steady-state conditions have been reached. Accordingly, the measured intervals were narrowed to meet this condition, excluding interference at the start and end of the measurement.
The results of many live subject studies over the years resulted in an internationally accepted method for measuring the various comfort parameters at given points in space. This can be used to determine the expected state of thermal sensation of occupants. As with most research on thermal comfort, classifying these two comfort indices is a key point. These include the Predicted Mean Vote (PMV) and the Predicted Percentage of Dissatisfied (PPD). PMV aims to predict the mean value of votes of occupants on a seven-point thermal sensation scale. The level of satisfaction of the occupants in a space also has to be taken into account, to get a greater idea on how ideal thermal comfort can be achieved [13]. The goal is to determine these indicators by measurement under laboratory conditions and to observe the effect of the heating surface on these indices.
Seen in ASHRAE Standard 55:2017 the widely used Thermal Sensation Scale (TSC) is a seven-point scale that measures the warm and cool feeling a subject experiences [6]. Alternatively the Bedford thermal comfort scale is also a seven-point scale that measures the state of thermal sensa- tion a subject experiences in a given environment [14]. The scale recommended in the ASHRAE Standard 55:2017 and ISO 7730:2005 standards [5,6] is what we also use as a basis.
Table 1 shows the difference in terminology, when describing human heat sensation based on the aforemen- tioned scales and the range in which the PMV value can deviate.
It is important to note, that an indoor space is within the neutral zone when the PMV falls between 0.5 and þ0.5
Fig. 2.Measuring installation showing the manikin and the com- fort-meter in the vicinity of the electrically heated glazing
Table 1.The Bedford and the ASHRAE scale showing the range of [13]
Bedford scale ASHRAE scale
Much too warm 3 Hot 3
Too warm 2 Warm 2
Comfortably warm 1 Slightly warm 1
Comfortable 0 Neutral 0
Comfortably cool 1 Slightly cool 1
Too cool 2 Cool 2
Much too cool 3 Cold 3
according to ASHRAE Standard 55:2017. Therefore it is ideal for human occupancy A true or completely neutral zone is created at an average value of 0, which corresponds to the case where the result of the thermal equilibrium equation is exactly 0.
3. RESULTS AND DISCUSSION
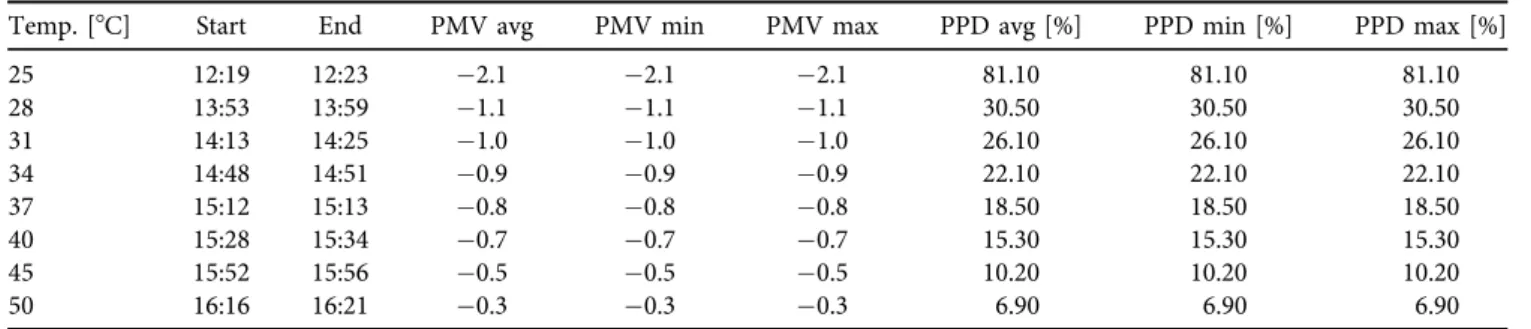
Table 2shows the PMV and PPD values recorded by the comfort-meter located 2 m from the heated glazing. The first row represents the pre-set surface temperature levels of the glazing at which the data logging took place in each interval.
Table 3shows the PMV and PPD values recorded by the thermal manikin located 2 m from the heated glazing.
Evidently the manikin was more inclined to show the de- viations in PPD percentages in each given time period, as opposed to the comfort meter that recorded data in a more stable pattern. Regarding human heat perception both in- struments valued the given environment within the chamber to be cool.
As it can be seen inFig. 3, using the glazing as a surface heating solution the PMV values began to climb and enter an acceptable zone.
The graph illustrates the evolution of the predicted mean vote indices, where the x axis represents the surface tem- perature of the glazing. Both, the manikin and the comfort- meter were set a distance of 2 m from the wall with the heated glass. Initially, the measuring chamber had an air temperature of approximately 238C, which was considered cool by both instruments. This is likely due to the fact that most surfaces within the chamber had a relatively cool
surface temperature. The water-based heating/cooling panel opposite the glass was operated in cooling mode.
By increasing the surface temperature of the heated glass, the predicted mean vote started to approach a range rep- resenting a more neutral state as opposed to the initial cool heat sensation. A truly neutral state corresponds to a PMV value of 0, meaning there is no heat exchange between the person and his environment. This could not be achieved with the initial setup. However, the acceptable range is un- derstood to be in the intervals of0.5 andþ0.5 PMV, which in the present case was realized at a surface temperature of 45 and 508C.
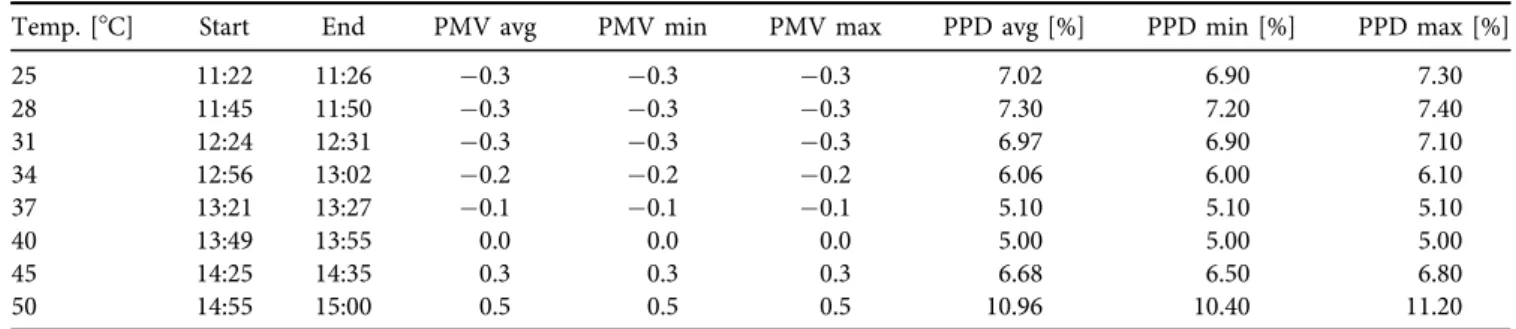
Table 4 and Table 5 show the PMV and PPD values recorded by the comfort-meter and the manikin, respec- tively, both located 1 m from the heated glazing.
It can be observed that in the case represented by the two tables above, the PPD value is within acceptable limits this
Table 2.Comfort-meter results 2 m from the glazing
Temp. [8C] Start End PMV avg PMV min PMV max PPD avg [%] PPD min [%] PPD max [%]
25 12:19 12:23 2.1 2.1 2.1 81.10 81.10 81.10
28 13:53 13:59 1.1 1.1 1.1 30.50 30.50 30.50
31 14:13 14:25 1.0 1.0 1.0 26.10 26.10 26.10
34 14:48 14:51 0.9 0.9 0.9 22.10 22.10 22.10
37 15:12 15:13 0.8 0.8 0.8 18.50 18.50 18.50
40 15:28 15:34 0.7 0.7 0.7 15.30 15.30 15.30
45 15:52 15:56 0.5 0.5 0.5 10.20 10.20 10.20
50 16:16 16:21 0.3 0.3 0.3 6.90 6.90 6.90
Table 3.Thermal manikin results 2 m from the glazing
Temp. [8C] Start End PMV avg PMV min PMV max PPD avg [%] PPD min [%] PPD max [%]
25 10:35 10:41 2.1 2.1 2.1 82.47 81.90 83.00
28 12:24 12:28 1.3 1.3 1.3 40.56 38.70 42.70
31 14:02 14:07 0.8 0.8 0.8 18.74 17.30 19.50
34 14:40 14:45 0.6 0.6 0.6 13.67 13.60 13.80
37 15:06 15:12 0.5 0.5 0.5 11.11 10.90 11.20
40 15:27 15:32 0.4 0.4 0.4 8.96 8.80 9.10
45 15:45 15:56 0.3 0.3 0.3 6.51 6.30 7.00
50 16:09 16:16 0.1 0.1 0.1 5.21 5.10 5.40
Fig. 3.Change of the PMV-values based on heated glass surface temperature ranging from 25 to 508C. Distance from glazing is 2 m
time. Presumably due to the fact that the heated window glass had a more pronounced effect on the due to its proximity. Meaning that for example at a surface tempera- ture of around 408C the percentage of occupants dissatisfied with the established environment is only around 5%. In reality, while individual votes regarding thermal comfort are never going to be uniform, they tend to convene at a given mean value and thus present a useful tool at assessing a given environment. Due to human nature and the ever changing microclimate of permanently occupied spaces the PPD value will always show at least 5% of dissatisfaction.
The results seen in Fig. 4 show greater alignment be- tween the two instruments, although at 40, 45 and 508C a difference is observed within acceptable limits.
Although both measuring instruments take the thermal insulation capacity of the garment worn by the manikin into
account during the calculation of the PMV values, it may cause slight differences. On the other hand, the manikin simulates the heat transport processes between man and his environment in a lifelike way and as a result, its heat release may have influenced the comfort-meter. In any case, due to the small standard deviation, it can be stated that the com- fort-meter and the thermal manikin is able to communicate acceptable and realistic data. Furthermore, in installation 2, where the measurement was evaluated at a distance of 1 m, the surface temperature of the heating glass required for a completely neutral heat sensation was achieved at 408C.
4. CONCLUSION
It can be seen that the PMV and PPD values calculated by the comfort meter and the manikin show similarity within an acceptable range. It is clear from the data that the pre- dicted mean vote can be significantly influenced by the heated glass surface and since the surface temperature can be adjusted with the control unit included in the window pane, each user can set the surface temperature to suit their own heat sensation. Similar heating solutions can also be ad- vantageous from a conservation point of view in order to prevent condensation and mold growth. As concluded during the measurements, relatively high surface tempera- ture levels were required to satisfy the occupants thermal comfort needs in a similar environment. This causes a conflict of interest, as surface heating solutions may be limited by causing local discomfort effects. Consequently, the surface temperature of the ceiling or wall surfaces cannot be raised indefinitely. Overall, based on the measurements, Table 4.Comfort-meter results 1 m from the glazing
Temp. [8C] Start End PMV avg PMV min PMV max PPD avg [%] PPD min [%] PPD max [%]
25 11:29 11:30 0.3 0.3 0.3 7.30 5.80 10.20
28 11:45 11:47 0.3 0.3 0.3 7.34 6.90 10.20
31 12:30 12:31 0.3 0.3 0.3 6.90 6.90 6.90
34 12:56 12:57 0.2 0.2 0.2 5.80 5.80 5.80
37 13:16 13:16 0.1 0.1 0.1 5.20 5.20 5.20
40 13:51 13:52 0.1 0.1 0.1 5.20 5.20 5.20
45 14:32 14:32 0.4 0.4 0.4 8.30 8.30 8.30
50 15:01 15:03 0.7 0.7 0.7 15.30 15.30 15.30
Table 5.Thermal manikin results 1 m from the glazing
Temp. [8C] Start End PMV avg PMV min PMV max PPD avg [%] PPD min [%] PPD max [%]
25 11:22 11:26 0.3 0.3 0.3 7.02 6.90 7.30
28 11:45 11:50 0.3 0.3 0.3 7.30 7.20 7.40
31 12:24 12:31 0.3 0.3 0.3 6.97 6.90 7.10
34 12:56 13:02 0.2 0.2 0.2 6.06 6.00 6.10
37 13:21 13:27 0.1 0.1 0.1 5.10 5.10 5.10
40 13:49 13:55 0.0 0.0 0.0 5.00 5.00 5.00
45 14:25 14:35 0.3 0.3 0.3 6.68 6.50 6.80
50 14:55 15:00 0.5 0.5 0.5 10.96 10.40 11.20
Fig. 4.Change of the PMV values based on heated glass surface temperature ranging from 25 to 508C, distance from glazing is 1 m
the usability of an electrically heated glazing can be evalu- ated positively taking comfort theory into account.
ACKNOWLEDGEMENTS
The descried work was carried out as part of the EFOP-3.6.1.
16-2016-00004 “Comprehensive Development for Imple- menting Smart Specialization Strategies at the University of Pecs”. The project has been supported by the European Union, co-financed by the European Social Fund.
REFERENCES
[1] Z. Magyar, Applicability of the Thermal Manikin for Thermal Comfort Investigations, PhD Thesis, G€od€oll}o, Hungary: Szent Istvan University, 2011.
[2] Z. Magyar and T. Revai,“Thermal comfort of the clothing 2nd Royal Hungarian Army in winter campaign in the light of thermal manikin measurements,”Acta Polytechnica Hungarica, vol. 11, no.
7, pp. 197–207, 2014.
[3] L. Banhidi and L. Kajtar,Selected Chapters on the Topic of Comfort Theory(in Hungarian). Budapest: Akademiai Kiado, 2018.
[4] J. Rimbalova, S. Vilcekova, and A. Estokova,“Indoor and outdoor air quality monitoring in hemp house - Case study,” Pollack Period., vol. 6, no. 3, pp. 63–72, 2011.
[5]ISO 7730:2005, Ergonomics of the Thermal Environment.
Analytical Determination and Interpretation of Thermal Comfort
Using Calculation of the PMV and PPD Indices and Local Thermal Comfort Criteria. Geneva, Switzerland: CEN/TC22, 2005.
[6]ASHRAE 55:1017, Thermal Environmental Conditions for Human Occupancy. Atlanta, United States: American Society of Heating and Air-Conditioning Engineers, 2017.
[7] C. V. Pious and S. Thomas, “Polymeric materials - Structure, properties, and applications,” in J. Izdebska-Podsiadły and S.
Thomas, Eds., Printing on polymers, fundamentals and applica- tions. Ch. 2, William Andrew publ., pp. 21–39, 2015.
[8] P. O. Fanger, Thermal Comfort. Analysis and Applications in Environmental Engineering. Copenhagen: Danish Technical Press, 1970.
[9] T. Bedford, and C. G. Warner,“The globe thermometer in studies of heating and ventilation,” Epidemiol. Infect., vol. 34, no. 4, pp. 458–473, 1934.
[10] W. Zhang, H. Ma, and S. X. Yang,“An inexpensive, stable, and accurate Relative humidity measurement method for challenging environments,”Sensors, vol. 16, no. 3, pp. 398, 2016.
[11] M. Luo, X. Zhou, Y. Zhu, and J. Susdell,“Revisiting an overlooked parameter in thermal comfort studies, the metabolic rate,”Energy and Buildings, vol. 118, pp. 152–159, 2016.
[12] A. Zhang, Q. Huang, Y. Do, Q. Zhen, and Q. Zhang,“Agent-based modeling of occupants clothing and activity behavior and their impact on thermal comfort in buildings,”IOP Conf. Ser: Earth Environ. Sci., vol. 329, Paper no. 012022, 2019.
[13] J. Szabo and L. Kajtar,“Comfort measurements in offices,”Pollack Period., vol. 9, no. 1, pp. 81–90, 2014.
[14] C. Deb, and A. Ramachandraiah,“Evaluation of thermal comfort in a rail terminal location in India,”Building Environ., vol. 45, no.
11, pp. 2571–2580, 2010.
Open Access. This is an open-access article distributed under the terms of the Creative Commons Attribution 4.0 International License (https://creativecommons.org/
licenses/by/4.0/), which permits unrestricted use, distribution, and reproduction in any medium, provided the original author and source are credited, a link to the CC License is provided, and changes–if any–are indicated. (SID_1)