Statistical comparison of typical Hungarian administrative public service processes using
key performance indicators
LÁSZLÓ BUICS
Assistant Lecturer University of Győr, Hungary
Email: buics.laszlo@sze.hu
EDIT SÜLE
Associate Professor University of Győr, Hungary
Email: sedit@sze.hu
This study aims to comparatively analyse the front office operations of two Hungarian gov- ernment windows, one located in a capital city district and the other in a county district centre, to examine the difference in the perceived service levels.
First, through an international literature review, the study describes the background of the government window system and the importance of key performance indicators (KPIs). In addition, it demonstrates how KPIs can be measured in a public service context, regardless of the type and complexity of a given service.
Second, the study provides a detailed statistical analysis and a comparison of the typical administrative public services related to waiting times, processing times, and lead times. Moreover, it offers an analogy of industrial service process management by presenting how the selected meth- ods and measures can be used to review processes related to an industrial, a manufacturing, or a public service, following a holistic management approach.
The study contributes to the literature by using KPIs of the private sector and industry in public service processes and shows how these common KPIs can be measured in the public service context to provide valuable insights into service processes. Finally, it demonstrates the differences between the KPIs of the government windows to help legislators to increase the efficiency and effectiveness of services.
KEYWORDS: KPIs, government windows
I
n Hungary, the institution of district offices dates back centuries; they were first established in the 13th century. Previously, they had different goals and jurisdic-tions (Csizmadia [1976]) until their abolishment in 1983. The district offices were re-established three decades later, in 2013, as the second step in the government’s reform program called the Zoltán Magyary Public Administration Development Program (Magyary Program; Barta [2013]). As the interaction of the citizen with the state is mostly on the district level, the operation of the districts affects the popula- tion’s perception regarding the functioning of the entire state (Csite–Oláh [2011]).
The district offices were set up as organisational units of the capital and county gov- ernment offices in 2013. The district system contains 175 units in the countryside and 23 district offices across the capital.
The primary goal of the reforms launched within the framework of the Magyary Program announced in 2010 was to establish a customer-centric service operation that considers the needs and interests of customers. Through this program, the legislators aimed at simplifying procedures, reducing customer burdens, and creating uniform, high-quality services accessible to all citizens. To raise the stand- ard of public services, a multi-channel system of government customer services was created through the establishment of the government windows that embody one-stop shops.
This study aims to examine the front office operations of two individual gov- ernment windows, one located in a capital district and the other in a county district centre. First, with the help of an international literature review, we describe the background of the government window system and the importance of performance measurement using key performance indicators (KPIs), demonstrating how KPIs can be measured in a public service context, regardless of the type and complexity of a given service.
As part of the reforms, the creation of government windows introduced the one-stop shop model into the Hungarian public administration. In fact, the model exists as a common administrative solution in several countries. Government win- dows serve as key access points between the citizens and the state (Buics–
Süle [2020a], Buics–Eisinger Balassa [2020]). Through this system, customers can settle several cases simultaneously, at one point of administration, in the case of a more complex procedure; moreover, the system can help customers initiate the pro- cedure or receive information (Temesi–Linder [2015]).
Second, the study provides a detailed statistical analysis of the conventional administrative public services in terms of waiting times, processing times, and lead times, by expanding on the findings of previous studies (Buics–Süle [2020a], [2020b]). Moreover, it demonstrates the differences between the KPIs of the two government windows. We offer an analogy of industrial service process management by showing how the selected methods and measures can be used to review processes regarding an industrial, a manufacturing, or a public service by adopting a holistic management approach.
The analysed data contain 45,234 records from the capital district government window and 59,206 records from the county district government window, with each record representing an individual case handled by an administrator. The data contains citizens’ arrival and waiting times and the case processing times during the front office operations between 1 December 2016 and 31 November 2017.
1. District offices and government windows
Each district capital has a district office, and the capital and its jurisdiction are regulated by Government Decree 86/2019. (IV. 23.). Districts are exclusively a territo- rial unit of state administration. The district offices are primarily required to perform public administration tasks at a level below the national level. These offices were es- tablished as general, first-instance authorities and organisational units of the capital and county government offices. The state aimed to create modern district systems with lower social costs than the previous administrative system (Hoffman [2012]). With the comprehensive transformation of the public administration, the modern districts were established as the lowest territorial level of public administration, which can perform most of the public administration activities and provide high-quality services to the Hungarian citizens (Virág [2012], Barta [2013], Kéki [2013]).
Regarding the establishment of districts, the state commissioned investigations to ensure their efficient establishment (Ivancsics–Tóth [2012]). The demarcation of the districts considered the need to reduce the previously mentioned social costs and adapting to the land use habits and territorial identity of the citizens (Szalkai–Jakobi–
Szabó [2011]).
The government has also decided on the tasks to be transferred to the district of- fices. The district offices mainly took over office documentation tasks, child protection and guardianship matters, and the administration of social, environmental, and nature conservation matters from the municipalities. Most cases referred to the district office are office documentation tasks, including personal data and address registration, pass- port administration, and vehicle administration. These administrative services are pro- vided by the government window system, which functions as a separate department of each district office and operates as one-stop shop service centres.
The district office provides customer services to citizens in two ways. In cities where it is justified by the number of residents and cases to be handled, it operates a as a permanent office on all working days. In smaller settlements, the municipal assistant holds a client reception, once or twice a week, in the room provided by the local municipality.
The headquarters and jurisdiction area of the district offices are determined by a government decree. The principle guiding the establishment of districts is ensuring quick and easy access to public administration services for citizens, in line with the borders of the counties, maintaining previous administrative locations where possible (Barta [2013], Kovács–Hajnal [2015]).
To operate more efficiently, several ministries and background institutions have been merged, the number of central administration institutions has been re- duced, and the tasks performed by them have been integrated under the newly merged institutions. The most noticeable results of this comprehensive transfor- mation process include the reorganisation of the territorial administration by the government, which has unified the highly fragmented system of the former territorial administrative organisation (Kovács–Hajnal [2013]).
Thereafter, the government windows have become the direct points of contact for citizens to access the state apparatus. Thus, the perception and opinion of the citizens about the state are fundamentally determined by how they encounter the state through the government windows while managing their affairs. The basic ex- pectation from the system is efficient, quick, and easy resolutions to citizens’ prob- lems. In addition, the state should provide the maximum assistance to everyone.
Government windows embody one-stop shops with all their benefits. The goal is to further increase efficiency and thus citizen satisfaction (Kovács–Hajnal [2014]).
Government windows have a uniform image, and the main purpose of design- ing them is to enable customers to arrange and initiate their affairs without any hin- drances. Government windows were established using the infrastructure of the doc- ument offices in terms of both buildings and personnel.
In some cases, government windows can only provide information, while in others, they can also provide a service. This eliminates the need to visit multiple locations and makes the system adapt to numerous customer reception regimes.
The activities of government windows have been constantly expanding since their establishment; as of 2020, government windows can help citizens resolve over 2,000 different types of cases. These cases can be classified into several categories based on the 86/2019 (IV. 23.) Government Decree, as given below:
– submissions that can be immediately resolved (for example, issuing an official identity card for a new identity and address card);
– submissions that can be resolved within the authority of the government window (for example, issuance of a driving licence or a passport);
– submissions that cannot be resolved within the authority of the government window but can be transferred by the government window to a higher authority (for example, a request for the issuance of a birth certificate);
– providing information in the case of submissions which cannot be handled or transferred by the government window (for example, guardianship office issues or establishment of a registered partnership);
– providing additional services (for example, Client Gate registration).
2. Key performance indicator measurement
To create more effective and efficient, customised services, the first step should be to thoroughly examine the existing processes for determining the required changes to achieve the development goals. Measuring service characteristics with the help of KPIs is vital for this examination. Private businesses are aware of the im- portance of performance measurement because fulfilling customer needs is the only way to survive in the market. In the case of public services, mostly, there are no competitors. However, governments should consider how they are delivering ser- vices because a better-developed process could save costs, resources, and man hours and eliminate administrative burdens hindering the system. Therefore, measuring KPIs is also crucial in terms of public service management.
Services have been defined in various ways. These definitions distinguish ser- vices from production by three characteristics. First, services are considered intangi- ble, as nothing tangible remains after they are rendered; for example, education ser- vice. Second, services cannot be stored like products; thus, production and consump- tion occur simultaneously. Third, the nature and intensity of customer relationships may vary; for example, some services require high-level customer relationships (e.g. restaurants), while others need low-level relationships (e.g. back-office opera- tions in a bank) (Sampson–Froehle [2006]).
Performance measurement is an important issue for scholars and practitioners (Neely [2005], Richard et al. [2009]) who developed different measurement systems and frameworks in recent decades (Kaplan–Norton [2001], Kueng [2000], Neely et al. [2000]).
Private and public companies use different types of performance management systems. There are various methods to enhance the performance of organisations, including balance scorecard, benchmarking, continuous improvement, total quality management, management by objectives, quality control circle, and KPIs (Brignall et al. [1991], Kaplan–Norton [2004]). Each includes regular recurring activities to establish organisational goals, monitor progress, and adapt to changes for efficient and effective achievement of these goals (Brown–McDonnell [1995]).
This type of performance measurement is attracting the interest of a wide range of organisations, including government bodies and educational institutions (Atkinson–
Brown [2001]).
KPIs are quantifiable measures that reflect the critical success factors of an or- ganisation. Specific attention should be given to the development of indicators relat- ed to outputs, economy, efficiency, and equity. Regardless of the indicators selected, each must mirror one or more of the organisation’s goals. Reliable, well defined, verifiable, cost-effective, appropriate, and relevant KPIs should be sought, along with baseline information and quantifiable targets (Ibrahim [2001]).
Each KPI has its measurement criteria to determine its success or failure. Thus, it is important to set the time for measuring such an indicator. An organisation can choose between a repeating or a fixed period. A repeating period occurs at certain intervals over a year. Numerical values should be assigned to the categories of KPIs.
Organisations can create their own scale of measurement and set target criteria to quantify their performance.
Van Looy–Shafagatova [2016] identify several time performance indicators in business process models which are frequently used in research, such as throughput, waiting time, process duration, and lead time.
– Throughput: According to Cachon–Terwiesch [2013], throughput can be measured based on the number of units (customers, materials, and information) that can be processed in a given amount of time. In general, throughput is the rate of production, or the rate at which something is processed.
– Waiting time: Waiting time is also an important indicator of service quality; it is the total time elapsed between action’s (order, ser- vice) request and occurrence (Cachon–Terwiesch [2013]).
– Processing time: According to Hopp [2008a], the processing time is the amount of time needed for a machine or a service provider to transform the inputs of the process into a finished product or service.
While companies should aim at minimising the processing time of spe- cific products or services, doing so could compromise the quality.
– Lead time: Lead time is the amount of time needed to complete a process measured from the start until the end. In a manufacturing process, lead time often represents the time needed to create a product and deliver it to a consumer. Companies review lead time in a manu- facturing process, supply chain management, and project management during pre-processing, processing, and post-processing stages.
By comparing results with established benchmarks, they can identify inefficiencies (Hopp [2008a]).
According to the literature, due to the customer input in the case of services, the arrival times (including the arrival time differences derived from them) and pro- cessing times can show a high degree of fluctuation. Arrival and processing uncer- tainties can lead to uncertainties in the availability of production/service resources and the processing sequence. These fluctuations, even at a low average capacity utilisation, can cause queuing and waiting. The waiting problem illustrates a situation where customers are patient (never get bored of waiting) and the waiting room (or warehouse) is very large (everyone fits in), with no overflow (Hopp [2008b], Cachon–Terwiesch [2013]).
Overall, KPIs show the effectiveness of a company in achieving its goals.
These indicators act as diagnostic tools, facilitate corporate decisions, and increase transparency. In addition, KPIs can be interpreted at multiple company levels (high/low). The high-level KPIs focus on the overall operation of the business, while the low-level KPIs concentrate on individual departments, processes, and employees.
Thus, a KPI focuses on the characteristics of an organisation and influences its pre- sent and future success.
3. Statistical comparison of government window front office operations
This study analyses 45,234 records from the capital district government win- dow and 59,206 records from the county district government window, with each record representing an individual case handled by an administrator during the front office operations between 1 December 2016 and 31 November 2017.
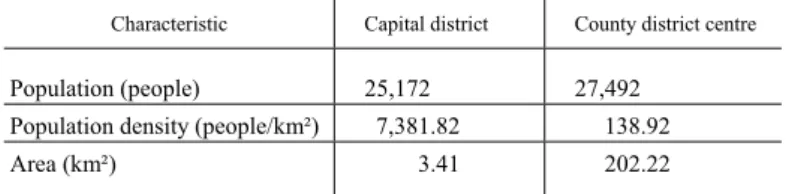
Table 1 lists the background information of the government windows’ envi- ronment. The population of both places are below 30,000, and the population density is naturally high in the case of the capital district, as the area is much smaller.
Table 1 Basic information on the capital district and the county district centre examined in the study
Characteristic Capital district County district centre
Population (people) 25,172 27,492 Population density (people/km²) 7,381.82 138.92 Area (km²) 3.41 202.22
While cleaning and sorting data, we excluded 3,543 records from the capital district government window and 257 records from the county district government
window with extreme values (when the processing time was shorter than 30 seconds or longer than three hours). Finally, we had 41,691 and 58,949 records. The reason that 30 seconds is considered an extreme value is that new customers need time to notice that their case number has been called and to find the right window. In addi- tion, customers may not show up. In these cases, administrators wait 20–30 seconds before calling a new customer. Table 2 shows the distribution of records by the length of processing time.
Table 2 Distribution of records by the length of processing time,
1 December 2016 – 31 November 2017
Processing time
Records from the capital district
government window Records from the county district government window
Number Distribution
(%) Number Distribution (%)
Below 30 seconds 3,462 7.65 116 0.20
Between 30 seconds and 3 hours 41,691 92.17 58,949 99.57
Over 3 hours 81 0.18 141 0.24
Total 45,234 100.00 59,206 100.00 Note. Here and in the tables hereafter, the deviations from 100.00 result from rounding.
3.1. Frequency of cases
Generally, citizens can choose from main case categories when they arrive at a government window; the analysed data contain these categories for each individual record. Some are general categories (for example, vehicle affairs), while the others are specific categories (such as student ID card, passport, Client Gate, and driving licence which is a common, separately managed vehicle-related affair).
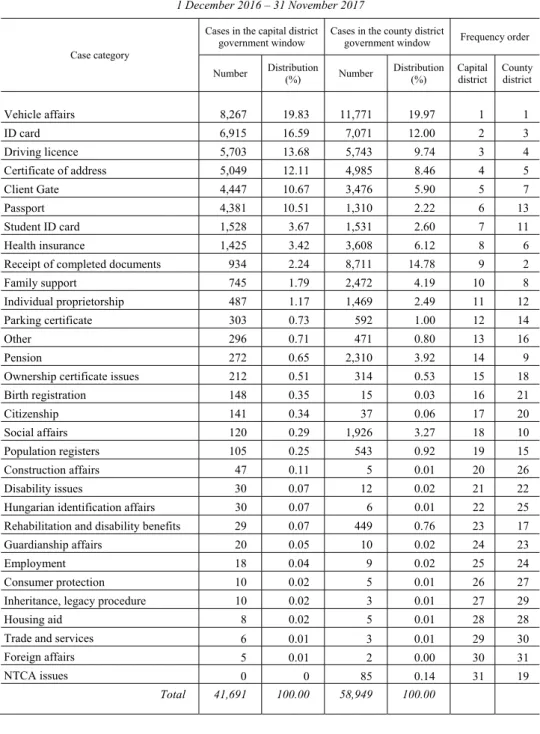
(See Table 3.) In the case of the capital district, there were 30 case categories, while in the case of the county district there were 31 (the one further category comprises NTCA [National Tax and Customs Administration] issues), which clearly shows that in addition to the general categories, government windows can differ from each other depending on individual circumstances.
Some case categories occur rarely (e.g. there were only five foreign affair- related cases recorded during the study period in the capital district government win- dow, and two in the county district government window); in contrast, the combined vehicle affairs and driving licence case categories account for 33.51% and 29,71% of the whole datasets.
Table 3 Distribution of cases by case category,
1 December 2016 – 31 November 2017
Case category
Cases in the capital district
government window Cases in the county district
government window Frequency order
Number Distribution
(%) Number Distribution (%) Capital
district County district
Vehicle affairs 8,267 19.83 11,771 19.97 1 1
ID card 6,915 16.59 7,071 12.00 2 3
Driving licence 5,703 13.68 5,743 9.74 3 4 Certificate of address 5,049 12.11 4,985 8.46 4 5
Client Gate 4,447 10.67 3,476 5.90 5 7
Passport 4,381 10.51 1,310 2.22 6 13
Student ID card 1,528 3.67 1,531 2.60 7 11 Health insurance 1,425 3.42 3,608 6.12 8 6 Receipt of completed documents 934 2.24 8,711 14.78 9 2
Family support 745 1.79 2,472 4.19 10 8
Individual proprietorship 487 1.17 1,469 2.49 11 12 Parking certificate 303 0.73 592 1.00 12 14
Other 296 0.71 471 0.80 13 16
Pension 272 0.65 2,310 3.92 14 9
Ownership certificate issues 212 0.51 314 0.53 15 18 Birth registration 148 0.35 15 0.03 16 21
Citizenship 141 0.34 37 0.06 17 20
Social affairs 120 0.29 1,926 3.27 18 10
Population registers 105 0.25 543 0.92 19 15 Construction affairs 47 0.11 5 0.01 20 26
Disability issues 30 0.07 12 0.02 21 22
Hungarian identification affairs 30 0.07 6 0.01 22 25 Rehabilitation and disability benefits 29 0.07 449 0.76 23 17 Guardianship affairs 20 0.05 10 0.02 24 23
Employment 18 0.04 9 0.02 25 24
Consumer protection 10 0.02 5 0.01 26 27
Inheritance, legacy procedure 10 0.02 3 0.01 27 29
Housing aid 8 0.02 5 0.01 28 28
Trade and services 6 0.01 3 0.01 29 30
Foreign affairs 5 0.01 2 0.00 30 31
NTCA issues 0 0 85 0.14 31 19
Total 41,691 100.00 58,949 100.00
3.2. Most common cases
Table 3 shows that the 13 case categories that were most common in the coun- try district government window, accounted for 96.62% of the cases in the capital district and 95.65% of the cases in the county district during the study period.
The most common case category for both districts was vehicle affairs with 19.83% and 19.97%, respectively. Most categories follow the same pattern but some key differences exist. For example, while receipt of completed documents was only ninth in the capital district with only 2.24%, it was second with 14.78% in the county district. Moreover, there are huge differences in terms of passport, pension, and so- cial affairs.
Vehicle affairs is the most common case category, which includes several types of cases, such as licence plate issues and car registration. Passport and ID card affairs include applications for a new passport or ID card, if it has been lost, been stolen, or expired. While ID card-related issues were very common in both govern- ment windows, it can also be observed that less passport cases (10.51% and 2.22%, respectively) and more social affairs cases had to be resolved in the county district than in the capital district (0.29% and 3.27%).
3.3. Waiting time comparison
Waiting time is calculated by comparing arrival time and call time. Arrival time occurs when customers use the ticket machine to select the type of case that they want to manage. Call time occurs when the administrator calls the issued ticket number and the customer goes to the window to arrange the affair.
Table 4 presents the waiting time statistics by case category. In the case of the most common categories, customers had to wait approximately the same amount of time until they were called to administer their issues (the difference between the mean waiting times is less than a minute). However, there are also considerable dif- ferences; the customers using driving licence, ID card, and student ID card-related services had to wait two–five minutes more in the county district office government window. Interestingly, for receipt of completed documents, customers of the capital district government window had to wait at least three minutes more, even though this type of issue was much more common in the county district.
Table 4 Waiting time statistics by case category, 1 December 2016 – 31 November 2017
(hours:minutes:seconds)
Case category
Mean Standard deviation Median
Capital
district County
district Capital
district County
district Capital
district County district
Vehicle affairs 0:08:27 0:07:45 0:11:43 0:16:40 0:04:15 0:01:15 ID card 0:08:54 0:12:00 0:10:22 0:12:35 0:05:12 0:08:05 Driving licence 0:09:21 0:11:50 0:10:38 0:12:45 0:05:38 0:07:38 Certificate of address 0:11:14 0:10:43 0:12:13 0:13:37 0:07:10 0:06:34 Client Gate 0:04:58 0:05:11 0:07:08 0:06:15 0:01:56 0:03:05 Passport 0:08:15 0:09:16 0:12:05 0:16:17 0:04:49 0:02:57 Student ID card 0:09:33 0:14:15 0:10:32 0:13:44 0:06:10 0:10:17 Health insurance 0:06:07 0:05:59 0:08:59 0:06:58 0:02:26 0:03:26 Receipt of completed documents 0:08:26 0:05:17 0:11:12 0:05:44 0:05:32 0:03:21 Family support 0:06:17 0:05:59 0:09:06 0:07:15 0:02:18 0:03:25 Individual proprietorship 0:05:31 0:05:53 0:08:05 0:11:10 0:01:55 0:02:08 Pension 0:07:31 0:06:11 0:10:14 0:07:05 0:03:08 0:03:38 Social affairs 0:05:04 0:05:28 0:07:37 0:06:28 0:01:46 0:03:20
Minimum 0:04:58 0:05:11 0:07:08 0:05:44 0:01:46 0:01:15
Maximum 0:11:14 0:14:15 0:12:13 0:16:40 0:07:10 0:10:17
3.4. Processing time comparison
Processing time is calculated by subtracting call time from case closure time.
Case closure time denotes the time when the process is completed, and the adminis- trator closes the record in the system.
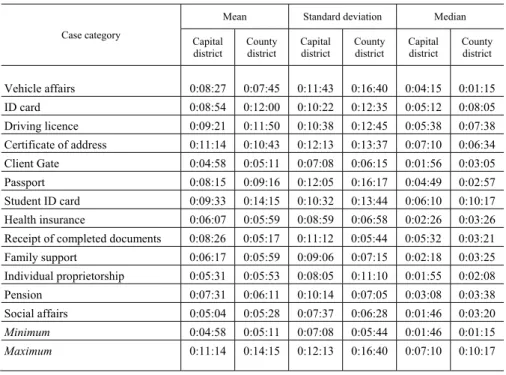
Table 5 shows processing time statistics for the most common categories.
As we can see, even though government windows are uniform and the processes are the same, the difference between the processing times of the cases is clear. Accord- ing to the mean processing times, in most categories, the processes were much faster in the county district than in the capital district, with a very large difference in the case of receipt of completed documents. In addition, one could experience substan- tial differences regarding vehicle affairs and driving licence, certificate of address, and ID card-related cases, with a general difference of 1–10 minutes.
Table 5 Processing time statistics by case category, 1 December 2016 – 31 November 2017
(hours:minutes:seconds)
Case category
Mean Standard deviation Median
Capital
district County
district Capital
district County
district Capital
district County district
Vehicle affairs 0:19:28 0:10:00 0:21:49 0:09:08 0:12:23 0:07:41 ID card 0:17:00 0:08:09 0:18:47 0:07:57 0:12:26 0:07:08 Driving licence 0:18:59 0:07:11 0:19:59 0:06:38 0:12:56 0:06:56 Certificate of address 0:16:28 0:05:29 0:18:49 0:04:57 0:11:03 0:04:25 Client Gate 0:06:20 0:06:35 0:09:36 0:06:04 0:03:56 0:05:26 Passport 0:16:13 0:10:48 0:17:44 0:07:08 0:11:38 0:10:20 Student ID card 0:14:04 0:05:11 0:17:18 0:06:11 0:08:46 0:04:28 Health insurance 0:07:22 0:07:09 0:07:53 0:06:48 0:05:48 0:05:39 Receipt of completed documents 0:33:44 0:03:01 0:36:35 0:03:00 0:19:08 0:02:17 Family support 0:10:26 0:08:09 0:12:21 0:06:18 0:07:46 0:06:58 Individual proprietorship 0:10:17 0:14:23 0:12:39 0:10:01 0:06:20 0:12:32 Pension 0:12:25 0:10:54 0:09:12 0:08:11 0:10:34 0:09:15 Social affairs 0:11:02 0:08:25 0:13:17 0:06:11 0:07:03 0:07:27
Minimum 0:06:20 0:03:01 0:07:53 0:03:00 0:03:56 0:02:17
Maximum 0:33:44 0:14:23 0:36:35 0:10:01 0:19:08 0:12:32
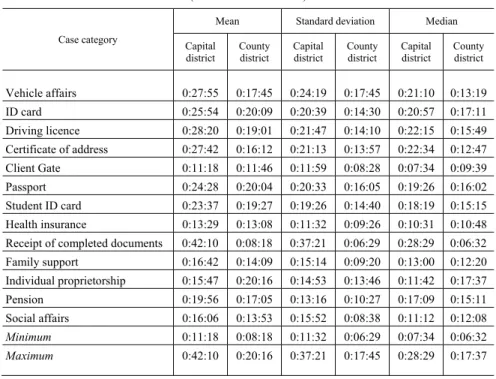
3.5. Lead time comparison
Lead time is calculated by subtracting arrival time from case closure time.
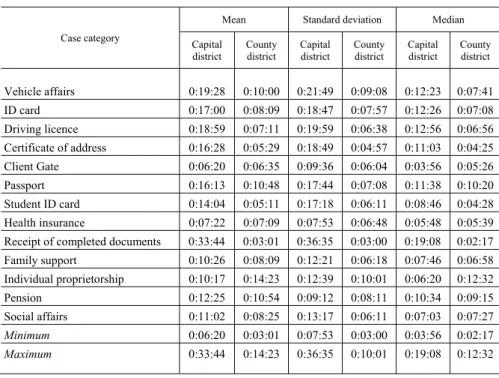
Table 6 presents the main lead time statistics for the most common case categories.
Based on the waiting time and processing time characteristics of the lead times for these case categories, the service was provided faster in the county district than in the capital district, with large differences in receipt of completed documents, certifi- cate of address, vehicle affairs, driving licence, and ID card-related cases. Further- more, because of the huge difference in the case of receipt of completed documents, the maximum of the mean lead times is 42 minutes, 10 seconds in the capital district;
however, if we exclude this category, the maximum lead time becomes 28 minutes, 20 seconds, which is 20 minutes, 16 seconds in the county district.
Table 6 Lead time statistics by case category, 1 December 2016 – 31 November 2017
(hours:minutes:seconds)
Case category
Mean Standard deviation Median
Capital
district County
district Capital
district County
district Capital
district County district
Vehicle affairs 0:27:55 0:17:45 0:24:19 0:17:45 0:21:10 0:13:19 ID card 0:25:54 0:20:09 0:20:39 0:14:30 0:20:57 0:17:11 Driving licence 0:28:20 0:19:01 0:21:47 0:14:10 0:22:15 0:15:49 Certificate of address 0:27:42 0:16:12 0:21:13 0:13:57 0:22:34 0:12:47 Client Gate 0:11:18 0:11:46 0:11:59 0:08:28 0:07:34 0:09:39 Passport 0:24:28 0:20:04 0:20:33 0:16:05 0:19:26 0:16:02 Student ID card 0:23:37 0:19:27 0:19:26 0:14:40 0:18:19 0:15:15 Health insurance 0:13:29 0:13:08 0:11:32 0:09:26 0:10:31 0:10:48 Receipt of completed documents 0:42:10 0:08:18 0:37:21 0:06:29 0:28:29 0:06:32 Family support 0:16:42 0:14:09 0:15:14 0:09:20 0:13:00 0:12:20 Individual proprietorship 0:15:47 0:20:16 0:14:53 0:13:46 0:11:42 0:17:37 Pension 0:19:56 0:17:05 0:13:16 0:10:27 0:17:09 0:15:11 Social affairs 0:16:06 0:13:53 0:15:52 0:08:38 0:11:12 0:12:08 Minimum 0:11:18 0:08:18 0:11:32 0:06:29 0:07:34 0:06:32 Maximum 0:42:10 0:20:16 0:37:21 0:17:45 0:28:29 0:17:37
In summary, we can conclude that although every government window is uni- form and offers the same services, based on the comparison, the processing times are different. In some cases, this difference is as much as 8 minutes, even if we exclude the extreme values of receipt of completed documents.
4. Conclusion
This study has analysed the front office operations of a capital city district government window and a county district government window to demonstrate how the time-related KPIs, which are commonly used in the industry, can be measured in the public service and statistically analysed, regardless of the type and complexity of the service.
Government windows introduced the one-stop shop model into the Hungarian public administration, operating as the key access points between the citizens and the
state. These places are uniform, offering the same services with the same characteris- tics, and allow the citizens to handle their issues in the same manner in any govern- ment window of their choosing.
The study has provided a detailed statistical analysis and comparison of the most common administrative public services related to waiting times, processing times, and lead times, analysing the data of 45,234 records from the capital district government window and 59,206 records from the county district government win- dow. Each record represents an individual case handled by an administrator at the government windows between 1 December 2016 and 31 November 2017.
Our study contributes to the literature by using the performance measurement indicators of the private sector in public service processes and showing how these common KPIs can be measured in the public service setting to provide valuable in- sights into such processes. Furthermore, we demonstrate the existing differences between the KPIs of the government windows to help legislators to increase efficien- cy and effectiveness of services.
From the above comparison of the two datasets, despite the uniform structure and similar service characteristics, there are differences between the processing times in the service categories; in some cases, the difference is under one minute, while in others, the differences can be as much as 8 minutes. As there is no clear indication of the target value of these processing times in the legal context, we cannot define the right interval and tolerance limits. Thus, we cannot determine whether the calculated values are within the target interval. However, we can provide solid evidence that there is a difference between the processing times. To highlight the importance of KPIs in public service, as the first step towards a more efficient service management, further research is needed, including the comparison of more datasets.
References
ATKINSON,H.–BROWN,J. [2001]: Rethinking performance measures: Assessing progress in UK hotels. International Journal of Contemporary Hospitality Management. Vol. 13. No. 3.
pp. 128–136. https://doi.org/10.1108/09596110110388918
BARTA, A. [2013]: A közigazgatás terülteti szintjének legfontosabb jellemzői, kodifikációs állomásai Magyarországon 1867 és 1989 között. Kodifikáció és Közigazgatás. Vol. 2.
No. 2. pp. 72–82.
BRIGNALL,T.J.–FITZGERALD,L.–JOHNSTON,R.–SILVESTRO,R. [1991]: Performance measure- ment in service businesses. Management Accounting. Vol. 69. No. 10. pp. 34–36.
BROWN,J.–MCDONNELL,B. [1995]: The balanced scorecard: Short-term guest or long-term resi- dent? International Journal of Contemporary Hospitality Management. Vol. 7. Nos. 2–3.
pp. 7–11. https://doi.org/10.1108/09596119510146751
BUICS,L.–EISINGER BALASSA,B. [2020]: Analyzing public service processes from customer and employee perspectives by using service blueprinting and business process model- ling. Proceedings of the ENTRENOVA – ENTerprise REsearch InNOVAtion Conference (Online). Vol. 6. No. 1. pp. 195–211. https://hrcak.srce.hr/ojs/index.php/entrenova/
article/view/13455
BUICS,L.–SÜLE,E. [2020a]: Service process excellence in public services. Proceedings of the ENTRENOVA – ENTerprise REsearch InNOVAtion Conference (Online). Vol. 6. No. 1.
pp. 173–186. https://hrcak.srce.hr/ojs/index.php/entrenova/article/view/13453
BUICS,L.–SÜLE, E.[2020b]: Satistical analysis of Hungarian public service processes for key performance indicator measurement. Hungarian Statistical Review. Vol. 3. No. 2.
pp. 71–98. https://doi.org/0.35618/hsr2020.02.en071
CACHON, G. – TERWIESCH, C. [2013]: Matching Supply with Demand: An Introduction to Operations Management. 3rd Edition. McGraw Hill–Irwin. New York.
CSITE,A.–OLÁH,M. [2011]: Kormányozni lehet ugyan távolról, de igazgatni csak közelről lehet jól. Nemzeti Közigazgatási Intézet–Hétfa Elemző Központ. Budapest.
CSIZMADIA, A. [1976]: A magyar közigazgatás fejlődése a XVIII. századtól a tanácsrendszer létrejöttéig. Akadémiai Kiadó. Budapest.
HOFFMAN, I. [2012]: A járás helye a magyar közigazgatás rendszerében. Magyar Közigazgatás.
Vol. 2. No. 1. pp. 9–32.
HOPP,W.J. [2008a]: Supply Chain Science. McGraw Hill–Irwin. New York.
HOPP,W.J. [2008b]: Single server queuing models. In: Chhajed, D. – Lowe, T. J. (eds.): Building Insights from Basic Operations Management Models and Principles. Springer Science–
Business Media. Berlin. pp. 51–79.
IBRAHIM, J. E. [2001]: Performance indicators from all perspectives (Editorial). International Journal for Quality in Health Care. Vol. 13. No. 6. pp. 431–432.
https://doi.org/10.1093/intqhc/13.6.431
IVANCSICS,I.–TÓTH,J. [2012]: A járások múltjáról és lehetséges jövőjéről. Területi Statisztika.
Vol. 15. (52.) No. 1. pp. 6–34.
KAPLAN,R.S.–NORTON,D.P. [2001]: The Strategy-Focused Organization. How Balanced Score- card Companies Thrive in the New Business Environment. Harvard Business School Press.
Boston.
KAPLAN,R.S.–NORTON,D.P. [2004]: Strategy Maps: Converting Intangible Assets into Intangi- ble Outcomes. Harvard Business School Press. Boston.
KÉKI,Z. [2013]: A jegyző szerepe az államigazgatásban a járások megalakulása után. Pro Publico Bono–Magyar Közigazgatás. Vol. 1. No. 2. pp. 59–64. https://folyoirat.ludovika.hu/
index.php/ppbmk/article/view/3200
KOVÁCS, É. – HAJNAL, GY. [2013]: Analyzing the Motives of Reforming Central Government Coordination in Hungary: A Case Study of One-Stop-Government Reforms. Paper presented at the Seventeenth Annual Conference of the International Research Society for Public Management. 10–12 April. Prague.
KOVÁCS, É.–HAJNAL, GY. [2014]: Government Windows: One Stop Shops for Administrative Services in Hungary. Palgrave Macmillan. London. https://doi.org/
10.1057/9781137359636_20
KOVÁCS, É. –HAJNAL, GY. [2015]: Analyzing the motives of reforming customer services in Hungarian public administration: A case study of one-stop-government reforms.
In: DiMauro, C. – Ancarani, A. – Vastag, G. (eds.): Research in the Decision Sciences for the Service Economy. Pearson FT Press. London. pp. 5–32.
KUENG,P. [2000]: Process performance measurement system: A tool to support process-based organizations. Total Quality Management. Vol. 11. No. 1. pp. 67–85.
https://doi.org/10.1080/0954412007035
NEELY,A.–MILLS,J.–PLATTS,K.–RICHARDS,H.–GREGORY,M.–BOURNE,M.–KENNERLEY,M.
[2000]: Performance measurement system design: Developing and testing a process-based approach. International Journal of Operations and Production Management. Vol. 20.
No. 10. pp. 1119–1145. https://doi.org/10.1108/01443570010343708
NEELY,A. [2005]: The evolution of performance measurement research. International Journal of Operations and Production Management. Vol. 5. No. 12. pp. 1264–1277.
https://doi.org/10.1108/01443570510633648
RICHARD,P.–DEVINNEY,T.–YIP,G.–JOHNSON,G. [2009]: Measuring organizational perfor- mance: Towards methodological best practice. Journal of Management. Vol. 35. No. 3.
pp. 718–804. https://doi.org/10.1177/0149206308330560
SAMPSON, S.E.–FROEHLE, C.M. [2006]: Foundations and implications of a proposed unified services theory. Production and Operations Management. Vol. 15. No. 2. pp. 329–343.
https://doi.org/10.1111/j.1937-5956.2006.tb00248.x
SZALKAI,G.–JAKOBI,Á.–SZABÓ,P. [2011]: A járáskialakítás térségi megalapozása: módszertan.
Nemzeti Közigazgatási Intézet–Hétfa Elemző Központ. Budapest.
TEMESI, I. – LINDER, V. [2015]: Közigazgatási szakvizsga – jegyzet. Nemzeti Közszolgálati Egyetem. Budapest.
VAN LOOY, A. – SHAFAGATOVA, A. [2016]: Business process performance measurement:
A structured literature review of indicators, measures and metrics. SpringerPlus. Vol. 5.
No. 1797. https://doi.org/10.1186/s40064-016-3498-1
VIRÁG,R. [2012]: Az államigazgatási feladat- és hatáskör-telepítés új rendszere – a járási rendszer kialakítása. Magyar Közigazgatás. Vol. 2. No. 1. pp. 10–16.