The sophisticated and extensive toolkit for designing, managing, and measuring industrial processes is constantly expanding and forced to meet the new standards that are set by the limitless amount of data offered by the digitalisation of the industrial environment. However, services are managed under cumbersome conditions, in terms of expectations, measurability, and the modelling techniques used.
Key performance indicators (KPIs) have been used for a long time in the private sector and in- dustry compared with the public sector. Companies often use KPIs to measure the performance of individual processes to determine whether they meet or fail the expectations of customers and them- selves. While public sector service providers are often monopolistic, the performance measurement also becomes a hot debate in the public sector as the citizens’ demand for quality services increases.
This study aims to identify objective KPIs and demonstrate how they can be measured in a pub- lic service context, regardless of the type and complexity of the given service. As an example, the authors discuss the front office operations of government windows and the contact affair procedures of guardianship offices. They apply business process modelling in order to map the service processes and perform a statistical analysis to extract waiting, processing and lead times from the available dataset to comprehensively overlook these services. Their goal is to offer an analogy of industrial service process management by presenting how the methods and measures can be used to review processes in an industrial, manufacturing or public service, using a holistic management approach.
KEYWORDS: key performance indicators, business process modelling, government windows
P
ublic management is undergoing a major transformation. Traditional pro- cesses have become obsolete, forcing the public sector to face new challenges.
* Supported by the ÚNKP-20-21 New National Excellence Program of the Ministry for Innovation and Technology of Hungary from the source of the National Research, Development and Innovation Fund.
Thus, public management processes need to be reconsidered and transformed accord- ing to the modern process management standards and expectations. The tasks of public service operators must be reviewed. The role of a public servant can no longer be interpreted only as the executor of the processes. Public servants know these pro- cesses, their advantages and disadvantages, strengths and weaknesses. This means that partially they are the ones who bear the knowledge which can lead to changing these processes. At the same time, customers also have useful knowledge about pub- lic service processes and procedures. Thus, their opinion also have to be taken into account when creating new systems.
This study aims to examine both simple and complex public services and cre- ates a comprehensive picture of the service process. We use the front office opera- tions of government windows and the contact affair procedures of guardianship of- fices as examples of simple and more complex services. We review the international literature to identify objective KPIs and perform a detailed statistical analysis to show how the data needed to measure the KPIs can be extracted from the available dataset. The study also offers a brief review of the background of the discussed ser- vices and uses the business process modelling methodology (Ko–Lee–Lee [2009];
Recker [2010], [2011]; Vuksic–Pejić Bach–Tomicic-Pupek [2017]) to map and visu- alise them to create a comprehensive overlook.
We identify objective KPIs and demonstrate how they can be measured in a public service context, regardless of the type and complexity of the given service.
Our study aims to contribute to the literature by applying these performance meas- urement indicators to public service processes with different characteristics and complexity. We present how these commonly used KPIs can be measured in differ- ent conditions to provide valuable insights about service processes, which legislators can use to increase efficiency and effectiveness of services.
We offer an analogy of industrial service process management by presenting how the selected methods and measures can be used to review processes regarding an industrial, manufacturing or public service by using a holistic management approach.
As part of the Hungarian administrative reforms, the system of government win- dows was established almost a decade ago to serve as the main access point between the citizens and the state (Buics–Süle [2020]). Our paper statistically analyses data (45,234 records) collected from a single government window and identifies KPIs re- garding service quality and excellence based on the related literature. The analysed data contains the arrival and waiting times of citizens and the processing times of cases during the front office operations between the 1st of December 2016 and the 31th of November 2017.
By conducting interviews with guardianship office administrators, we collected both qualitative and quantitative data and step-by-step processing information about
process, leading to the distortion of a family case for several months, or even a year in extreme cases.
1. Process management and key performance indicators
Services have been defined in various ways in the past. These definitions dis- tinguish services from production by three characteristics. First, services are consid- ered intangible as nothing tangible remains after them; a good example for this is an education service. Second, services cannot be stored like products, thus production and consumption take place simultaneously. Third, the nature and intensity of cus- tomer relationships may vary; for example, some services require high-level custom- er relations (e.g. restaurants), while others need low-level ones (e.g. back-office operations in a bank). (Sampson–Froehle [2006])
Performance measurement is an important issue for both scholars and practition- ers (Neely [2005], Richard et al. [2009]), who developed different measurement sys- tems and frameworks during the last decades (Kaplan–Norton [2001], Kueng [2000], Neely et al. [2000]). Providing quality service is considered essential in the private sector to secure survival and success (Parasuraman–Zeithaml–Berry [1985], Reichheld–Sasser [1990], Zeithaml–Parasuraman–Berry [1990]). Regarding the public sector, the urge to deliver quality public service is not related to a profit goal in most cases; nevertheless, public service providers are also under pressure to improve service quality, efficiency, and effectiveness (Randall–Senior [1994], Ramseook-Munhurrun–
Lukea-Bhiwajee–Naidoo [2010], Robinson [2003]).
Van Looy–Shafagatova [2016] identify several time performance indicators re- garding business process models frequently used in research, such as throughput, waiting time, process duration, and lead time.
Both private and public companies use different types of performance manage- ment systems. There are various methods to increase the performance of organisations like balance scorecard, benchmarking, continuous improvement, total quality manage-
ment, management by objectives, quality control circle, and KPIs (Brignall et al. [1991], Kaplan–Norton [2004]). Each includes regular recurring activi- ties to establish organisational goals, monitor progress, and make adjustments to achieve those goals more effectively and efficiently (Brown–McDonnell [1995]). This type of performance measurement is now becoming the interest to a wide range of bodies, in- cluding governments as well as educational institutions (Atkinson–Brown [2001]).
KPIs have been used for a longer time in the private sector and industry com- pared to the public sector. Companies often use KPIs as a tool to measure the per- formance of individual processes and entire departments. They can help determine whether the processes meet expectations, perform above expectations, or fail to meet expectations, which requires intervention to deal with the consequences (Bourne et al. [2000]). Measuring performance in the private sector is critical be- cause private companies are profit-oriented, and their low performance can result in the loss of customers and revenue. In the public sector, service providers are monop- olistic, however the demand for quality services increases and performance meas- urement becomes a hot debate. According to Bourne et al. [2000], a performance management system positively influences organisational behaviour, efficiency, and effectiveness.
KPIs are quantifiable measures that reflect the critical success factors of an or- ganisation. Specific attention should be given to the development of indicators relat- ed to outputs, economy, efficiency, and equity. Regardless of the indicators selected, each must mirror one or more of the organisation’s goals. KPIs that are reliable, well defined, verifiable, cost-effective, appropriate, and relevant should be sought, with baseline information and quantifiable targets (Ibrahim [2001]).
Each KPI has its set of measurement criteria to determine success or failure.
Setting the time for measuring such an indicator is important. An organisation can choose between a repeating or a fixed period. A repeating period occurs at certain intervals over one year. Numerical values are to be assigned to the categories of the KPI range. Organisations can create their own scale of measurement, and set target criteria to quantify their performance.
Overall, KPIs show how effective a company is in achieving its goals. They act as a diagnostic tool, facilitate corporate decisions, and increase transparency.
KPIs can be interpreted at multiple company levels (high-low). The high-level ones focus on the overall operation of the business, while the lower-level ones concentrate on individual departments, processes, and employees. A KPI focuses on the charac- teristics of an organisation, influencing its present and future success.
In the case of a well-designed KPI, the method of calculation, the unit of measurement, the procedure of value generation and the origin of data are always clear and well defined. The target value is also defined as well as the tolerance limit and the actions needed, if the measured value is below or over the target value.
2. Description of the chosen public services
This section discusses the background of the government windows and that of the contact procedures of guardianship offices. In both cases, we present a business process model to visualise service processes, which will be statistically analysed.
Business process modelling is a widely used modelling approach to examine and improve business processes in the private sector and in public service processes (Kazemzadeh–Milton–Johnson [2015a], [2015b], [2015c], [2015d]; Milton–Johnson [2012]; Muehlen–Recker [2008]; Vuksic–Pejić Bach–Marjanovic [2011]; Vuksic–
Pejić Bach–Popovič [2013]; Vuksic–Pejić Bach–Tomicic-Pupek [2017]). According to Ko–Lee–Lee [2009] and Recker [2011], it has a core set of constructs that can be used for modelling processes and activities, and it also has an extended set of con- structs which can be used to add further details in design, depth, and complexity.
2.1. Government windows
Government windows have introduced the one-stop-shop model into the Hungarian public administration, which exists as a common administrative solution in several other countries. The essence of this system is that customers can settle several cases simultaneously at one point of administration (Temesi–Linder [2015]).
Since their introduction, government windows have been the county govern- ment offices and district offices that form the territorial administration’s backbone and allow citizens to handle, initiate and receive information on the progress of many administrative procedures. In 2011 alone, 29 government windows started operations in the capital city, the county capitals and in cities with county status, but this num- ber was gradually increased from 2013. In 2014, one-stop shops were established in the district capitals. By the end of this process, there were about 360 government windows in the country with a unified image and service portfolio. (Kovács–
Hajnal [2013], [2016]; Temesi–Linder [2015])
After transforming the public administration system, government windows have become the points where citizens most often come in direct contact with the state apparatus. Thus, the citizens’ impression and opinion about the state are funda- mentally determined by how they approach it through the government windows while they manage their affairs. The system should be able to deal with matters effi- ciently, quickly, and easily, and the state should provide as much assistance as possi- ble to everyone. Government windows embody one-stop-shops with benefits, and the goal is to increase efficiency further, through which citizen satisfaction would also increase (Kovács–Hajnal [2014]).
The main purpose of designing government windows is to enable customers to arrange and initiate their affairs easily and quickly. The appearance of government windows is uniform. Their services are the same everywhere, and their locations are designed to be barrier-free, thus enabling easy access for the disabled and the elderly.
Government windows operate like service centres where multiple issues can be solved or information can be provided on where to go and what to do in complex cases. The interior design is similar in each government window, and the cases can be handled at any window. Unlike in the previous system, they are not tied to the applicants’ places of living. Therefore, government windows in central locations like county capitals or the capital city handle a large number of cases on average, as peo- ple usually tend to their administrative issues before or after work.
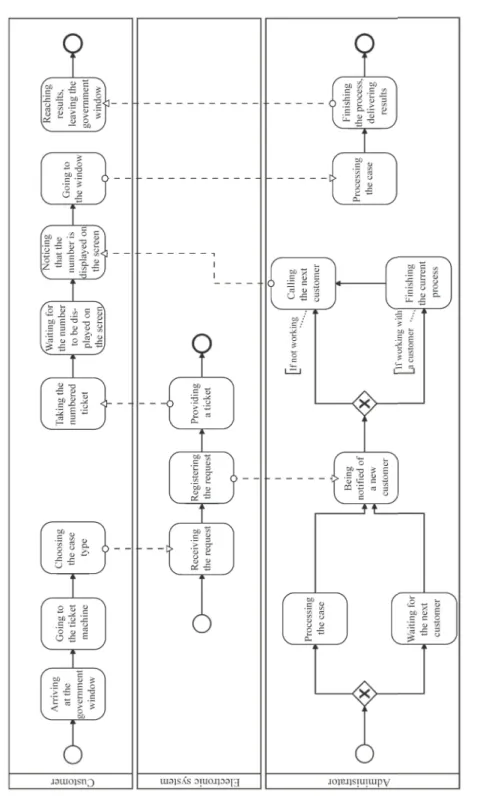
The process itself seems similar: after entering the government window, customers choose the case type they want to address using a ticket machine.
There are multiple administrators in a government window, but not all are skilled to handle all types of cases. After receiving their ticket, the customers wait until one of the administrators that can handle the chosen issue, becomes available. The adminis- trator then calls the customer, processes the case, and the customer leaves the gov- ernment window after finishing the process. Consequently, government window front office operations can be characterised by a parallel system with a single queue leading to several identical workstations. In our example, we are examining a gov- ernment window service process in which customers manage affairs or request in- formation that is common in other sectors as well.
Figure 1 shows the business process model of government window front office operations. The model is flexible, offering deep insights into the organisational per- spective of the actions taken and into the various layers of the operations. The elec- tronic system which handles the requests and notifications is a key part of the pro- cess, but other layers (that of customers and administrators) are also included in the model. Thus, Figure 1 also illustrates, among other things, the steps taken by the administrators.
Figure 1. Business process model of the government window front office operations
2.2. Contact affair procedures of guardianship offices
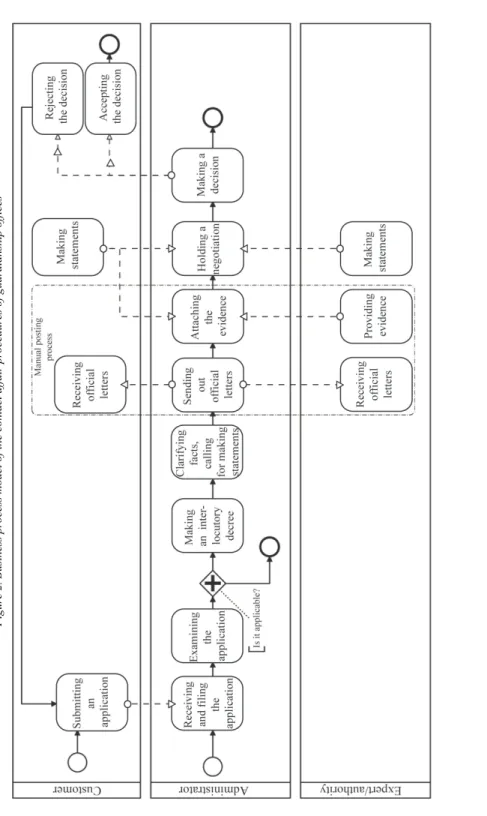
In this subsection, we are examining the contact affair procedures of the guard- ianship offices, which are more complicated than the front office operations of the government windows. We collected data in 2017 in the Guardianship Office of the Győr-Moson-Sopron County Government Office (Hungary) and conducted in-depth interviews. We created the business process model of contact affair procedures, based on the legal background and in-depth interviews.
In this case, the term ‘contact’ refers to parental contact. The supervision and regulation of contact affair procedures fall within the jurisdiction of the given city (see Government Decree 331/2006. (XII. 23.)1).
Figure 2 shows the business process model of the contact affair procedures of guardianship offices, presenting various (customers’, administrators’, and experts/authorities’) perspectives. In this procedure, separated parents settle their differences with the help of a guardianship office administrator. The procedure starts with an application by one (or both) of the parents, which undergoes an examination.
After formal and substantive checking, the administrator makes an interlocutory decree. Official letters are sent out by regular post to all interested parties informing them officially about the next steps. This can take significant time depending on the circumstances, cooperation and willingness of the opposing sides. After this and several other steps, the parties are summoned to make statements, provide evidence, and finally participate in a negotiation. During the negotiation, a decision is reached to resolve the issue based on the collected and verified evidence and the statements of the parents, experts and the child (children) (Buics–Eisinger Balassa [2020]).
The law provides only 60 days for the administrators to finish parental contact procedures.
1 Government Decree 331/2006. (XII. 23.) on the roles and responsibilities in child protection and guardianship affairs and on the authority and jurisdiction of guardianship offices.
Figure 2. Business process model of the contact affair procedures of guardianship offices
3. Statistical analysis of government window operations
This study analyses the collected data of a government window located in the capital city. A flow unit is considered a transaction or the demand expressed by a citizen. These transactions are automatically recorded after the service is requested at the ticket machine. The following transaction details are recorded:
time of request (‘Date’: year, month, day), number and name of the requested service (‘Service number’, ‘Service name’), window to which the customer is directed (‘Window’), the time when the numbered ticket was issued (‘Ticket time’: hours:minutes:seconds), time when the number is called (‘Call time’: hours:minutes:seconds), and case closure time (‘Closure time’:
hours:minutes:seconds). Since government windows do not have a uniform record- ing system, the details of datasets are different, making data extraction and com- parison of service centres harder.
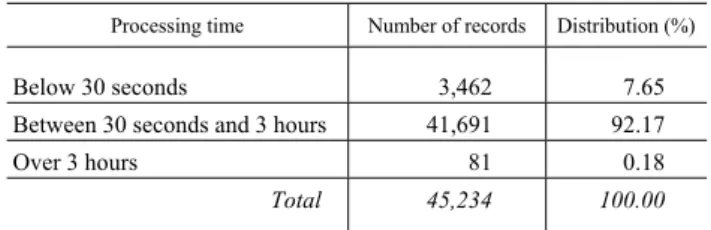
The study examines the processed cases from the 1st of December 2016 to the 31st of November 2017. During this period, the government window administrators processed 45,234 individual cases. During data cleaning and sorting, we excluded (3,543) records with extreme values (when the processing time was shorter than 30 seconds or longer than three hours), thus, in the end, we have 41,691 records left.
The reason why 30 seconds is considered extreme value is that new customers need time to notice that their case number was called and to find the right window. It may also happen that the customers do not show up. In these cases, administrators wait 20-30 seconds before calling a new customer. Table 1 shows the distribution of rec- ords by the length of processing time.
Table 1 Distribution of records by the length of processing time,
1 December 2016 – 31 November 2017
Processing time Number of records Distribution (%)
Below 30 seconds 3,462 7.65 Between 30 seconds and 3 hours 41,691 92.17
Over 3 hours 81 0.18
Total 45,234 100.00
There are numerous reasons why customers do not show up. The most com- mon one is that although they reserved an appointment previously, they are unable or forget to be there when their number is called. The other main reason is that they do not want to wait a long time in line. From the 3,543 excluded records, 835 (23.56%) were previously booked appointments. Besides, 78% of all records represent cases not previously booked, while 22% were booked during the study period.
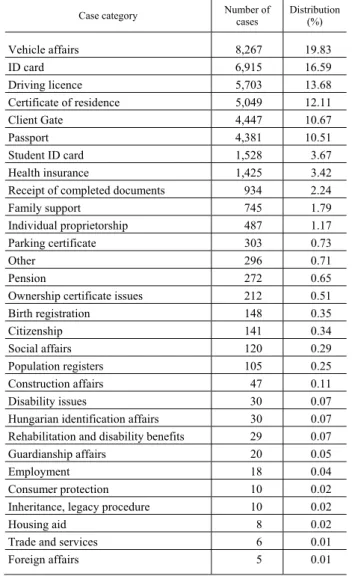
Table 2 Distribution of cases by case category, 1 December 2016 – 31 November 2017
Case category Number of
cases Distribution (%)
Vehicle affairs 8,267 19.83
ID card 6,915 16.59
Driving licence 5,703 13.68 Certificate of residence 5,049 12.11 Client Gate 4,447 10.67
Passport 4,381 10.51
Student ID card 1,528 3.67 Health insurance 1,425 3.42 Receipt of completed documents 934 2.24 Family support 745 1.79 Individual proprietorship 487 1.17 Parking certificate 303 0.73
Other 296 0.71
Pension 272 0.65
Ownership certificate issues 212 0.51 Birth registration 148 0.35
Citizenship 141 0.34
Social affairs 120 0.29 Population registers 105 0.25 Construction affairs 47 0.11 Disability issues 30 0.07 Hungarian identification affairs 30 0.07 Rehabilitation and disability benefits 29 0.07 Guardianship affairs 20 0.05
Employment 18 0.04
Consumer protection 10 0.02 Inheritance, legacy procedure 10 0.02
Housing aid 8 0.02
Trade and services 6 0.01
Foreign affairs 5 0.01
Some case categories occur rarely (e.g. there were only 30 disability-related cases during the study period); in contrast, the vehicle affairs and driving license case categories together account for 33.51% of the whole dataset.
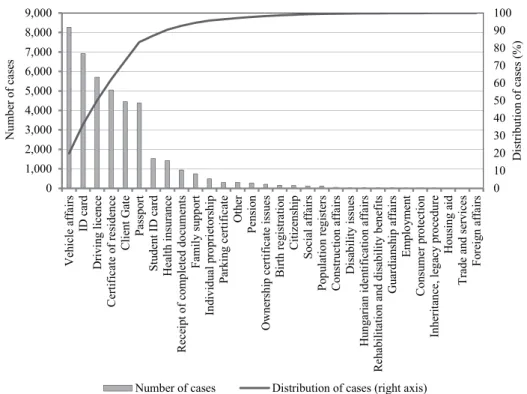
3.2. Most common cases
Table 2 and Figure 3 show that the six most common case categories account- ed for 83.39% of the cases in the study period. The seventh most common case cate- gory was student ID card-related affairs whose case number (1,528) was only one- third of the number of passport-associated cases (the sixth most common case type).
Figure 3. Number and cumulative distribution of cases by case category, 1 December 2016 – 31 November 2017
0 10 20 30 40 50 60 70 80 90 100
0 1,000 2,000 3,000 4,000 5,000 6,000 7,000 8,000 9,000
Vehicle affairs ID card Driving licence Certificate of residence Client Gate Passport Student ID card Health insurance Receipt of completed documents Family support Individual proprietorship Parking certificate Other Pension Ownership certificate issues Birth registration Citizenship Social affairs Population registers Construction affairs Disability issues Hungarian identification affairs Rehabilitation and disability benefits Guardianship affairs Employment Consumer protection Inheritance, legacy procedure Housing aid Trade and services Foreign affairs Distribution of cases (%)
Number of cases
Number of cases Distribution of cases (right axis)
As it was mentioned, vehicle affairs are the most common case category, which includes several case types like license plate issues and car registration.
Passport and ID card-related affairs include applications for a new passport or ID card if it has been lost, stolen, or expired.
communication platform, Company Gate was set up to separate citizens’ and compa- nies’ affairs. This certified hosting place is similar to Client Gate and provides regis- tered electronic delivery address for companies. However, at the time of the research, only Client Gate existed.
3.3. Waiting time statistics
Waiting time is calculated by comparing arrival time and call time. Arrival time is when a customer uses the ticket machine to select the type of the case, he/she wants to manage. Call time is when the administrator calls the issued ticket number and the customer goes to the window to arrange his/her affair.
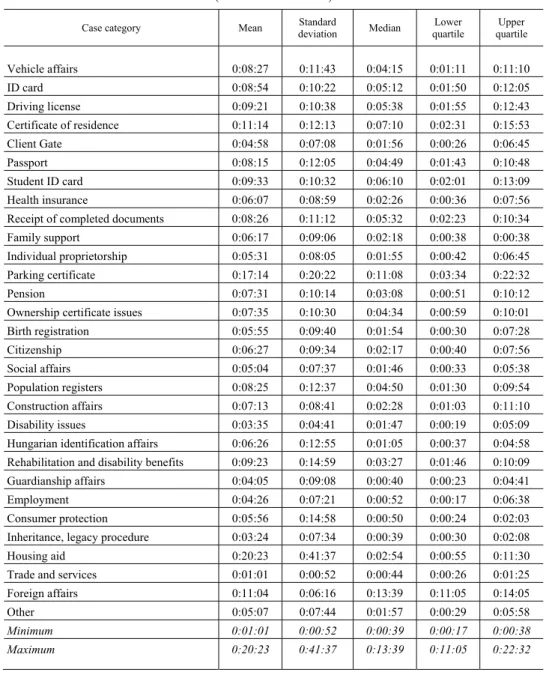
Table 3 and Figure 4 present the main waiting time statistics by case category.
Citizens who went to the government window to administer trade- and services- related matters had to wait the shortest amount of time (0:01:01) on average, while those who had housing aid-related issues had to wait the longest (0:20:23). However, these case categories together accounted for only 0.03% of the cases in the study period. Based on the upper quartile, 75% of the citizens arranging affairs in the government window, waited less than 23 minutes regardless of case categories.
Table 3 Waiting time statistics by case category, 1 December 2016 – 31 November 2017
(hours:minutes:seconds)
Case category Mean Standard
deviation Median Lower
quartile Upper quartile
Vehicle affairs 0:08:27 0:11:43 0:04:15 0:01:11 0:11:10 ID card 0:08:54 0:10:22 0:05:12 0:01:50 0:12:05 Driving license 0:09:21 0:10:38 0:05:38 0:01:55 0:12:43 Certificate of residence 0:11:14 0:12:13 0:07:10 0:02:31 0:15:53 Client Gate 0:04:58 0:07:08 0:01:56 0:00:26 0:06:45 Passport 0:08:15 0:12:05 0:04:49 0:01:43 0:10:48 Student ID card 0:09:33 0:10:32 0:06:10 0:02:01 0:13:09 Health insurance 0:06:07 0:08:59 0:02:26 0:00:36 0:07:56 Receipt of completed documents 0:08:26 0:11:12 0:05:32 0:02:23 0:10:34 Family support 0:06:17 0:09:06 0:02:18 0:00:38 0:00:38 Individual proprietorship 0:05:31 0:08:05 0:01:55 0:00:42 0:06:45 Parking certificate 0:17:14 0:20:22 0:11:08 0:03:34 0:22:32 Pension 0:07:31 0:10:14 0:03:08 0:00:51 0:10:12 Ownership certificate issues 0:07:35 0:10:30 0:04:34 0:00:59 0:10:01 Birth registration 0:05:55 0:09:40 0:01:54 0:00:30 0:07:28 Citizenship 0:06:27 0:09:34 0:02:17 0:00:40 0:07:56 Social affairs 0:05:04 0:07:37 0:01:46 0:00:33 0:05:38 Population registers 0:08:25 0:12:37 0:04:50 0:01:30 0:09:54 Construction affairs 0:07:13 0:08:41 0:02:28 0:01:03 0:11:10 Disability issues 0:03:35 0:04:41 0:01:47 0:00:19 0:05:09 Hungarian identification affairs 0:06:26 0:12:55 0:01:05 0:00:37 0:04:58 Rehabilitation and disability benefits 0:09:23 0:14:59 0:03:27 0:01:46 0:10:09 Guardianship affairs 0:04:05 0:09:08 0:00:40 0:00:23 0:04:41 Employment 0:04:26 0:07:21 0:00:52 0:00:17 0:06:38 Consumer protection 0:05:56 0:14:58 0:00:50 0:00:24 0:02:03 Inheritance, legacy procedure 0:03:24 0:07:34 0:00:39 0:00:30 0:02:08 Housing aid 0:20:23 0:41:37 0:02:54 0:00:55 0:11:30 Trade and services 0:01:01 0:00:52 0:00:44 0:00:26 0:01:25 Foreign affairs 0:11:04 0:06:16 0:13:39 0:11:05 0:14:05 Other 0:05:07 0:07:44 0:01:57 0:00:29 0:05:58 Minimum 0:01:01 0:00:52 0:00:39 0:00:17 0:00:38 Maximum 0:20:23 0:41:37 0:13:39 0:11:05 0:22:32
0:00:00 0:02:53 0:05:46 0:08:38 0:11:31 0:14:24 0:17:17 0:20:10 0:23:02 Receipt of completed documents
Family support Individual proprietorship Parking certificate Pension Ownership certificate issues Birth registration Citizenship Social affairs Population registers Construction affairs Disability issues Hungarian identification affairs Rehabilitation and disability benefits Guardianship affairs Employment Consumer protection Inheritance, legacy procedure Housing aid Trade and services Foreign affairs Other
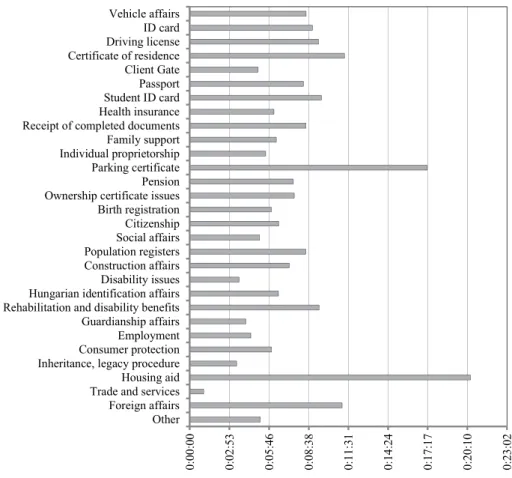
3.4. Processing time statistics
Processing time is calculated by subtracting call time from case closure time.
(For call time, see Subsection 3.3.) Case closure time denotes the time when the process is completed and the administrator closes the record in the system.
Table 4 and Figure 5 show processing time statistics by case category.
Trade- and services-related matters had the shortest processing time (0:05:43), but it took more than 33 minutes on average to receive completed documents (0:33:44).
Based on the upper quartile, regardless of case categories, 75% of the cases were processed in less than 48 minutes.
Table 4 Processing time statistics by case category, 1 December 2016 – 31 November 2017
(hours:minutes:seconds)
Case category Mean Deviation Median Lower
quartile Upper quartile
Vehicle affairs 0:19:28 0:21:49 0:12:23 0:05:35 0:25:12 ID card 0:17:00 0:18:47 0:12:26 0:04:02 0:21:35 Driving license 0:18:59 0:19:59 0:12:56 0:08:46 0:22:00 Certificate of residence 0:16:28 0:18:49 0:11:03 0:05:14 0:20:37 Client Gate 0:06:20 0:09:36 0:03:56 0:02:52 0:05:59 Passport 0:16:13 0:17:44 0:11:38 0:04:42 0:20:28 Student ID card 0:14:04 0:17:18 0:08:46 0:05:23 0:16:26 Health insurance 0:07:22 0:07:53 0:05:48 0:03:10 0:09:05 Receipt of completed documents 0:33:44 0:36:35 0:19:08 0:07:19 0:47:08 Family support 0:10:26 0:12:21 0:07:46 0:04:56 0:04:56 Individual proprietorship 0:10:17 0:12:39 0:06:20 0:03:02 0:12:06 Parking certificate 0:24:12 0:25:38 0:17:28 0:06:30 0:30:05 Pension 0:12:25 0:09:12 0:10:34 0:05:40 0:16:32 Ownership certificate issues 0:12:38 0:15:24 0:09:01 0:05:14 0:14:20 Birth registration 0:09:53 0:17:19 0:05:06 0:02:50 0:10:57
Citizenship 0:17:32 0:16:06 0:11:32 0:06:36 0:24:36 Social affairs 0:11:02 0:13:17 0:07:03 0:03:39 0:11:28
Population registers 0:22:44 0:29:57 0:10:14 0:02:53 0:31:24 Construction affairs 0:17:40 0:15:44 0:13:28 0:05:25 0:28:43 Disability issues 0:15:50 0:29:58 0:02:08 0:00:50 0:15:39 Hungarian identification affairs 0:13:29 0:26:34 0:01:40 0:00:58 0:04:05 Rehabilitation and disability benefits 0:14:53 0:11:38 0:11:49 0:06:36 0:20:55 Guardianship affairs 0:16:08 0:34:03 0:06:02 0:01:39 0:10:16 Employment 0:08:16 0:10:17 0:04:58 0:03:05 0:07:23 Consumer protection 0:23:12 0:41:22 0:05:41 0:01:16 0:28:38 Inheritance, legacy procedure 0:19:55 0:43:10 0:04:30 0:02:19 0:14:47 Housing aid 0:06:59 0:07:00 0:03:30 0:01:42 0:13:50 Trade and services 0:05:43 0:08:14 0:00:55 0:00:45 0:08:08 Foreign affairs 0:06:44 0:08:30 0:03:22 0:01:31 0:06:09 Other 0:10:19 0:16:46 0:04:47 0:01:42 0:10:50
Minimum 0:05:43 0:07:00 0:00:55 0:00:45 0:04:05
Maximum 0:33:44 0:43:10 0:19:08 0:08:46 0:47:08
0:00:00 0:07:12 0:14:24 0:21:36 0:28:48 0:36:00 Receipt of completed documents
Family support Individual proprietorship Parking certificate Pension Ownership certificate issues Birth registration Citizenship Social affairs Population registers Construction affairs Disability issues Hungarian identification affairs Rehabilitation and disability benefits Guardianship affairs Employment Consumer protection Inheritance, legacy procedure Housing aid Trade and services Foreign affairs Other
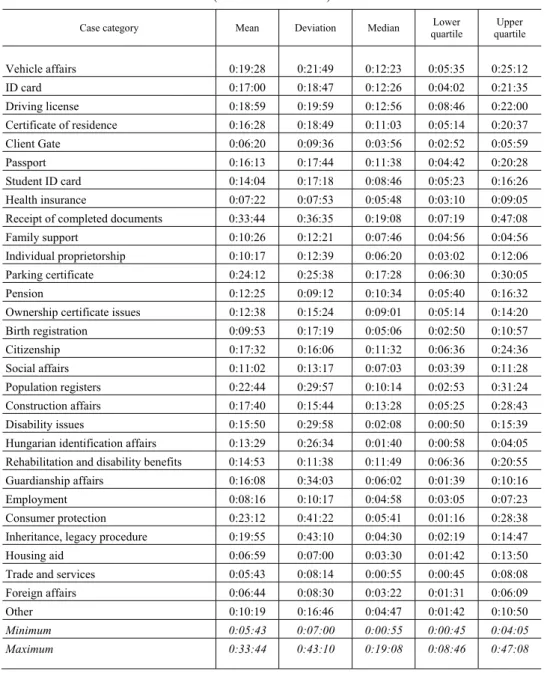
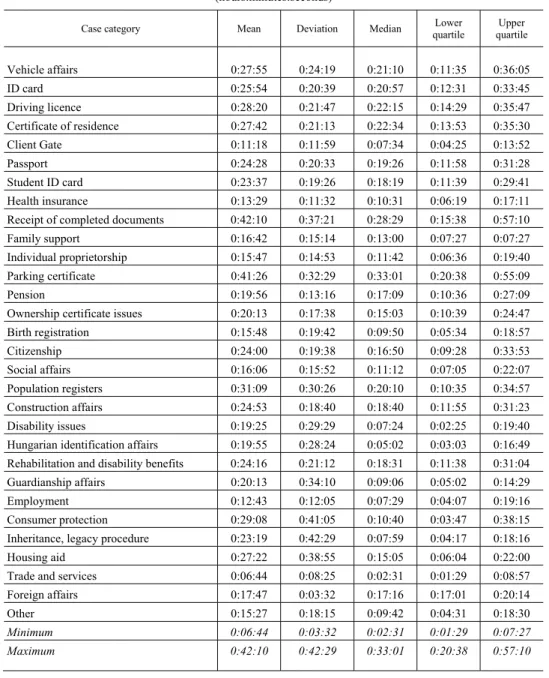
3.5. Lead time statistics
Lead time is calculated by subtracting arrival time from case closure time.
(For arrival and case closure times, see Subsections 3.3. and 3.4.) Table 5 and Figure 6 present the main lead time statistics by case category. While trade- and services-related affairs took the shortest amount of lead time (0:06:44), the ‘receipt of completed documents’ case category took the longest (0:42:10). However, these two case categories together represented only 2.24% of the cases in the study period.
According to the upper quartile, 75% of the citizens administered matters in the government window spent less than 58 minutes there after arrival, regardless of case categories.
Table 5 Lead time statistics by case category, 1 December 2016 – 31 November 2017
(hours:minutes:seconds)
Case category Mean Deviation Median Lower
quartile Upper quartile
Vehicle affairs 0:27:55 0:24:19 0:21:10 0:11:35 0:36:05 ID card 0:25:54 0:20:39 0:20:57 0:12:31 0:33:45 Driving licence 0:28:20 0:21:47 0:22:15 0:14:29 0:35:47 Certificate of residence 0:27:42 0:21:13 0:22:34 0:13:53 0:35:30 Client Gate 0:11:18 0:11:59 0:07:34 0:04:25 0:13:52 Passport 0:24:28 0:20:33 0:19:26 0:11:58 0:31:28 Student ID card 0:23:37 0:19:26 0:18:19 0:11:39 0:29:41 Health insurance 0:13:29 0:11:32 0:10:31 0:06:19 0:17:11 Receipt of completed documents 0:42:10 0:37:21 0:28:29 0:15:38 0:57:10 Family support 0:16:42 0:15:14 0:13:00 0:07:27 0:07:27 Individual proprietorship 0:15:47 0:14:53 0:11:42 0:06:36 0:19:40 Parking certificate 0:41:26 0:32:29 0:33:01 0:20:38 0:55:09 Pension 0:19:56 0:13:16 0:17:09 0:10:36 0:27:09 Ownership certificate issues 0:20:13 0:17:38 0:15:03 0:10:39 0:24:47 Birth registration 0:15:48 0:19:42 0:09:50 0:05:34 0:18:57
Citizenship 0:24:00 0:19:38 0:16:50 0:09:28 0:33:53 Social affairs 0:16:06 0:15:52 0:11:12 0:07:05 0:22:07
Population registers 0:31:09 0:30:26 0:20:10 0:10:35 0:34:57 Construction affairs 0:24:53 0:18:40 0:18:40 0:11:55 0:31:23 Disability issues 0:19:25 0:29:29 0:07:24 0:02:25 0:19:40 Hungarian identification affairs 0:19:55 0:28:24 0:05:02 0:03:03 0:16:49 Rehabilitation and disability benefits 0:24:16 0:21:12 0:18:31 0:11:38 0:31:04 Guardianship affairs 0:20:13 0:34:10 0:09:06 0:05:02 0:14:29 Employment 0:12:43 0:12:05 0:07:29 0:04:07 0:19:16 Consumer protection 0:29:08 0:41:05 0:10:40 0:03:47 0:38:15 Inheritance, legacy procedure 0:23:19 0:42:29 0:07:59 0:04:17 0:18:16 Housing aid 0:27:22 0:38:55 0:15:05 0:06:04 0:22:00 Trade and services 0:06:44 0:08:25 0:02:31 0:01:29 0:08:57 Foreign affairs 0:17:47 0:03:32 0:17:16 0:17:01 0:20:14 Other 0:15:27 0:18:15 0:09:42 0:04:31 0:18:30
Minimum 0:06:44 0:03:32 0:02:31 0:01:29 0:07:27
Maximum 0:42:10 0:42:29 0:33:01 0:20:38 0:57:10
0:00:00 0:07:12 0:14:24 0:21:36 0:28:48 0:36:00 0:43:12 0:50:24 Health insurance
Receipt of completed documents Family support Individual proprietorship Parking certificate Pension Ownership certificate issues Birth registration Citizenship Social affairs Population registers Construction affairs Disability issues Hungarian identification affairs Rehabilitation and disability benefits Guardianship affairs Employment Consumer protection Inheritance, legacy procedure Housing aid Trade and services Foreign affairs Other
Waiting time Processing time
4. Statistical analysis of contact affair procedures
Contact affair procedures of guardianship offices differ from the front office operations of government windows in several aspects. The first significant difference is the repeatability of the procedure in any given case, which is the main reason why such cases are so complex. A case starts with the first submission; however, the par- ties may also make further ones. Thus, several iterations of the procedure can run
simultaneously in each case, which can be closed if no further submissions are made and a decision has been reached regarding the last submission. This makes the con- tact affair procedures significantly longer and more complex than government win- dow operations, and not to mention the fact that administrators need to handle sever- al cases simultaneously.
Another main difference is that while we had a large, structured dataset con- taining time-related data for the front office operations of government windows, we did not have such a dataset for the contact affair procedures. In these latter proce- dures, only the case numbers and their sub-numbers can identify the individual cases.
Each submission has a timestamp; however, as there is no structured dataset with the necessary details, in each case we had to, as the administrators, manually collect data and create a raw dataset.
In the current phase of the research, we conducted seven expert in-depth inter- views with the head and the colleagues of the Guardianship Office of the Győr- Moson-Sopron County Government Office. During the analysis of the process, it became evident that the important time factors of contact affair procedures were not indicated in the provided descriptions. Furthermore, those procedural elements that may repeat or induce a further delay in the procedure were also not indicated.
For example, one cannot see if the different parties had to be summoned during the procedure, which may take a long time due to posting and notification, and may increase the duration of the procedure by two weeks.
The hearing of the experts (doctors, psychologists, teachers, and kindergarten- teachers) also takes a long time and slows down the procedure, making the case clo- sure in time a challenge. During the procedure, the assistance of a mediator may also be needed, which can be asked by each affected party or can be offered by the ad- ministrator. However, the administrators often do not choose this option as they are certain that the procedure cannot be finished within 60 days if mediation is involved.
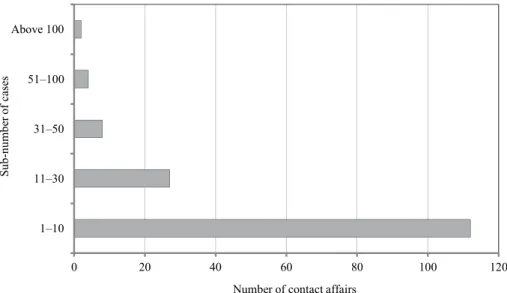
4.1. Distribution of cases
Figures 7 illustrates the complexity of the contact affairs in the Guardianship Office of the Győr-Moson-Sopron County Government Office, in 2017. Each case is divided into sub-numbers, which means that the parties have made several submis- sions during the procedures. The higher the sub-numbers, the more complex and longer the case is and the more it annoys the participants. It is a ‘vicious’ circle from which it is hard to quit.
0 20 40 60 80 100 120 1–10
11–30 31–50
Number of contact affairs
Sub-number o
Figure 8. Sub-numbers of the contact affairs of patchwork families in the Guardianship Office of the Győr-Moson-Sopron County Government Office, 2017
109 81
28 48
95
58 133
37 14
2
11 10
112
6 5 6
0 20 40 60 80 100 120 140
M-01 M-02 M-03 M-04 M-05 M-06 M-07 M-08 M-09 M-10 M-11 M-12 M-13 M-14 M-15 M-16
Sub-number of cases
Anonymised case number of contact affairs
Figure 8 presents the sub-numbers of the cases in which patchwork families were involved in 2017. According to the administrators, the service offered by the guardianship office is most often used by this type of family to settle issues. By sort-
ing the sub-numbers of the cases, it appears that the affairs of patchwork families are more difficult to settle on time; and consequently, there are more files and the admin- istrators’ workload is higher.
4.2. Processing time statistics
The next step was to analyse a single contact affair case by defining the length of the various steps (procedures) and the number of the procedure iterations.
We chose the most complex case, which included 133 sub-numbers and 22 procedure iterations. Figure 9 shows the length of each procedure iteration.
Figure 9. Length of the procedure iterations in a contact affair case, 9 March 2017 – 13 November 2017
21 24
29 21
20 36
32
22 22 25
18 25
0 30
10 51 49 47
16 41 41
47
0 10 20 30 40 50 60
1 2 3 4 5 6 7 8 9 10 11 12 13 14 15 16 17 18 19 20 21 22
Length of procedure iterations (days)
Number of procedure iterations
In this contact affair case, several applications and appeals against previous de- cisions were submitted by the separated parents, which started 22 relating proce- dures. It took 8 months from the submission of the first application (9th of March 2017) to the closure of the entire case (13th of November 2017). According to the timestamps, several applications were filed in parallel on certain days, and a couple of them were submitted before the previous procedure iteration(s) was/were finished, which resulted in several pending procedures.
In this subsection, we have presented the data of one specific case. However, administrators deal with several active cases at the same time, and each case has at least one running procedure.
sion and submit an appeal or a new application. Table 6 shows the start and end dates of the iterations and in Figure 10 we can see the Gantt chart of the whole process which needed 249 days to reach the final submission and to be closed by a decision.
Table 6 Start and end dates of the procedure iterations in a contact affair case,
9 March 2017 – 13 November 2017 Number of
iterations Date of submission of
the application Date of decision
1. 2017.03.09 2017.03.30
2. 2017.03.28 2017.04.21
3. 2017.03.28 2017.04.26
4. 2017.04.04 2017.04.25
5. 2017.05.02 2017.05.22
6. 2017.05.03 2017.06.08
7. 2017.05.19 2017.06.20
8. 2017.06.08 2017.06.30
9. 2017.06.08 2017.06.30
10. 2017.06.12 2017.07.07
11. 2017.06.12 2017.06.30
12. 2017.06.30 2017.07.25
13. 2017.07.27 2017.07.27
14. 2017.08.02 2017.09.01
15. 2017.08.07 2017.08.17
16. 2017.08.14 2017.10.04
17. 2017.08.16 2017.10.04
18. 2017.08.30 2017.10.16
19. 2017.08.31 2017.09.16
20. 2017.09.05 2017.10.16
21. 2017.09.05 2017.10.16
22. 2017.09.27 2017.11.13
Total lead time 249 days
Figure 10 shows that two or three iterations were ‘running’ simultaneously during the lead time (from 9th of March 2017 to the closure 13th of November 2017).
The level of complexity of the iterations continued to rise from September because several new appeals were submitted in response to the previous decisions.
Figure 10. Gantt chart of the procedure iterations in a contact affair case, 9 March 2017 – 13 November 2017
03.09 03.29 04.18 05.08 05.28 06.17 07.07 07.27 08.16 09.05 09.25 10.15 11.04
1.
2.
3.
4.
5.
6.
7.
8.
9.
10.
11.
12.
13.
14.
15.
16.
17.
18.
19.
20.
21.
22.
Date
Number of iterations
5. Conclusion
This study uses the front office operations of a capital city government window and the contact affair procedures of the Guardianship Office of the Győr-Moson- Sopron County Government Office as examples to demonstrate how the time-related KPIs, commonly used in the industry, can be measured in the public service and can be statistically analysed, regardless of the type and complexity of the service.
The system of the government windows, established in 2013, has implemented the one-stop-shop system in Hungary and has been operating as a centralised, uni- form service centre network ever since. From the citizens’ perspective, the develop- ment of these service centres was the most noticeable consequence of the transfor-
process modelling, two types of service were described, mapped and visualised.
The second part of the study examined how to extract the data needed for KPI meas- urement from different datasets. The data from a government window located in the capital city of Budapest, were collected and statistically analysed. The dataset con- tains the arrival, call and case closure times of 45,234 cases recorded from the 1st of December 2016 to 31st of November 2017, and from these, waiting, processing and lead times were calculated. The 2017 contact affair procedures of a guardianship office were also examined with a detailed analysis of a complex case. This specific case highlights the complexity of the contact affair procedures: customers may sub- mit several applications and appeals against previous decisions, which can trigger the same procedure multiple times, consequently in the aforementioned example it took almost a year to close the case.
Our study contributes to the literature by using the performance measurement indicators of the private sector and industry in public service processes of various characteristics and complexity. It presents how these common KPIs can be measured in different conditions to provide valuable insights into service processes and to help legislators to increase efficiency and effectiveness of services. The differences be- tween the studied service types are obvious both in terms of customers and com- plexity. Nevertheless, the chosen KPIs could be measured in both cases, and the efforts exerted were depending on the available dataset.
References
ATKINSON,H.–BROWN,J. [2001]: Rethinking performance measures: Assessing progress in UK hotels. International Journal of Contemporary Hospitality Management. Vol. 13. No. 3.
pp. 128–136. https://doi.org/10.1108/09596110110388918
BOURNE,M.–MILLS,J.–WILCOX,M.–NEELY,A.–PLATTS,K. [2000]: Designing, implementing and updating performance measurement systems. International Journal of Operations &
Production Management. Vol. 20. No. 7. pp. 754–771. https://doi.org/10.1108/
01443570010330739
BRIGNALL,T.J.–FITZGERALD,L.–JOHNSTON,R.–SILVESTRO,R. [1991]: Performance measure- ment in service businesses. Management Accounting. Vol. 69. No. 10. pp. 34–36.
BROWN,J.–MCDONNELL,B. [1995]: The balanced scorecard: Short-term guest or long-term resi- dent? International Journal of Contemporary Hospitality Management. Vol. 7. Nos. 2–3.
pp. 7–11. https://doi.org/10.1108/09596119510146751
BUICS,L.–EISINGER BALASSA,B. [2020]: Analyzing public service processes from customer and employee perspectives by using service blueprinting and business process model- ling. Proceedings of the ENTRENOVA - ENTerprise REsearch InNOVAtion Conference (Online). Vol. 6. No. 1. pp. 195–211.
BUICS, L.–SÜLE, E. [2020]: Service process excellence in public services. Proceedings of the ENTRENOVA – ENTerprise REsearch InNOVAtion Conference (Online). Vol. 6. No. 1.
pp. 173–186.
IBRAHIM, J. E. [2001]: Performance indicators from all perspectives (Editorial). International Journal for Quality in Health Care. Vol. 13. No. 6. pp. 431–432.
https://doi.org/10.1093/intqhc/13.6.431
KAPLAN,R.S.–NORTON,D.P. [2001]: The Strategy-Focused Organization. How Balanced Score- card Companies Thrive in the New Business Environment. Harvard Business School Press.
Boston.
KAPLAN, R. S. – NORTON, D. P. [2004]: Strategy Maps: Converting Intangible Assets into Intangible Outcomes. Harvard Business School Press. Boston.
KAZEMZADEH,Y.–MILTON,S.K.–JOHNSON,L.W. [2015a]: Service blueprinting and process- chain-network (PCN): An ontological comparison. International Journal of Qualitative Research in Services. Vol. 2. No. 1. pp. 1–12. https://doi.org/10.1504/IJQRS.2015.069775 KAZEMZADEH,Y.–MILTON,S.K.–JOHNSON,L. [2015b]: A conceptual comparison of service
blueprinting and business process modeling notation (BPMN). Asian Social Science.
Vol. 11. No. 12. pp. 307–318. https://doi.org/10.5539/ass.v11n12p307
KAZEMZADEH,Y.–MILTON,S.K.–JOHNSON,L. [2015c]: An explication of three service business process modeling approaches. Australian Journal of Business and Economic Studies. Vol. 1.
No. 2. pp. 40–53.
KAZEMZADEH, Y. –MILTON, S.K. –JOHNSON, L. [2015d]: Process chain network (PCN) and business process modeling notation (BPMN): A comparison of concepts. Journal of Management and Strategy. Vol. 6. No. 1. pp. 88–99. https://doi.org/10.5430/jms.v6n1p88 KO,R.K.L.–LEE,S.S.G.–LEE,E.W. [2009]: Business process management (BPM) standards:
A survey. Business Process Management Journal. Vol. 15. No. 5. pp. 744–791.
https://doi.org/10.1108/14637150910987937
KOVÁCS, É. – HAJNAL, GY. [2013]: Analyzing the Motives of Reforming Central Government Coordination in Hungary: A Case Study of One-Stop-Government Reforms. XVII IRSPM Conference. 10–12 April. Prague.
KOVÁCS, É.–HAJNAL, GY. [2014]: Government Windows: One Stop Shops for Administrative Services in Hungary. Palgrave Macmillan. London. https://doi.org/
10.1057/9781137359636_20
KOVÁCS, É. –HAJNAL, GY. [2016]: Analyzing the motives of reforming customer services in Hungarian public administration: A case study of one-stop-government reforms.
In: DiMauro, C. – Ancarani, A. – Vastag, G. (eds.): Research in the Decision. Pearson.
London. pp. 5–32.
national Conference on Advanced Information Systems Engineering, 16–20 June. Springer.
Montpellier. pp. 465–479.
NEELY, A. – MILLS, J. – PLATTS, K. – RICHARDS, H. – GREGORY, M. – BOURNE, M. – KENNERLEY,M. [2000]: Performance measurement system design: Developing and testing a process-based approach. International Journal of Operations and Production Management.
Vol. 20. No. 10. pp. 1119–1145. https://doi.org/10.1108/01443570010343708
NEELY,A. [2005]: The evolution of performance measurement research. International Journal of Operations and Production Management. Vol. 5. No. 12. pp. 1264–1277.
https://doi.org/10.1108/01443570510633648
PARASURAMAN,A.–ZEITHAML,V.A.–BERRY,L.L. [1985]: A conceptual model of service quality and its implications for future research. Journal of Marketing. Vol. 49. Fall. pp. 41–50.
https://doi.org/10.1177/002224298504900403
RAMSEOOK-MUNHURRUN,P.–LUKEA-BHIWAJEE,S.D.–NAIDOO,P. [2010]: Service quality in the public service. International Journal of Management and Marketing Research. Vol. 3.
No. 1. pp. 37–50.
RANDALL, L. – SENIOR, M. [1994]: A model for achieving quality in hospital hotel services.
International Journal of Contemporary Hospital Management. Vol. 6. Nos. 1–2. pp. 68–74.
https://doi.org/10.1108/09596119410052161
RECKER, J. [2010]: Opportunities and constraints: The current struggle with BPMN. Business Process Management Journal. Vol. 16. No. 1. pp. 181–201. https://doi.org/
10.1108/14637151011018001
RECKER, J. [2011]: Evaluations of Process Modeling Grammars: Ontological, Qualitative and Quantitative Analyses Using the Example of BPMN. Springer Science & Business Media.
Berlin.
REICHHELD,F.F.–SASSER,W.E. [1990]: Zero defections: Quality comes to services. Harvard Business Review. Vol. 68. No. 5. pp. 105–111.
RICHARD,P.–DEVINNEY,T.–YIP,G.–JOHNSON,G. [2009]: Measuring organizational perfor- mance: Towards methodological best practice. Journal of Management. Vol. 35. No. 3.
pp. 718–804. https://doi.org/10.1177/0149206308330560
ROBINSON,L. [2003]: Committed to quality: The use of quality schemes in UK public leisure services. Managing Service Quality. Vol. 13. No. 3. pp. 247–255.
https://doi.org/10.1108/09604520310476508
SAMPSON, S.E.–FROEHLE, C.M. [2006]: Foundations and implications of a proposed unified services theory. Production and Operations Management. Vol. 15. No. 2. pp. 329–343.
https://doi.org/10.1111/j.1937-5956.2006.tb00248.x