International Journal of
Molecular Sciences
Article
Physicochemical Characterization and Drug Release Properties of Methyl-Substituted Silica Xerogels Made Using
Sol–Gel Process
Adél Len1,2 , Giuseppe Paladini3 , Loránd Románszki4 , Ana-Maria Putz5 , LászlóAlmásy1 , Krisztina László6 , Szabolcs Bálint7, Andraž Krajnc8, Manfred Kriechbaum9 , Andrei Kuncser10 , József Kalmár11 and Zoltán Dudás1,5,*
Citation: Len, A.; Paladini, G.;
Románszki, L.; Putz, A.-M.; Almásy, L.; László, K.; Bálint, S.; Krajnc, A.;
Kriechbaum, M.; Kuncser, A.; et al.
Physicochemical Characterization and Drug Release Properties of Methyl-Substituted Silica Xerogels Made Using Sol–Gel Process.Int. J.
Mol. Sci.2021,22, 9197. https://
doi.org/10.3390/ijms22179197
Academic Editors:Ádám Juhász and Edit Csapó
Received: 3 August 2021 Accepted: 22 August 2021 Published: 25 August 2021
Publisher’s Note:MDPI stays neutral with regard to jurisdictional claims in published maps and institutional affil- iations.
Copyright: © 2021 by the authors.
Licensee MDPI, Basel, Switzerland.
This article is an open access article distributed under the terms and conditions of the Creative Commons Attribution (CC BY) license (https://
creativecommons.org/licenses/by/
4.0/).
1 Neutron Spectroscopy Department, Centre for Energy Research, Konkoly-Thege 29-33, 1121 Budapest, Hungary; len.adel@ek-cer.hu (A.L.); almasy.laszlo@ek-cer.hu (L.A.)
2 Faculty of Engineering and Information Technology, University of Pécs, Boszorkány Str 2, 7624 Pécs, Hungary
3 Department of Mathematical and Computer Sciences, Physical Sciences and Earth Sciences,
University of Messina, Viale Ferdinando Stagno D’Alcontres 31, 98166 Messina, Italy; gpaladini@unime.it
4 Functional Interfaces Research Group, Institute of Materials and Environmental Chemistry, Research Centre for Natural Sciences, Hungarian Academy of Sciences, Magyar Tudósok Körútja 2, 1117 Budapest, Hungary; romanszki.lorand@ttk.hu
5 “Coriolan Drăgulescu” Institute of Chemistry Timisoara, 24 Mihai Viteazul Ave., 300223 Timisoara, Romania;
lacramaanamaria@yahoo.com
6 Department of Physical Chemistry and Materials Science, Budapest University of Technology and Economics, 1521 Budapest, Hungary; laszlo.krisztina@vbk.bme.hu
7 Semilab Semiconductor Physics Laboratory Co. Ltd., 4/A Prielle Kornelia Str., 1117 Budapest, Hungary;
szabolcs.balint@semilab.hu
8 Department of Inorganic Chemistry and Technology, National Institute of Chemistry, Hajdrihova 19, 1001 Ljubljana, Slovenia; andraz.krajnc@ki.si
9 Institute of Inorganic Chemistry, Graz University of Technology, Stremayrgasse 9, 8010 Graz, Austria;
manfred.kriechbaum@tugraz.at
10 National Institute of Materials Physics, 405A Atomistilor Street, 077125 Magurele, Romania;
andrei.kuncser@infim.ro
11 MTA-DE ELKH Homogeneous Catalysis and Reaction Mechanisms Research Group,
Department of Inorganic and Analytical Chemistry, University of Debrecen, Egyetem tér 1, 4032 Debrecen, Hungary; kalmar.jozsef@science.unideb.hu
* Correspondence: dudas.zoltan@ek-cer.hu; Tel.: +36-1-392-2222 (ext. 1849)
Abstract: In this work, a multi-analytical approach involving nitrogen porosimetry, small angle neutron and X-ray scattering, Fourier transform infrared (FTIR) and nuclear magnetic resonance (NMR) spectroscopies, X-ray diffraction, thermal analysis and electron microscopy was applied to organically modified silica-based xerogels obtained through the sol–gel process. Starting from a tetraethoxysilane (TEOS) precursor, methyltriethoxysilane (MTES) was added to the reaction mixture at two different pH values (2.0 and 4.5) producing hybrid xerogels with different TEOS/MTES molar ratios. Significant differences in the structure were revealed in terms of the chemical composition of the silica network, hydrophilic/hydrophobic profile, particle dimension, pore shape/size and surface characteristics. The combined use of structural characterization methods allowed us to reveal a relation between the cavity dimensions, the synthesis pH value and the grade of methyl substitution.
The effect of the structural properties on the controlled Captopril release efficiency has also been tested. This knowledge facilitates tailoring the pore network for specific usage in biological/medical applications. Knowledge on structural aspects, as reported in this work, represents a key starting point for the production of high-performance silica-based hybrid materials showing enhanced efficacy compared to bare silica prepared using only TEOS.
Keywords: hybrid silica materials; sol–gel technique; structural characterization; nanostructure;
controlled release; Captopril
Int. J. Mol. Sci.2021,22, 9197. https://doi.org/10.3390/ijms22179197 https://www.mdpi.com/journal/ijms
Int. J. Mol. Sci.2021,22, 9197 2 of 22
1. Introduction
To meet the challenges of medical, pharmaceutical, cosmetic industry, renewable en- ergy and environmental science, the application of interdisciplinary knowledge has become vital [1–6]. The sol–gel technique is one of the most suitable and employed techniques to develop porous structures of oxide materials for the applications mentioned [7–11].
The preparation of silica materials traditionally uses silicon alkoxides (tetramethoxysi- lane (TMOS), tetraethoxysilane (TEOS)) or sodium silicate as precursors [12–14]. By in- troducing organically modified silica precursors in the synthesis process, the resistance to mechanical stress and the hydrophobicity of the obtained silica gels can be improved.
The most used substituted silica precursors for the bare silica functionalization are methyl- triethoxysilane (MTES) or methyltrimethoxysilane (MTMS). The recent developments on hybrid silica materials have proven the utility and applicability of MTES and MTMS pre- cursors in the following various fields: gas storage and separation [15,16], biocatalysis [17], corrosion protection [18], adsorption of organic solvents [19]. The final product properties are simultaneously influenced by synthesis temperature, solvent type, pH, concentration, catalyst, as well as aging and drying parameters [20,21]. The silica network formation follows several sequential pH-dependent steps including precursor hydrolysis, monomers polycondensation, solid particles creation, particle growth, particle aggregation and the strengthening of the gel network by aging and drying [22,23]. The use of acid or base cat- alyzed sol–gel routes modifies the primary particle formation pathway, implying different particle shapes. The hydrolysis achieves the lowest reaction rate at pH = 7. For exam- ple, at pH < 7, it is well-known that hydrolysis and condensation occur successively, the polycondensation process mechanism consists of cluster–cluster aggregation and primary particles are represented by linear or weakly branched polymer chains. However, under basic conditions (pH > 7), hydrolysis and condensation occur simultaneously, the silica polycondensation follows cluster–particle mechanism and primary silica particles look similar to highly branched clusters. Fluoride anions play an important role as sol–gel process catalysts by significantly increasing the rate of condensation reactions.
MTES has a lower affinity towards a hydrolysis reaction compared to tetrafunctional tetraalkoxy-precursors, the Si–C bond being inert to hydrolysis. The final physicochem- ical properties of the hybrid organic–inorganic materials depend on the extent of the hydrolysis–condensation reactions, the branching degree of the polymers and the gel ho- mogeneity. Consequently, it is important that the methyltriethoxysilane behavior in the sol–gel environment be deeply studied.
Spectroscopic techniques such as UV–Vis [24], FTIR [25–27], Raman [27] and MS [28]
proved to be proper and fundamental tools to study the hydrolysis/condensation reactions, essential for the silica network formation, starting from a methyl-substituted silica (co- )precursor. The influence of different solvents (methanol, ethanol, 1,4-dioxane, acetone) and synthesis temperature upon the kinetic of hydrolysis reaction was followed by FTIR [29].
As expected, higher temperatures promote the hydrolysis of the precursors. Interesting behavior of the MTES was determined in case of each parental solvent (methanol and ethanol). The reaction rate constant was five times higher in methanol than in ethanol [29].
Even though the methyl-substituted silica materials showed superhydrophobic behavior, surface hydroxyl groups were identified using FTIR [30].
In silica aerogels, 20% of the TEOS replacement with MTES increases the apparent surface area [31]. By increasing the MTES/TEOS molar ratio, the gelation time and the final product’s hydrophobicity also increase. At the same time, the particle size, density, apparent surface area and surface roughness decrease [32]. Recently, our group reported that the gradually methyl functionalized silica xerogels synthesized at pH = 3 and pH
= 4 showed similar porosity and particle size alterations at the meso/micro level [33].
Methyl-substituted TEOS systems have been studied using nitrogen porosimetry [34], TGA/DTA [35], FTIR [36], NMR [37], XPS [38], XRD [39] and inelastic neutron scatter- ing [40,41]. To the best of our knowledge, few results have been reported about the physicochemical characterization of methyl-substituted silica gels.
Int. J. Mol. Sci.2021,22, 9197 3 of 22
The presence of methyl groups in the silica gel structure was clearly distinguished in the spectrum by the presence of peaks related to the different vibrational modes of the Si–CH3bond [42]. The29Si-NMR spectroscopy offered complementary information about the level of the hydrolysis and condensation on the silica gels, both in the solution and solid phase [43]. X-ray photoelectron spectroscopy (XPS) was used for quantitative elemental analysis. Comparing calculated and experimental atomic ratios for the TEOS-derived gels and those synthetized from TEOS/MTES mixtures, the differences were significantly diminished for the methyl-substituted gels, meaning that the residual solvent content is lower in the methyl-substituted gels [38].
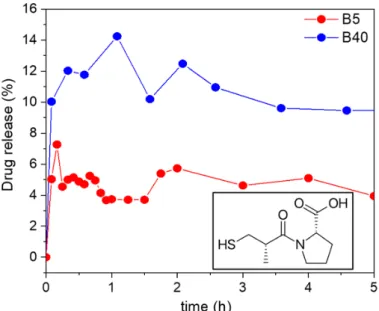
Captopril is highly water soluble, unstable in an alkaline pH and its bioavailability decreases in the presence of food [44]. To avoid these drawbacks, solid carriers can be used to improve the therapeutic efficacy and reduce the side effects of the drug [45]. A variety of carriers, such as porous metal oxides [46], micelles [47], hydrogels [48], biopolymers [49]
and silica [50,51] have been employed as vehicles for Captopril delivery. In addition to these characteristics, mesoporous silica proved to be a promising drug carrier due to its excellent biocompatibility, high stability, large apparent surface area and the ease of surface functionalization.
The most innovative research works in this field focus on the design and fine tuning of these systems for different applications, especially for medical and pharmacological ones. The aim of the present study was to evaluate the influence of the pH and the effect of the introduction of organic moieties (methyl groups) on the performance of the materials. The silica xerogels were obtained using the sol–gel process and characterized using various methods in terms of composition (FTIR, XRD), texture and morphological properties (nitrogen adsorption, SAS, electron microscopy), hydrophobicity (contact angle) and thermal stability (thermal analysis). Taking into account the structural properties, selected materials were tested as controlled release carriers for Captopril. The relationship between the textural properties of the silica support and the drug loading and release efficiency was evaluated.
2. Results and Discussion
In this section, the results obtained on the methyl-substituted silica gels are presented.
The A and B labels represent the gels obtained at pH = 2.0 and pH = 4.5, respectively.
These two pH values were chosen taking into account the pH value where the point of zero charge is found and the lowest condensation rate is taking place [52,53]. The percentage (%) is the substitution grade (see detailed description in Section3.1).
2.1. Gelation Time
One possible future application of the silica gels is as host materials for biomolecules, especially enzymes. In order to preserve the high activity of the immobilized biologically active guest molecules, short gelation time is one of the key factors of the encapsulation process. Gelation time is affected by all the synthesis parameters.
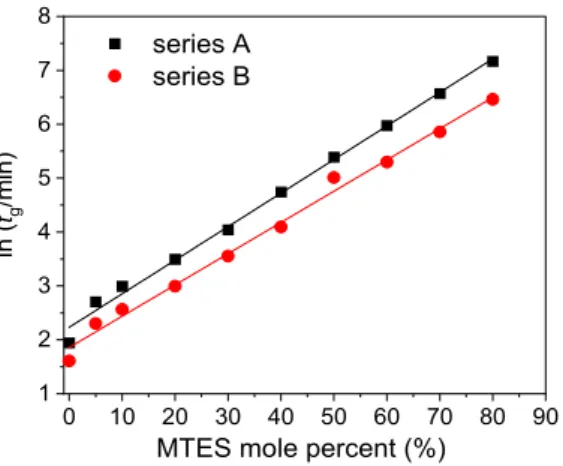
In the present paper, the studied factors that influence the gelation time were the precursors’ molar ratio and type, and the pH. Rios and coworkers used the same precursor ratio, but the gelation time was much longer than in the present case [32]. Figure1reports the evolution of the gelation time of all the investigated silica samples using different amount of MTES and catalysts.
Int. J. Mol. Sci.2021,22, 9197 4 of 22
Int. J. Mol. Sci. 2021, 22, x FOR PEER REVIEW 4 of 23
0 10 20 30 40 50 60 70 80 90 1
2 3 4 5 6 7 8
series A series B
ln (tg/min)
MTES mole percent (%)
Figure 1. Gelation time (tg) as a function of the MTES/TEOS molar ratio at two catalyst concentra- tions (series A and series B labels represent the pH = 2.0 and pH = 4.5).
2.2. Low-Temperature Nitrogen Adsorption/Desorption
In order to characterize the porous texture of the synthetized gels, low-temperature nitrogen adsorption has also been applied (see adsorption/desorption isotherms in Figure 2a and Figure S1).
For series B, a transition caused by the increasing amount of MTES was observed, the hysteresis loop changed from Type H3 to H2a. Type H3 hysteresis was found for the non- substituted sample, characteristic for large cone-like pores [54,55]. A small addition of MTES (B5) caused the change of the H3 loop to H2a-type hysteresis. Starting from sample B5, a larger amount of mesopores developed, which had gradually been changing up to the B60 sample: the size of the mesopores narrowed and their proportion reduced. The volume of the mesopores decreased, and the volume of micropores increased. The highest methyl substituted samples from the B series showed the H4 hysteresis type.
Almost all the methyl-substituted gels showed a higher surface area than the samples without substitution (Table S1). For series B, an inverse parabolic evolution of the apparent surface area could be observed, with a maximum at 40% MTES content (Figure 2b).
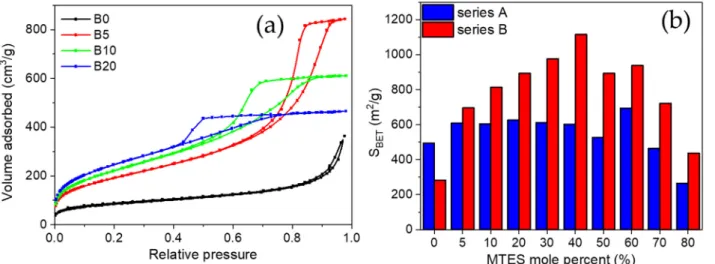
Figure 2. (a) Evolution of low-temperature nitrogen adsorption/desorption isotherms with MTES content. (b) Comparison between the apparent surface area evolution with the MTES mole percent and the acid catalysts content (series A and series B labels represent the pH = 2.0 and pH = 4.5).
The surface area of 1115 m2/g was comparable to the values obtained for silica aero- gels or ordered mesoporous silica [56,57]. For series A, a completely different evolution was observed: except the highest MTES substitution, an almost constant surface area was obtained. The majority of the samples possessed a surface area of ~600 m2/g. The average Figure 1.Gelation time (tg) as a function of the MTES/TEOS molar ratio at two catalyst concentrations (series A and series B labels represent the pH = 2.0 and pH = 4.5).
The gelation time exponentially increased with the MTES molar ratio, and a shorter gelation time was observed for the gels prepared at a less acidic pH.
2.2. Low-Temperature Nitrogen Adsorption/Desorption
In order to characterize the porous texture of the synthetized gels, low-temperature nitrogen adsorption has also been applied (see adsorption/desorption isotherms in Figure 2a and S1).
For series B, a transition caused by the increasing amount of MTES was observed, the hysteresis loop changed from Type H3 to H2a. Type H3 hysteresis was found for the non-substituted sample, characteristic for large cone-like pores [54,55]. A small addition of MTES (B5) caused the change of the H3 loop to H2a-type hysteresis. Starting from sample B5, a larger amount of mesopores developed, which had gradually been changing up to the B60 sample: the size of the mesopores narrowed and their proportion reduced. The volume of the mesopores decreased, and the volume of micropores increased. The highest methyl substituted samples from the B series showed the H4 hysteresis type.
Almost all the methyl-substituted gels showed a higher surface area than the samples without substitution (Table S1). For series B, an inverse parabolic evolution of the apparent surface area could be observed, with a maximum at 40% MTES content (Figure2b).
The surface area of 1115 m2/g was comparable to the values obtained for silica aerogels or ordered mesoporous silica [56,57]. For series A, a completely different evolution was observed: except the highest MTES substitution, an almost constant surface area was obtained. The majority of the samples possessed a surface area of ~600 m2/g. The average pore size diameter is presented in Figure3. Cylindrical pore geometry was assumed. For series A, the pores were smaller than 5 nm in diameter; however, for series B, the pores size decreased with the increasing MTES percentage. Very high pore diameter values (above 10 nm) were obtained for the lowest MTES concentrations (0%, 5%) of series B (pH 4.5);
however, most samples showed diameters slightly above 5 nm, and only the two highest methyl concentrations caused a shift of the porosity towards the microporous domain.
A similar evolution could be observed for the volume of the microspores with an increasing MTES concentration. The maximum value of the microporosity was found for the samples with 40, 50 and 60% MTES. For the majority of the series A samples, at least half of the pore volume was found to be in the microporous domain.
Int. J. Mol. Sci.2021,22, 9197 5 of 22
Int. J. Mol. Sci. 2021, 22, x FOR PEER REVIEW 4 of 23
0 10 20 30 40 50 60 70 80 90 1
2 3 4 5 6 7 8
series A series B
ln (tg/min)
MTES mole percent (%)
Figure 1. Gelation time (tg) as a function of the MTES/TEOS molar ratio at two catalyst concentra- tions (series A and series B labels represent the pH = 2.0 and pH = 4.5).
2.2. Low-Temperature Nitrogen Adsorption/Desorption
In order to characterize the porous texture of the synthetized gels, low-temperature nitrogen adsorption has also been applied (see adsorption/desorption isotherms in Figure 2a and Figure S1).
For series B, a transition caused by the increasing amount of MTES was observed, the hysteresis loop changed from Type H3 to H2a. Type H3 hysteresis was found for the non- substituted sample, characteristic for large cone-like pores [54,55]. A small addition of MTES (B5) caused the change of the H3 loop to H2a-type hysteresis. Starting from sample B5, a larger amount of mesopores developed, which had gradually been changing up to the B60 sample: the size of the mesopores narrowed and their proportion reduced. The volume of the mesopores decreased, and the volume of micropores increased. The highest methyl substituted samples from the B series showed the H4 hysteresis type.
Almost all the methyl-substituted gels showed a higher surface area than the samples without substitution (Table S1). For series B, an inverse parabolic evolution of the apparent surface area could be observed, with a maximum at 40% MTES content (Figure 2b).
Figure 2. (a) Evolution of low-temperature nitrogen adsorption/desorption isotherms with MTES content. (b) Comparison between the apparent surface area evolution with the MTES mole percent and the acid catalysts content (series A and series B labels represent the pH = 2.0 and pH = 4.5).
The surface area of 1115 m2/g was comparable to the values obtained for silica aero- gels or ordered mesoporous silica [56,57]. For series A, a completely different evolution was observed: except the highest MTES substitution, an almost constant surface area was obtained. The majority of the samples possessed a surface area of ~600 m2/g. The average Figure 2.(a) Evolution of low-temperature nitrogen adsorption/desorption isotherms with MTES content. (b) Comparison between the apparent surface area evolution with the MTES mole percent and the acid catalysts content (series A and series B labels represent the pH = 2.0 and pH = 4.5).
Int. J. Mol. Sci. 2021, 22, x FOR PEER REVIEW 5 of 23
pore size diameter is presented in Figure 3. Cylindrical pore geometry was assumed. For series A, the pores were smaller than 5 nm in diameter; however, for series B, the pores size decreased with the increasing MTES percentage. Very high pore diameter values (above 10 nm) were obtained for the lowest MTES concentrations (0%, 5%) of series B (pH 4.5); how- ever, most samples showed diameters slightly above 5 nm, and only the two highest methyl concentrations caused a shift of the porosity towards the microporous domain.
Figure 3. Diameter of pores from low-temperature nitrogen porosimetry DFT calculation (red), and sizes of the scattering objects—pores and particles together—from SAS (SANS—blue, SAXS—green) (series A and series B labels represent the pH = 2.0 and pH = 4.5).
A similar evolution could be observed for the volume of the microspores with an increasing MTES concentration. The maximum value of the microporosity was found for the samples with 40, 50 and 60% MTES. For the majority of the series A samples, at least half of the pore volume was found to be in the microporous domain.
2.3. Small Angle Scattering (SAS)
Small angle neutron (SANS) and X-ray (SAXS) scattering studies have been per- formed on all the methyl-substituted hybrid silica xerogels. The data have been analyzed by applying the combined model of the following Guinier and Porod approximations, as introduced by Hammouda [58] (Equations (1) and (2)):
𝐼(𝑄) = 𝐺 exp −𝑄 𝑅 /3 ; 𝑄 𝑄 (1)
𝐼(𝑄) = 𝐷/𝑄 ; 𝑄 𝑄 (2) where G and D are the Gunier and Porod scale factors, Q is the scattering vector, I(Q) is the scattered intensity, Rg is the radius of gyration and p is the power law exponent. Q1
represents the scattering vector value, where the intensity values and the slopes of the Guinier and Porod terms are equal.
At the smallest angles, the characteristic size of the particles and/or pores dominates and is described by the Guinier approximation (1), while the high angle part of the scattering curve shows a power law behavior and describes the surface roughness of the particles (2).
The SANS and SAXS curves are shown in the Supplementary Materials (Figures S2 and S3).
Similar to the results obtained using low-temperature nitrogen porosimetry and elec- tron microscopy, the SANS and SAXS measurements confirm that in the nanoscale region, the series A and B, prepared at a different pH, are different in their nanostructure (Figure 3, Table S2).
Figure 3.Diameter of pores from low-temperature nitrogen porosimetry DFT calculation (red), and sizes of the scattering objects—pores and particles together—from SAS (SANS—blue, SAXS—green) (series A and series B labels represent the pH
= 2.0 and pH = 4.5).
2.3. Small Angle Scattering (SAS)
Small angle neutron (SANS) and X-ray (SAXS) scattering studies have been performed on all the methyl-substituted hybrid silica xerogels. The data have been analyzed by applying the combined model of the following Guinier and Porod approximations, as introduced by Hammouda [58] (Equations (1) and (2)):
I(Q) =Gexph
−Q2Rg2/3i
;Q≤Q1 (1)
I(Q) =D/Qp;Q≥Q1 (2)
whereGandDare the Gunier and Porod scale factors,Qis the scattering vector,I(Q) is the scattered intensity, Rg is the radius of gyration andpis the power law exponent.
Q1represents the scattering vector value, where the intensity values and the slopes of the Guinier and Porod terms are equal.
At the smallest angles, the characteristic size of the particles and/or pores domi- nates and is described by the Guinier approximation (1), while the high angle part of the
Int. J. Mol. Sci.2021,22, 9197 6 of 22
scattering curve shows a power law behavior and describes the surface roughness of the particles (2).
The SANS and SAXS curves are shown in the Supplementary Materials (Figures S2 and S3).
Similar to the results obtained using low-temperature nitrogen porosimetry and electron microscopy, the SANS and SAXS measurements confirm that in the nanoscale region, the series A and B, prepared at a different pH, are different in their nanostructure (Figure3, Table S2).
Series A shows a maximum diameter of the scattering objects at 50% MTES sub- stitution; however, the same peak for series B is much less pronounced. Since in low- temperature nitrogen porosimetry could not be observed any increase in pore size by increasing the MTES content, the existence of an increased measured size in SAS can be explained by the stronger agglomeration of the small primary particles, resulting in an average cluster size of 25–30 nm for series A and 10–12 nm for series B. SAS confirms the slightly larger (series A) and larger (series B) pore sizes in the case of low MTES substituted samples. For both series, at a low MTES substitution, exponentpvaries between three and four, characteristic of fractal-like surfaces.
For MTES content above 30%, exponentpdecreases below three, which would indicate surface fractal properties. However, at this composition range, the Guinier type scattering becomes weaker, and interferes on a widerQrange with the exponential type scattering that arises not only from the pores’ surface but also from the primary and aggregated particles. Therefore, thosepvalues can be regarded as only apparent fit parameters that ensure the smoothness of the highQpart of the Guinier approximation.
SAS, N2adsorption and electron microscopy show that the gradual increase in the number of –CH3groups changes the pore and particle structure. It can be assumed that the methyl groups are found at the surface of the silica particles. The pores’ dimension is decreasing with the increase in the MTES/TEOS molar ratio, especially for pH = 4.5.
2.4. Electron Microscopy
2.4.1. Transmission Electron Microscopy (TEM)
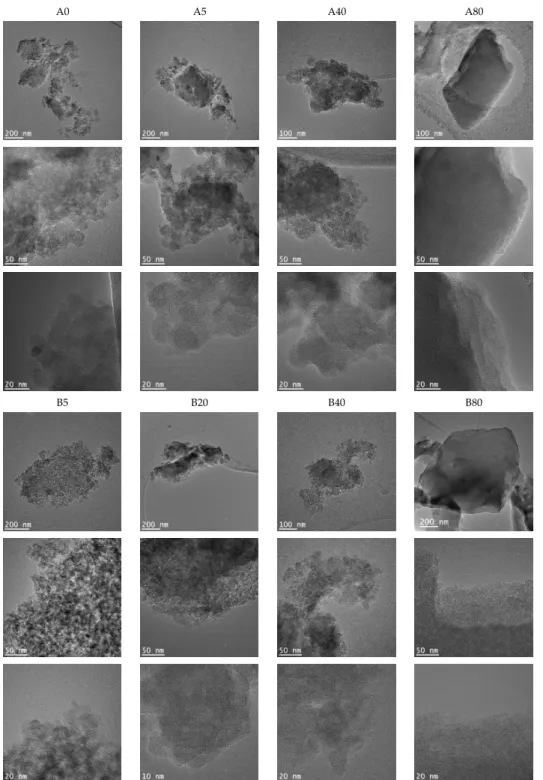
TEM images of the prepared silica materials are shown in Figure4. All the samples were composed of plate-like silica particles. TEM confirmed the previously (SAS and BET) presented results that important morphological changes in the silica hybrids occurred with an increasing MTES concentration: the porosity of samples decreased, and the morphology changed from an amorphous unordered to a compact structure with square-like particles without any visible porosity. This tendency was valid for both series. The appearance of ordered domains was also supported by the XRD results. At the highest magnification for the A0, A5 and B5 samples, the primary particles’ sizes could be seen. Their size varied between 10–20 nm. In agreement with the SAS results, in the case of 40 and 50%
methyl-substituted samples, the primary particles were larger for series A than for series B.
Int. J. Mol. Sci.2021,22, 9197 7 of 22
Int. J. Mol. Sci. 2021, 22, x FOR PEER REVIEW 6 of 23
Series A shows a maximum diameter of the scattering objects at 50% MTES substitu- tion; however, the same peak for series B is much less pronounced. Since in low-temper- ature nitrogen porosimetry could not be observed any increase in pore size by increasing the MTES content, the existence of an increased measured size in SAS can be explained by the stronger agglomeration of the small primary particles, resulting in an average cluster size of 25–30 nm for series A and 10–12 nm for series B. SAS confirms the slightly larger (series A) and larger (series B) pore sizes in the case of low MTES substituted samples. For both series, at a low MTES substitution, exponent p varies between three and four, char- acteristic of fractal-like surfaces.
For MTES content above 30%, exponent p decreases below three, which would indi- cate surface fractal properties. However, at this composition range, the Guinier type scat- tering becomes weaker, and interferes on a wider Q range with the exponential type scat- tering that arises not only from the pores’ surface but also from the primary and aggre- gated particles. Therefore, those p values can be regarded as only apparent fit parameters that ensure the smoothness of the high Q part of the Guinier approximation.
SAS, N2 adsorption and electron microscopy show that the gradual increase in the number of –CH3 groups changes the pore and particle structure. It can be assumed that the methyl groups are found at the surface of the silica particles. The pores’ dimension is decreasing with the increase in the MTES/TEOS molar ratio, especially for pH = 4.5.
2.4. Electron Microscopy
2.4.1. Transmission Electron Microscopy (TEM)
TEM images of the prepared silica materials are shown in Figure 4. All the samples were composed of plate-like silica particles. TEM confirmed the previously (SAS and BET) presented results that important morphological changes in the silica hybrids occurred with an increasing MTES concentration: the porosity of samples decreased, and the morphology changed from an amorphous unordered to a compact structure with square-like particles without any visible porosity. This tendency was valid for both series. The appearance of ordered domains was also supported by the XRD results. At the highest magnification for the A0, A5 and B5 samples, the primary particles’ sizes could be seen. Their size varied be- tween 10–20 nm. In agreement with the SAS results, in the case of 40 and 50% methyl-sub- stituted samples, the primary particles were larger for series A than for series B.
A0 A5 A40 A80
Int. J. Mol. Sci. 2021, 22, x FOR PEER REVIEW 7 of 23
B5 B20 B40 B80
Figure 4. TEM images of the hybrid silica xerogels, series A and B, obtained with different methyl substituent content (series A and series B labels represent the pH = 2.0 and pH = 4.5).
2.4.2. Scanning Electron Microscopy (SEM)
SEM images (Figure 5) show the surface topology of silica xerogels. With increasing MTES content, the particles became more compact and edged. The plate-like structure observed in TEM was present at micrometer sizes, as well.
Figure 4. TEM images of the hybrid silica xerogels, series A and B, obtained with different methyl substituent content (series A and series B labels represent the pH = 2.0 and pH = 4.5).
2.4.2. Scanning Electron Microscopy (SEM)
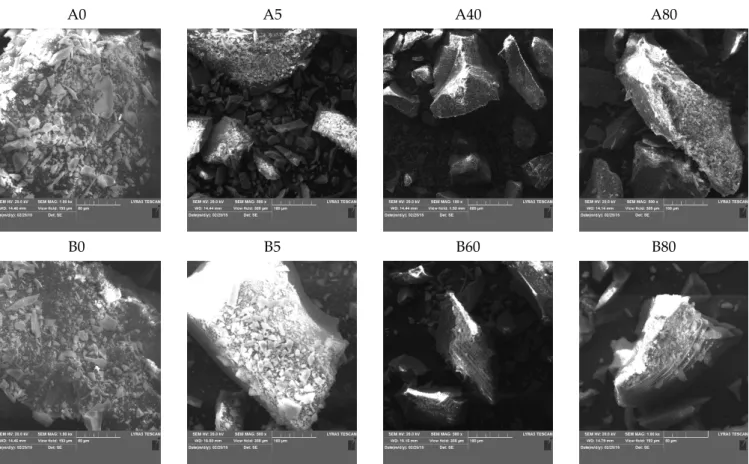
SEM images (Figure5) show the surface topology of silica xerogels. With increasing MTES content, the particles became more compact and edged. The plate-like structure observed in TEM was present at micrometer sizes, as well.
Int. J. Mol. Sci.2021,22, 9197 8 of 22
Int. J. Mol. Sci. 2021, 22, x FOR PEER REVIEW 8 of 23
A0 A5 A40 A80
B0 B5 B60 B80
Figure 5. SEM micrographs of the hybrid silica xerogels, series A and B, obtained with different methyl substituent content (series A and series B labels represent the pH = 2.0 and pH = 4.5).
2.5. FTIR-ATR Spectroscopy
FTIR-ATR spectra were collected for all the xerogels. The spectra for series A, in the 400–4000 cm−1 wavenumber range, are displayed in Figure 6.
500 1000 1500 2000 2500 3000 3500 4000 80 % 70 % 60 % 50 %
20 % 10 %5 % 0 % 40 %
IR absorbance (arb. units)
Wavenumber (cm−1)
30 %
Figure 6. FTIR spectra of series A at different methyl concentrations. All spectra have been vertically shifted (series A represents the pH = 2.0).
Vibrational modes of the silica network, more prominent in the case of TEOS (0%
MTES), were detected at ~455, ~800 and ~1065 cm−1. The low frequency contributions (~455 and ~800 cm−1) are bending modes of the Si–O bonds, whereas the high-intensity band at
~1065 cm−1 is attributed to the Si–O–Si stretching mode of the SiO2 skeletal structure. By Figure 5.SEM micrographs of the hybrid silica xerogels, series A and B, obtained with different methyl substituent content (series A and series B labels represent the pH = 2.0 and pH = 4.5).
2.5. FTIR-ATR Spectroscopy
FTIR-ATR spectra were collected for all the xerogels. The spectra for series A, in the 400–4000 cm−1wavenumber range, are displayed in Figure6.
Int. J. Mol. Sci. 2021, 22, x FOR PEER REVIEW 8 of 23
A0 A5 A40 A80
B0 B5 B60 B80
Figure 5. SEM micrographs of the hybrid silica xerogels, series A and B, obtained with different methyl substituent content (series A and series B labels represent the pH = 2.0 and pH = 4.5).
2.5. FTIR-ATR Spectroscopy
FTIR-ATR spectra were collected for all the xerogels. The spectra for series A, in the 400–4000 cm−1 wavenumber range, are displayed in Figure 6.
500 1000 1500 2000 2500 3000 3500 4000 80 % 70 % 60 % 50 %
20 % 10 %5 % 0 % 40 %
IR absorbance (arb. units)
Wavenumber (cm−1)
30 %
Figure 6. FTIR spectra of series A at different methyl concentrations. All spectra have been vertically shifted (series A represents the pH = 2.0).
Vibrational modes of the silica network, more prominent in the case of TEOS (0%
MTES), were detected at ~455, ~800 and ~1065 cm−1. The low frequency contributions (~455 and ~800 cm−1) are bending modes of the Si–O bonds, whereas the high-intensity band at
~1065 cm−1 is attributed to the Si–O–Si stretching mode of the SiO2 skeletal structure. By Figure 6.FTIR spectra of series A at different methyl concentrations. All spectra have been vertically shifted (series A represents the pH = 2.0).
Vibrational modes of the silica network, more prominent in the case of TEOS (0%
MTES), were detected at ~455, ~800 and ~1065 cm−1. The low frequency contributions (~455 and ~800 cm−1) are bending modes of the Si–O bonds, whereas the high-intensity band at ~1065 cm−1 is attributed to the Si–O–Si stretching mode of the SiO2 skeletal structure. By increasing the amount of MTES in the reaction mixture, significant differences
Int. J. Mol. Sci.2021,22, 9197 9 of 22
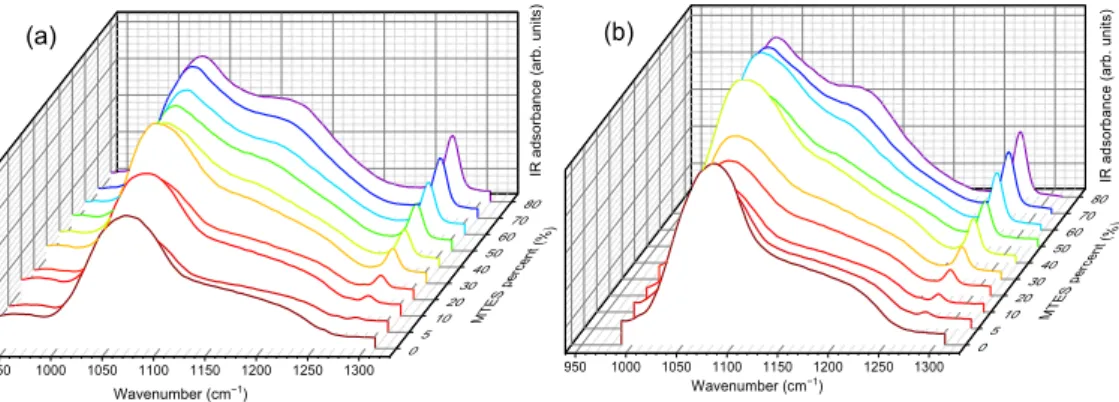
were observed when compared to the spectrum of the pure TEOS xerogel. An enhancement of the intensities associated to the characteristic Si–CH3bands (~1275 and ~2975 cm−1) was observed, which was assigned to the symmetric deformation of Si–CH3and the non- hydrolyzed ethoxy groups, respectively. At the same time, bands belonging to theνas Si–O–Si (1030–1080 cm−1),δsC–H (1272–1279 cm−1) andνsC–H (2972–2980 cm−1) shifted to lower wavenumber values. In Figure7, the evolution of the Si–O–Si asymmetrical and the C–H symmetrical stretching vibration bands as a function of the MTES substitution degree are shown.
Int. J. Mol. Sci. 2021, 22, x FOR PEER REVIEW 9 of 23
increasing the amount of MTES in the reaction mixture, significant differences were ob- served when compared to the spectrum of the pure TEOS xerogel. An enhancement of the intensities associated to the characteristic Si–CH3 bands (~1275 and ~2975 cm−1) was ob- served, which was assigned to the symmetric deformation of Si–CH3 and the non-hydro- lyzed ethoxy groups, respectively. At the same time, bands belonging to the νas Si–O–Si (1030–1080 cm−1), δs C–H (1272–1279 cm−1) and νs C–H (2972–2980 cm−1) shifted to lower wavenumber values. In Figure 7, the evolution of the Si–O–Si asymmetrical and the C–H symmetrical stretching vibration bands as a function of the MTES substitution degree are shown.
Figure 7. Magnification of the 950–1300 cm−1 wavenumber region, for (a) series A and (b) series B, where the Si–O–Si asymmetric and δs C–H vibrations are measured. The down shift of both maxima with the increase in the amount of –CH3 can be observed(series A and series B labels represent the pH = 2.0 and pH = 4.5).
A slight contribution of the H–O–H bending mode of water molecules at 1631 cm−1 was observed (see Figure 6). It is worth mentioning the shift towards lower values exhib- ited by the 3000–4000 cm−1 band, ascribed to the fundamental OH stretching vibration of different hydroxyl groups, suggesting an increasing hydrophobicity of the silica gels with an increasing methyl content. The band intensity decrease was the most pronounced in the case of the samples without methyl groups and with a low concentration of MTES.
Accordingly, a reduction in the band intensity as the MTES amount increased is an exper- imental indication of the increased hydrophobicity of the investigated materials. The same tendency can be observed for the symmetric vibration of the Si-OH bond, evidentiated by a shoulder at approximatively 950 cm−1.
The maximum was moving to lower values with the increasing concentration of the MTES (Figure 7). This shift was explained with the increasing distance between the silica planes with the increasing number of the methyl groups, which was attributed to the ratio modification of LO4-TO4 vibrational modes (νas(Si–O–Si)TO at ~1075 cm−1 and νas(Si–O–
Si)LO at ~1180 cm−1) and caused a decrease in porosity or an increase in the system density, as expected, in agreement with the SAS data, electron microscopy and DFT modelling of low-temperature nitrogen porosimetry data.
2.6. X-ray Diffraction
Diffractograms in the range of 2θ = 5–35° were recorded for the ground/crushed xero- gels, prepared with a different amount of MTES. One specific maximum was observed in the 2θ = 22–23° region (Figure 8). The maximum moved to lower values with the increas- ing MTES concentration (Table S3), indicating that with the increasing quantity of the me- thyl groups, the spacing between silicon atoms connected by an oxygen bridge has also increased. The higher methyl content (>60%) caused the appearance of a second maximum
950 1000 1050 1100 1150 1200 1250 1300
80 70 60 50 40 30 20 10 5 0 Wavenumber (cm−1)
IR adsorbance (arb. units)
MTES percent (%)
(a)
950 1000 1050 1100 1150 1200 1250 1300
80 70 60 50 40 30 20 10 5 0
(b)
Wavenumber (cm−1)
IR adsorbance (arb. units)
MTES percent (%)
Figure 7.Magnification of the 950–1300 cm−1wavenumber region, for (a) series A and (b) series B, where the Si–O–Si asymmetric andδsC–H vibrations are measured. The down shift of both maxima with the increase in the amount of –CH3can be observed(series A and series B labels represent the pH = 2.0 and pH = 4.5).
A slight contribution of the H–O–H bending mode of water molecules at 1631 cm−1 was observed (see Figure6). It is worth mentioning the shift towards lower values exhib- ited by the 3000–4000 cm−1band, ascribed to the fundamental OH stretching vibration of different hydroxyl groups, suggesting an increasing hydrophobicity of the silica gels with an increasing methyl content. The band intensity decrease was the most pronounced in the case of the samples without methyl groups and with a low concentration of MTES.
Accordingly, a reduction in the band intensity as the MTES amount increased is an experi- mental indication of the increased hydrophobicity of the investigated materials. The same tendency can be observed for the symmetric vibration of the Si-OH bond, evidentiated by a shoulder at approximatively 950 cm−1.
The maximum was moving to lower values with the increasing concentration of the MTES (Figure7). This shift was explained with the increasing distance between the silica planes with the increasing number of the methyl groups, which was attributed to the ratio modification of LO4-TO4vibrational modes (νas(Si–O–Si)TO at ~1075 cm−1and νas(Si–O–Si)LO at ~1180 cm−1) and caused a decrease in porosity or an increase in the system density, as expected, in agreement with the SAS data, electron microscopy and DFT modelling of low-temperature nitrogen porosimetry data.
2.6. X-ray Diffraction
Diffractograms in the range of 2θ= 5–35◦ were recorded for the ground/crushed xerogels, prepared with a different amount of MTES. One specific maximum was observed in the 2θ = 22–23◦ region (Figure 8). The maximum moved to lower values with the increasing MTES concentration (Table S3), indicating that with the increasing quantity of the methyl groups, the spacing between silicon atoms connected by an oxygen bridge has also increased. The higher methyl content (>60%) caused the appearance of a second maximum centered around 9◦, explained by the appearance of ordered domains and the presence of four-fold siloxane rings. These results are in good agreement with the results obtained using FTIR spectroscopy and electron microscopy.
Int. J. Mol. Sci.2021,22, 9197 10 of 22
Int. J. Mol. Sci. 2021, 22, x FOR PEER REVIEW 10 of 23
centered around 9°, explained by the appearance of ordered domains and the presence of four-fold siloxane rings. These results are in good agreement with the results obtained using FTIR spectroscopy and electron microscopy.
0 10 20 30 40 50 60 70 80 22.2
22.3 22.4 22.5 22.6 22.7 22.8 22.9
23.0 series A
series B
XRD maxima position 2θ (°)
MTES mole percent (%)
(a)
5 10 15 20 25 30 35
100 200 300 400 500 600 700
Relative Intensity
2 θ (°)
TEOS 5% MTES 10% MTES 20% MTES 30% MTES 40% MTES 50% MTES 60% MTES 70% MTES 80% MTES
(b)
0 10 20 30 40 50 60 70 80
8.5 9.0 9.5 10.0 10.5 11.0 11.5 12.0 12.5
MTES mole percent (%)
series A series B
(c)
FWHM (°)
0 10 20 30 40 50 60 70 80
200 210 220 230 240 250 260 270 280
Height
MTES mole percent (%) series A series B
(d)
Figure 8. (a) XRD maxima position shift, (b) plots of the relative intensities as a function of MTES substitution, (c) FWHM and (d) peak height changes with MTES content for series A and B, respectively (series A and series B labels represent the pH = 2.0 and pH = 4.5).
2.7. 29Si MAS NMR
The solid-state 29Si NMR spectra (Figure 9) of the TEOS and MTES/TEOS derived materials showed a gradual increase in peaks T3 and T2 with the increase in the MTES content. The intensities of the Q3 and Q4 peaks showed a reverse trend. The Q4 position shifted to lower values, while the T3 and T2 position shifted to higher values with an in- creasing MTES concentration.
The strong Q4 and T3 signals revealed a high condensation extent of TEOS and MTES.
The quantitative analysis of the 29Si MAS NMR spectra is summarized in Table A.4. For samples derived from TEOS, 71% of the silica network was fully condensed (Q4 species).
The incorporation of a small amount of trifunctional (Ti) units into the neat silica network caused a decrease in the condensation rate of the tetrafunctional structural units. This indi- cates the initiation of disordering in the siloxane network due to the co-condensation. There- fore, a small amount of methyl substituents acts as defect-forming agent in the network. Due to steric effects, not all the silanol groups are able to condense, and remain free (confirmed also by 1H MAS NMR). However, with an increasing amount of Ti units in the network, the condensation rate of Qi units subsequently increased as a result of the higher reactivity and free volume provided by the methylsiloxane units. In this way, highly condensed copoly- mer siloxane networks were formed. In case of the samples with 100, 95, 90 and 60% TEOS, the tetrafunctional structural units were transformed to Q4 species in 70% extent, while in the case of the 40 and 20% samples, around 90% of the sites were transformed to Q4. Figure 8.(a) XRD maxima position shift, (b) plots of the relative intensities as a function of MTES substitution, (c) FWHM and (d) peak height changes with MTES content for series A and B, respectively (series A and series B labels represent the pH = 2.0 and pH = 4.5).
2.7.29Si MAS NMR
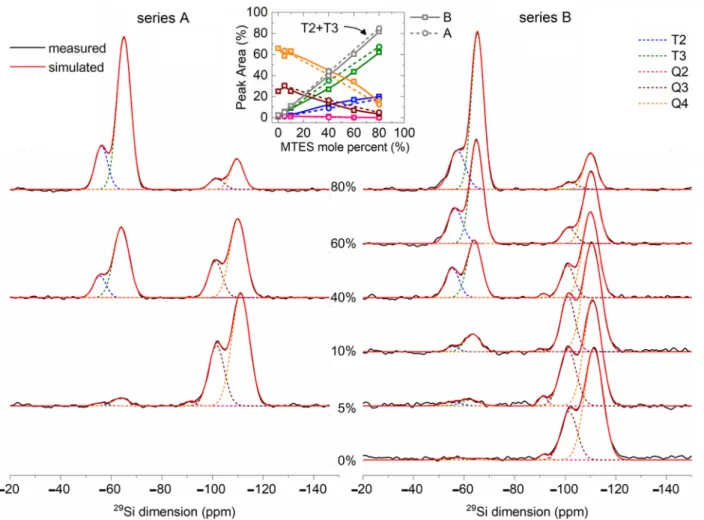
The solid-state29Si NMR spectra (Figure9) of the TEOS and MTES/TEOS derived materials showed a gradual increase in peaks T3and T2with the increase in the MTES content. The intensities of the Q3and Q4peaks showed a reverse trend. The Q4position shifted to lower values, while the T3and T2 position shifted to higher values with an increasing MTES concentration.
The strong Q4and T3signals revealed a high condensation extent of TEOS and MTES.
The quantitative analysis of the 29Si MAS NMR spectra is summarized in Table S4. For samples derived from TEOS, 71% of the silica network was fully condensed (Q4species).
The incorporation of a small amount of trifunctional (Ti) units into the neat silica network caused a decrease in the condensation rate of the tetrafunctional structural units. This indicates the initiation of disordering in the siloxane network due to the co-condensation. Therefore, a small amount of methyl substituents acts as defect-forming agent in the network. Due to steric effects, not all the silanol groups are able to condense, and remain free (confirmed also by1H MAS NMR). However, with an increasing amount of Tiunits in the network, the condensation rate of Qiunits subsequently increased as a result of the higher reactivity and free volume provided by the methylsiloxane units. In this way, highly condensed copolymer siloxane networks were formed. In case of the samples with 100, 95, 90 and 60% TEOS, the tetrafunctional structural units were transformed to Q4species in 70% extent, while in the case of the 40 and 20% samples, around 90% of the sites were transformed to Q4.
Int. J. Mol. Sci.2021,22, 9197 11 of 22
Int. J. Mol. Sci. 2021, 22, x FOR PEER REVIEW 11 of 23
Figure 9. Solid-state 29Si-NMR spectra of the sol–gel derived silica from different TEOS/MTES compositions (series A and series B labels represent the pH = 2.0 and pH = 4.5).
Table 1 compares the 29Si MAS NMR results of samples synthetized at pH = 2 (series A) and pH = 4.5 (series B). A more acidic pH promoted a faster hydrolysis and a slower condensation of the precursors, while at a less acidic pH, the hydrolysis and condensation reactions were increasing or decreasing in parallel. In addition, the CH3–Si containing sites had lower reactivity. All these factors together favored the formation of Q4 species at pH
= 4.5, while at pH = 2, a larger amount of T3 species were formed. For both pH values, the condensation level increased with the increasing quantity of the MTES ratio in the precur- sor mixture.
Table 1. Comparison of the number of species determined from the 29Si-MAS NMR spectra for series A and B (series A and series B labels represent the pH = 2.0 and pH = 4.5).
Sample
29Si-MAS-NMR Series Q4 (%) Q3 (%) Q2 (%) T3 (%) T2 (%) T1 (%) Q4 + T3
(%)
Q4 + T3 + Q3 (%)
Q3+Q2 + T2
(%) Q2 + T2 (%)
5 A 60.62 33.37 0.42 3.79 1.79 - 64.41 97.78 35.58 2.21
B 63.34 32.33 1.51 2.82 0 - 66.16 98.49 33.84 1.51
40 A 40.99 15.32 0 34.87 8.82 - 75.86 91.18 24.14 8.82
B 43.57 14.75 0.62 26.54 14.51 - 70.11 84.86 29.88 15.13
80 A 12.54 4.65 0 64.28 18.53 - 76.82 81.47 23.18 18.53
B 17.43 1.58 0 61.18 18.89 0.91 78.61 80.19 20.47 18.89 There are the following two possible explanations for the aforementioned shift of both contributions: either (i) the Q4 and Q3 ratio is increasing, or (ii) the diminishing of the Figure 9.Solid-state29Si-NMR spectra of the sol–gel derived silica from different TEOS/MTES compositions (series A and series B labels represent the pH = 2.0 and pH = 4.5).
Table1compares the29Si MAS NMR results of samples synthetized at pH = 2 (series A) and pH = 4.5 (series B). A more acidic pH promoted a faster hydrolysis and a slower condensation of the precursors, while at a less acidic pH, the hydrolysis and condensation reactions were increasing or decreasing in parallel. In addition, the CH3–Si containing sites had lower reactivity. All these factors together favored the formation of Q4species at pH
= 4.5, while at pH = 2, a larger amount of T3species were formed. For both pH values, the condensation level increased with the increasing quantity of the MTES ratio in the precursor mixture.
Table 1.Comparison of the number of species determined from the29Si-MAS NMR spectra for series A and B (series A and series B labels represent the pH = 2.0 and pH = 4.5).
Sample
29 Si-MAS-NMR
Series Q4 (%) Q3 (%) Q2 (%) T3 (%) T2 (%) T1 (%) Q4 + T3
(%)
Q4 + T3 + Q3 (%)
Q3 +Q2 + T2 (%)
Q2 + T2 (%)
5 A 60.62 33.37 0.42 3.79 1.79 - 64.41 97.78 35.58 2.21
B 63.34 32.33 1.51 2.82 0 - 66.16 98.49 33.84 1.51
40 A 40.99 15.32 0 34.87 8.82 - 75.86 91.18 24.14 8.82
B 43.57 14.75 0.62 26.54 14.51 - 70.11 84.86 29.88 15.13
80 A 12.54 4.65 0 64.28 18.53 - 76.82 81.47 23.18 18.53
B 17.43 1.58 0 61.18 18.89 0.91 78.61 80.19 20.47 18.89
There are the following two possible explanations for the aforementioned shift of both contributions: either (i) the Q4and Q3ratio is increasing, or (ii) the diminishing of the bond strength associated to the Si–O–Si bonds may lead to longer Si–O–Si distances.
The second explanation is in good agreement with the XRD measurements, where the increasing quantity of the methyl groups led to larger silica plane distances.
Int. J. Mol. Sci.2021,22, 9197 12 of 22
For the samples synthesized with 0, 5 and 10% MTES, the high degree of the three- dimensional (3D) cross-linking gel network was observed (Q4+ Q3+ T3= 97–99%), while for the B40, A40, B60, A80 or B80 samples, the 3D cross-linking degree was smaller (80–91%). The sum of the Q2and T2signals suggested a linear silica (2D) network (Table1and Table S4). The proportion of the 2D silica network increased gradually from 1 to 19% with the amount of methyl functionalization. The hydrophobicity of the samples could be linked indirectly to the amount of hydroxyl groups. The silica sites with hydroxyl groups were represented by the Q3, Q2and T2species. The gradual increase in the methyl substitution caused a decrease in the sum of Q3+ Q2+ T2, which means an increasing hydrophobicity, as supported by the thermal analysis, FTIR spectra and confirmed also by the contact angle measurements. The sum of the Txspecies (Table1and Table S4) shows the degree of methylation of every sample.
2.8. Thermal Analysis
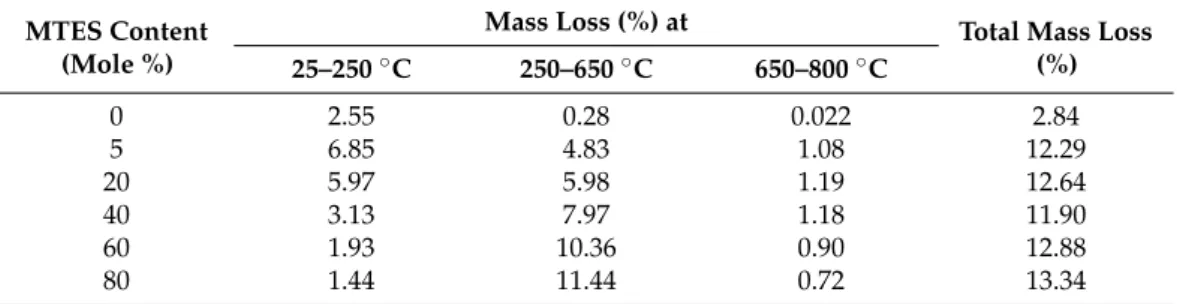
The thermal behavior of silica and methyl-substituted silica xerogels was studied using thermal analysis. All the synthetized samples showed a typical decomposition profile with three distinctive mass loss steps (Figure S4). The initial mass loss (up to 250◦C) was attributed to the removal of water. The percent of the mass loss (Table2) depended on the chemical composition of the xerogels. In the temperature range from 250 to 650◦C, a main mass decrease (up to 12%) with expressed exothermal effect (DTA curve), due the thermal decomposition of methyl groups, was observed. At temperatures above 650◦C, the TG curves showed only a slight mass loss (up to 1.2%), corresponding to water loss due to the condensation of the silanol groups to form siloxane bonds. The total mass loss was about 3% for the sample made from TEOS and 12–13% for the samples with an MTES content. It is interesting to observe that all the methyl-substituted samples showed around 12% total mass loss, which is caused by the thermal decomposition of the methyl groups.
Table 2.Thermal behavior of series B silica xerogels synthesized with different MTES content (series B represents the pH = 4.5).
MTES Content (Mole %)
Mass Loss (%) at Total Mass Loss
25–250◦C 250–650◦C 650–800◦C (%)
0 2.55 0.28 0.022 2.84
5 6.85 4.83 1.08 12.29
20 5.97 5.98 1.19 12.64
40 3.13 7.97 1.18 11.90
60 1.93 10.36 0.90 12.88
80 1.44 11.44 0.72 13.34
2.9. Contact Angle
The representative contact angle (CA) images are presented in the Supplementary Materials (Figure S5). The CA data for all types of samples are presented as box plots in function of the methyl content (Figure10). For ease of comparison, the data were grouped in pairs by the following two properties: second step catalysis type (series A vs. series B) and state of the powder (as-received vs. ground). Due to the difficulties of measuring caused by the powder state of the samples, the range of CAs of the samples with identical methyl content was high, typically 10–20◦.
Int. J. Mol. Sci.2021,22, 9197 13 of 22
Int. J. Mol. Sci. 2021, 22, x FOR PEER REVIEW 13 of 23
Figure 10. Box plot statistical representation of the advancing contact angles of MTES samples, series A and B, both as- received and ground, in function of the methyl content, grouped in pairs in order to facilitate comparison (series A and series B labels represent the pH = 2.0 and pH = 4.5).
The CA dependence on the methyl content and catalyst type was similar to the trends observed for the vinylated silica xerogels [59].
The CAs follow a generally increasing trend with the increase in the methyl content.
The median CAs range from 13.5 to 153.5°. The same CA dependency versus methyl content was also observed for other methylated silica xerogels [19,60,61] and could be explained along the Cassie–Baxter theory [62]. According to this theory, the surface of the studied xerogels is composed of “bare” silica with a low intrinsic CA, θsilica and methyl groups with a high intrinsic CA, θmethyl.
The CA of the xerogel, θ, depends on the CA of these two surface components as follows:
cos𝜃 = (1 − 𝑓 )cos𝜃 + f cos𝜃 , (3)
where fmethyl denotes the surface fraction of the methyl groups. With an increasing MTES mol%, this surface fraction should necessarily increase, therefore contributing to the increase in the total CA.
Series B reached a higher maximum CA than series A. As evidenced by the low- temperature nitrogen sorption (Figure 2b), the apparent surface area of series B was higher than that of series A. According to the Wenzel model [63], the relative surface area affects the measured CA as follows:
cos 𝜃 = 𝑟 cos 𝜃 , (4)
where θW stands for the real (“Wenzel”) CA of the rough surface, θY is the ideal equilibrium (“Young”) CA of the same flat surface and rW is a dimensionless roughness factor, the ratio of the real surface area to its geometrical projection. According to this relation, for hydrophilic surfaces (θY < 90°), a higher than geometrical surface area leads to a lower real CA, whereas increasing the real surface area of hydrophobic surfaces (θY ˃
0 10 20 30 40 50 60 70 80
0 20 40 60 80 100 120 140 160
θ / °
MTES content / %
MTES-A MTES-B
0 10 20 30 40 50 60 70 80
0 20 40 60 80 100 120 140 160
MTES-A ground
MTES content / %
θ / °
MTES-B ground
0 10 20 30 40 50 60 70 80
0 20 40 60 80 100 120 140 160
MTES-A
MTES content / %
θ / °
MTES-A ground
0 10 20 30 40 50 60 70 80
0 20 40 60 80 100 120 140 160
MTES content / %
θ / °
MTES-B MTES-B ground
Figure 10. Box plot statistical representation of the advancing contact angles of MTES samples, series A and B, both as-received and ground, in function of the methyl content, grouped in pairs in order to facilitate comparison (series A and series B labels represent the pH = 2.0 and pH = 4.5).
The CA dependence on the methyl content and catalyst type was similar to the trends observed for the vinylated silica xerogels [59].
The CAs follow a generally increasing trend with the increase in the methyl content.
The median CAs range from 13.5 to 153.5◦. The same CA dependency versus methyl content was also observed for other methylated silica xerogels [19,60,61] and could be explained along the Cassie–Baxter theory [62]. According to this theory, the surface of the studied xerogels is composed of “bare” silica with a low intrinsic CA,θsilica and methyl groups with a high intrinsic CA,θmethyl.
The CA of the xerogel,θ, depends on the CA of these two surface components as follows:
cosθ=1− fmethyl
cosθsilica+ fmethylcosθmethyl, (3) wherefmethyldenotes the surface fraction of the methyl groups. With an increasing MTES mol%, this surface fraction should necessarily increase, therefore contributing to the in- crease in the total CA.
Series B reached a higher maximum CA than series A. As evidenced by the low- temperature nitrogen sorption (Figure2b), the apparent surface area of series B was higher than that of series A. According to the Wenzel model [63], the relative surface area affects the measured CA as follows:
cosθW =rWcosθY, (4)
whereθWstands for the real (“Wenzel”) CA of the rough surface,θYis the ideal equilib- rium (“Young”) CA of the same flat surface andrWis a dimensionless roughness factor, the ratio of the real surface area to its geometrical projection. According to this relation, for hydrophilic surfaces (θY>90◦), a higher than geometrical surface area leads to a lower real CA, whereas increasing the real surface area of hydrophobic surfaces (θY>90◦) would