OPTIMISATION WITH INTEGRATION OF
RENEWABLE ENERGY SOURCES INTO ENERGY SUPPLY CHAIN
PhD Thesis
Hon Loong LAM
Supervisor:
Prof. Dr. Jiří J. Klemeš, DSc Co-supervisor:
Dr. Petar S. Varbanov
Doctoral School of Information Science and Technology University of Pannonia
Veszprém 2011
LÁNCBA VALÓ INTEGRÁLÁSSAL) Értekezés doktori (PhD) fokozat elnyerése érdekében
Írta:
Hon Loong Lam
Készült a Pannon Egyetem Informatikai Tudományok Doktori Iskolája keretében
Témavezető: Dr. Jiří J. Klemeš
Elfogadásra javaslom (igen / nem)
...
(aláírás) Témavezető: Dr. Petar S. Varbanov
Elfogadásra javaslom (igen / nem)
...
(aláírás)
A jelölt a doktori szigorlaton ... %-ot ért el,
Veszprém
...
a Szigorlati Bizottság elnöke Az értekezést bírálóként elfogadásra javaslom:
Bíráló neve: ... igen / nem
...
(aláírás) Bíráló neve: ... igen / nem ...
(aláírás) Bíráló neve: ... igen / nem ...
(aláírás) A jelölt az értekezés nyilvános vitáján ... %-ot ért el
Veszprém,
...
a Bíráló Bizottság elnöke A doktori (PhD) oklevél minősítése: ...
...
Az EDT elnöke
III
First and foremost I offer my sincerest gratitude to my supervisor, Prof Jiří Jaromír Klemeš, DSc, who supported me throughout my thesis with his patience and knowledge, whilst allowing me the space to work in my own way. One simply could not wish for a better or friendlier supervisor. Special words go to my co-supervisor Dr Petar Sabev Varbanov. Thank you for all your advice, scientific support, and also for the private-life guidance. I would also like to thank Prof Ferenc Friedler, DSc, the Dean of Faculty of Information Technology, University of Pannonia and Dr Rozália Pigler-Lakner, the Deputy Dean and also the Secretary of The Information Technology PhD School, Ms Orsolya Ujvári, the School’s Project Officer for their administrative support and endless helps.
Furthermore, I would like to thanks, Prof Tamás Szirányi, from University of Pannonia and Hungarian Academy of Sciences, Prof Petr Stehlík from Brno University of Technology, Czech Republic and Dr László Czúni from University of Pannonia, who gave helpful support and advice in preparing me for the comprehensive examination.
In my daily work I have been blessed with a friendly and cheerful group of fellow students. I would like to take this opportunity to show heartfelt thanks to my colleagues in the Centre for Process Integration and Intensification, University of Pannonia: Ms Zsófia Fodor, Ms Andreja Nemet, Ms Lidija Čuček, Mr Luca De Benedetto, and Mr László Sikos who gave me a helping hand whenever I needed help during my stay in Hungary. Special thanks to Dr Hella Tokos and Mr Mate Hegyhati who provided useful guidance in mathematical programming. The financial support from (i) EC project Marie Curie Chair (EXC) MEXC-CT-2003-042618 “Integrated Waste to Energy Management to Prevent Global Warming – INEMAGLOW” is gratefully acknowledged.
IV
distance sometimes made it difficult to keep in touch.
Hon Loong LAM
V
Optimisation with Integration of Renewable sources of Energy into Energy Supply Chain
This thesis presents several steps and approaches to the optimisation and synthesis of regional networks for biomass and biofuel production and supply. The first step is to form clusters of zones, which minimise the environmental impact of the biomass energy exchanges between the zones within the overall supply chain network. A cluster can be understand as a set of zones related through energy transfer links using local infrastructures. The Regional Energy Clustering (REC) algorithm is developed to manage the energy balancing among the zones. The energy surpluses and deficits from various zones can be matched and combined to form energy supply chain clusters. The result of REC analysis is visually illustrated with Regional Energy supply and Demand Curves (RESDC). The RESDC is a pair of cumulative curves which represent cumulative energy surplus and deficit profiles. It is able to indicate the size of each cluster and the total energy involved in the supply chain within the cluster.
The result of REC is then further analysed by the Regional Resources Management Composite Curve, in this thesis it is shortened to RMC. The main purpose of developing RMC is to tackle simultaneously the issues of the biomass supply chain and transportation and land use. RMC is a tool for supporting decision making in regional recourse management. It provides a complete view of energy and land availability in a region, displaying their trade-offs in a single plot. A set of rules for RMC manipulation is presented. These rules can be implemented while manipulating regional resources such as land and the surplus energy. These rules give a clear overview picture and useful hints to the planner on how to manage regional resources with a single graph.
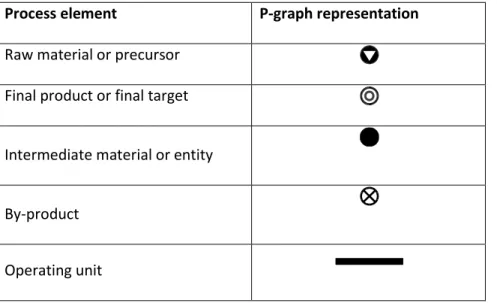
The network synthesis is carried out by P-graph (Process Graph) tools. P-graph is a directed bipartite graph, having two types of vertices – one for operating units and another for those objects representing material or energy flows/quantities. In this
VI
method. This graph-based method clearly shows where, how, and what kind of material and energy carriers will be transferred from raw material biomass supplier to the process plants and customers.
In order to test the efficiency of the model, a demonstration case study of regional renewable network problem was solved using these methods. Their performances were tested and the results confirmed the applicability on a regional scale. The results are very positive and some suggestions for future work are given in the conclusion.
VII
A megújuló energia források optimálása az energia ellátási láncba való integrálással
A disszertáció új vizsgálati lépéseket és megközelítési módokat mutat be biomassza és bioüzemanyag előállítás és ellátás regionális hálózatának optimális kialakítására. Az első lépés az övezeti zónák meghatározása, ami minimálisra csökkenti a biomassza energia környezetre gyakorolt hatását a zónák közötti átfogó ellátási hálózat révén. Klaszterként olyan zónák összességét definiáltam, melyek a helyi infrastruktúrán keresztül egymást között energiát tudnak cserélni.
A kifejlesztett Regionális Energia Klaszterezési (REC) algoritmus lehetővé teszi az energiamérleg meghatározását az egyes zónákban, valamint az azok között szükségessé váló energiaforgalmat. A különböző zónákban, illetve klaszterekben jelentkező energiatöbblet és hiány együttesen határozza meg a regionális energia ellátási láncot. Az eredményt vizuálisan mutatja az úgynevezett Regionális Energia Ellátási és Keresleti görbe (RESDC). A RESDC egy kumulatív görbe pár, ami a terület függvényében bemutatja a kumulált energia többlet és -hiány görbéit. Segítségével meghatározható az egyes klaszterek mérete, miközben megadja a teljes elfogyasztott energiát az ellátási lánc klaszterein belül.
A REC eredményeit tovább vizsgáljuk az úgynevezett „Regional Resources Management Composite Curve” létrehozásával, amit a továbbiakban RMC-nek nevezünk. Az RMC kifejlesztésének legfontosabb indoka, hogy segítségével egyszerre tudjuk kezelni a biomassza ellátási lánc, valamint a szállítás és földhasználat során felmerülő problémákat. Az RMC egy - a regionális energia menedzsment során alkalmazható - döntéstámogató rendszer. Átfogó képet ad egyes régiókban elérhető energia mennyiségéről, annak területi megoszlásáról, és szemléletes módon mutatja be ezeket. Az értekezés ismerteti az RMC működésének általános szabályait. Ezek a szabályok jól alkalmazhatók a
VIII
és eligazítást adnak a tervezőnek, hogy mi módon kell kezelni a regionális erőforrásokat egy egyszerű gráf segítségével.
A hálózatszintézis a P-gráf (Process Graph) módszer alkalmazásával történik. A P-gráf egy irányított páros gráf, aminek kétféle csúcsa van – az egyik típusú csúcs a működő technológiai egységeket, a másik az energiaáramot, illetve annak minőségét reprezentálja. Ebben az eljárásban, először a biomassza termelés hálózatának lehetséges maximális struktúráját határozzuk meg, majd ennek alapján a Branch and Bound módszer segítségével választjuk ki az optimális struktúrát. Ennek a grafikon-alapú módszernek az alkalmazásával egyértelműen meghatározható, hogy hol, hogyan, és milyen anyagok és energiahordozók kerülnek át a biomassza nyersanyag besszálítóktól az üzemekbe és az ügyfelekhez.
Annak érdekében, hogy teszteljük a modell hatékonyságát, esettanulmányokat mutatunk be a megújuló energiaforrások regionális hálózatának létrehozásával kapcsolatos problémák megoldására. A tesztek eredményei megerősítették az új módszerek regionális szintű alkalmazhatóságát. A bemutatott eredmények jelentőségüket tekintve nagyon biztatóak, aminek alapján javaslatot teszünk a munka jövőbeli folytatására.
IX
能源供应链中可再生能源的集成
本文介绍了生物质及生物燃料的生产-供应区域网络合成的步骤和方法。第一步是形成区域 集,以使整个供应链网络中的区域间生物能交换对环境所造成的影响最小化。一个集可以理 解为一组由能量传递链相连的有关区域,它们通过使用当地的基础设施来达到能量的传递。
开发了区域能源聚类 Regional Energy Clustering(REC)算法,以管理区域之间的能量平 衡。对不同区域的能量盈余和赤字进行匹配和组合,可形成能源供应链集群。REC的分析结 果用区域能源供-需曲线(RESDC)进行了形象的诠释。RESDC是一对累积曲线,代表累积盈 余和赤字,它能够显示每个区域集的大小以及其中供应链所包含的总能量。
然后,我们通过区域资源管理复合曲线(Regional Resources Management Composite Curve,
本文将之缩写为RMC)对REC的结果进行了进一步的分析。开发RMC的主要目的是为了同时处 理生物质供应链、运输和土地利用等问题。 RMC是一个区域资源管理决策支配工具,它提 供了一个地区内的可用能源和土地的完整视图,并把权衡考量都显示在一个单一的图表中。
本文提出了一组如何操作RMC的规则,这些规则可以在操作区域资源(如土地和盈余能量)
时实施。对于如何用一个图来管理区域资源,这些规则为规划者提供了一个清晰的概图和有 用提示。
网络的合成是通过工艺图(P-graph)实现的。P -图是一个有向二部图,有两种顶点 : 一 个表示操作单元;另一个表示代表物质或能量流股/数量的对象。在这个过程中,首先生成 了一个关于生物质生产网络的所有可行的超结构,然后由分支定界方法从中选择出最优结 构。这个基于图表的方法清楚地表明哪里、如何、什么样的物质和能源载体将从一个供应链 层转移到另一个。
为了检验该模型的效率,我们进行了示范案例研究,即用这些方法来解决区域可再生能源网 络问题。对该方法的效能测试结果证实了其在区域范围内的适用性。结果非常乐观,同时,
在结论部分对今后的工作提出了一些建议。
X
ACKNOWLEDGEMENTS………... III
ABSTRACT………... V
KIVONAT (Abstract in Hungarian) ...….……….…………... VII 摘要(Abstract in Chinese)..……….………...
TABLE OF CONTENTS………..
IX X
LIST OF FIGURES….………... XII
LIST OF TABLES………... XIV
NOMENCLATURE………..………... XV
1. INTRODUCTION………..………... 1
1.1. Problems Definition………... 2
1.2. Research Objectives………... 4
1.3. Methodology and Research Strategy.……….………... 5
1.4. Outline of the Thesis………... 8
2. LITERATURE REVIEW………. 10
2.1. Biomass as the Future Energy Sources………... 10
2.2. Environmental and Ecological Indicators……….... 18
2.3 Overview of the Biomass Supply Chain and Network Synthesis………... 22
2.4 Optimisation with Mathematical Programming……...……….……... 26
2.5 P-graph Framework ……… 2.5 Graphical targeting approaches for heat recovery systems, hydrogen recovery and supply chains ………..……….……….. 33 40 3. REGIONAL ENERGY CLUSTERING... 49
3.1. The REC Algorithm………... 50
3.2. Regional Energy Surplus-Deficit Curves (RESDC)……….... 57
3.3. Demonstration Case Study …...……..………... 58
3.4. Further Development of REC ….……… 62
XI
3.5. Chapter Summary……… 69
4. REGIONAL RESOURCE MANAGEMENT COMPOSITE CURVE…... 70
4.1. Construction of Regional Resources Management Composite Curve 71 4.2. Demonstration Case Study ……….…………... 74
4.3. Chapter Summary………... 83
5. OPTIMISATION OF REGIONAL RENEWABLE ENERGY SUPPLY CHAINS: P-GRAPH APPROACH... 85
5.1. P-graph Procedure for Biomass supply chain Synthesis... 85
5.2. Demonstration Case Study………... 87
5.3. Chapter Summary………... 95
6. SUMMARY OF ACCOMPLISHMENTS…... 96
6.1. Original Contributions... 96
6.1.1. Thesis………... 6.1.2. Tézisek (in Hungarian)………. 96 100 6.2. List of Publications……….………... 104
REFERENCES……….………..……… 108
XII
Figure 1.1: Two-level strategy for supply chain network synthesis... 6 Figure 1.2: Workflow in the energy supply chain... 8 Figure 2.1: Main conversion options for biomass... 12 Figure 2.2: Energy used for transporting 1 MJ of biomass energy
content 1 km………...…………...
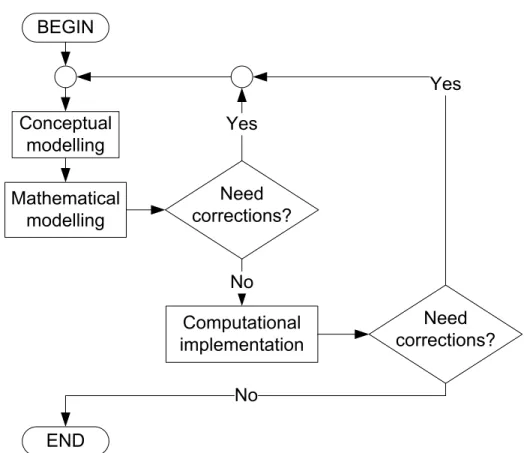
Figure 2.3: Environmental Performance Strategy Map ……… 21 Figure 2.4: Biomass flow in the energy supply chain………... 22 Figure 2.5: Major steps of process synthesis ……….……... 28 Figure 2.6: Model creation procedure ………
Figure 2.7: P-graphs representing the process structure
of three operating units...
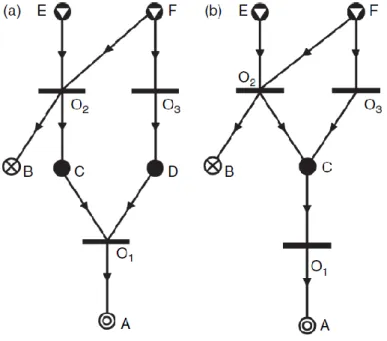
Figure 2.8: P-graphs representing process structures that violate (a) Axiom (S2) or (b) Axiom (S4)………
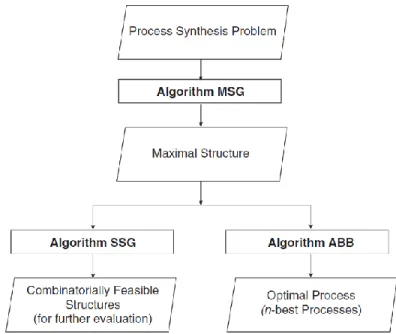
Figure 2.9: Inputs to and outputs from the three P-graph Algorithms...
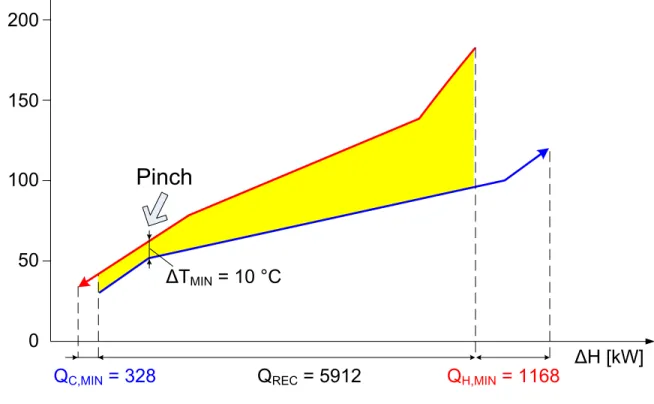
Figure 2.10: Heat recovery with Pinch Analysis……….
Figure 2.11: Composite Curves and hydrogen surplus diagram …………..
Figure 2.12: Material balance in aggregate planning………..
Figure 2.13: Supply Chain Composite Curve ……….
Figure 2.14: Generating the energy demand Composite Curve with CO2
constraint……….
Figure 3.1: Regional energy clusters……...………...
29 34 37 38 41 42 45 45 48 50 Figure 3.2: REC algorithm flowchart………... 51 Figure 3.3: Visual representation of the optimal biomass exchange flows.... 55 Figure 3.4: Optimal biomass exchange flows resulting from the LP
optimization ………..….. 60
Figure 3.5: RESDC for the case study………... 62 Figure 3.6: CFP Pay Back Analysis for alternative road construction...
Figure 3.7: Location of EFB suppliers and consumers………..
64 66
XIII
algorithm………... 75
Figure 4.3: Energy and land use management with the RMC ………. 76 Figure 4.4: Modification of the RMC if the surplus in Cluster 1 is exported to
energy market ………..………... 77 Figure 4.5: Modification of the RMC if a certain area in Zone 1 is used for
other purposes ………..………. 78
Figure 4.6 Modification of the RMC if a certain area in Zone 4 is used for
other purposes …....………... 79 Figure 4.7: Modification of the RMC if the surplus in Cluster 1 is transferred
to Cluster 2………..……….
Figure 4.8: Modification of the RMC if a certain amount of energy is
imported to fulfill the demand in Cluster 2.……….
Figure 4.9: Modification of the RMC if the biomass production rate in the Cluster 2 is increased …………..……….
Figure 4.10: Modification of the RMC if the energy demand in the Cluster 2 is reduced ………..……….
80 81 82 83 Figure 5.1: P-graph procedure for biomass supply chain synthesis... 86 Figure 5.2: Combinatorially feasible process structures... 90 Figure 5.3: Optimum solution for minimum production cost with P-graph
representation……….... 94
XIV
Table 2.1: Environmental limits for emissions from incineration 14 Table 2.2: Pros and cons of biomass utilisation ………
Table 2.3: P-graph symbols that represent process elements……….
Table 3.1: Data structure for regional energy clustering……...
15 33 52
Table 3.2: Regional data for demonstration case study... 59
Table 3.3: Optimised bioenergy exchange flows……... 59
Table 3.4: Cluster properties... 61
Table 3.5: Data for EFB Suppliers and Consumers………... 67
Table 3.6: Distance between EFB suppliers and consumers... 67
Table 3.7: Parameter for CHP calculation………... 68
Table 3.8: Allocation of EFB between Suppliers and Consumers... 68
Table 4.1: Regional data for demonstration case study for RMC case study 74 Table 4.2: Data for RMC construction ………. 76 Table 5.1: Materials and streams used in the case study……...
Table 5.2: Candidate operating units specification………
91 92
XV Abbreviations
ABB Accelerated Branch-and-Bound (algorithm) AD Anaerobic digester
CFP Carbon Footprint
CHP Combined heat and power EFB
FP
Empty fruit bunches Fermentation plant
FC Fuel cell
FCGT Combined fuel cell and gas turbine
G Gasifier
GIS Geographic Information System
GT Gas turbine
HRSG Heat recovery steam generator HDV Heavy Duty Vehicles
INC Incinerator
JEP Juice extraction plant LCA
LF
Life Cycle Assessment Landfill
NG Natural gas
MSG Maximal Structure Generation MSW Municipal Solid Waste
PP Pellet plant
POB REC
Palm oil biomass
Regional Energy Clustering RES Renewable energy sources RESDC
RMC
Regional Energy Surplus-Deficit Curves
Regional Resource Management Composite Curve
XVI SSG Solution Structure Generation
ST Steam turbine
T WTE
Transport
Waste to Energy
XVII Subscripts
i index for source zones
j Index for sink zones
Mathematical operator meaning “each”
Parameters Ai
ABi
Total area of Area for Zone I, km2 Available biomass surplus in Zone i, t Acc Fixed capital costs, €
Bcc Linear cost coefficient for calculating capital cost, €/MW
C HVD capacity, t
CEF Carbon Emission Factor, (kg CO2)/(L of fuel) CFP Total CFP for biomass transfer, CO2/y
CFPi,j CFP for biomass transfer from Zone i to Zone j, kg CO2/y Di Energy demand of Zone i, TJ/y
Disti,j Two-way distance, km
FC i,j Specific Fuel Consumption for transporting biomass, L/km HVi Heating value for the biomass from Zonei, GJ/t
Li
f
Energy land use rate for Zone i, km2/TJ
Energy conversion from the raw materials to the final energy carriers such as heat and energy, TJ/TJ
Nzones Number of zones
Si Energy supply of Zone i, TJ/y TDj Total deficit of Zone j, TJ/y UCap Operating unit capacity, MW or t ceffik
PTR PM
Efficiency of satisfying demand i if he belongs to Cluster k Transportation Cost €
Maintenance Cost €
XVIII
BEi,j Bioenergy delivered from Zone i to Zone j, TJ/y CC
PBCFP
PBCost
Yi,k
Mk
Capital cost, €
CFP payback period, y Cost payback period, y
Binary variable which denotes demand Di to Cluster k Infrastructure maintenance of cluster k
1
Renewable sources of energy have been used as direct and mostly prime energy resources since the beginning of civilization. The direct heat captured from solar irradiation has been used for heating and drying. When stored in the biomass the solar energy had been used for heating and cooking. When with the humans develop further simple tools they also managed to exploit the hydro power for mechanical drive purposes. After the period when the fossil fuels had been to most widely used source of energy for the developed economies, the implementation of renewable energy has been considerably extended with novel high-tech technologies. This has been mainly due to the pressure of the growing energy demand and environmental issues.
Over the recent decades, global energy demand has increased due to the world economy growing (National Petroleum Council, 2007). It is expected that the expanding populations and developing economies are going to result in continuous increases in energy demand in the near future – experts have predicted that by 2030, world energy consumption will increase by as much as 50% from the year 2000 levels (IEA, 2010;
Schumacker, 2010).
The continuously increasing energy demand in the transportation however also in residential, commercial and to the certain extend in industrial sectors. They consume enormous amounts of fossil fuels. The global energy crunch scenario (Friedrichs, 2010) as well as the environmental impact issues lead to a key problem to be solved: How to achieve economic development with sufficient energy supply while minimising the environmental problems to an acceptable levels? Utilisation of renewables, notably regionally available biomass, as energy resources is one of the key actions to address this issue (Faaij, 2006; Karp and Shield, 2008; Narodoslawsky, 2010). Several studies have predicted that the use of biomass would be increased significantly in the future
2
(WEA, 2004; IEA, 2005) and the European Commission has stipulated strongly its extended use as renewable energy sources (RES).
This thesis proposes several tools for regional energy targeting and supply chain synthesis using conceptual insight and appropriate visualisation. A demand-driven approach is applied to assess the feasible ways for transferring energy from renewable sources to customers in a given region. These graphical tools provide straightforward information of how to manage the available resources (biomass and land use) in a region.
1.1 Problem Definition
Utilising biomass as an energy source requires innovative technologies to be efficient and economically competitive. The biomass supply potential is constrained by its features as low energy density, high specific land use (area per unit energy) and distributed availability. For those reasons the biomass energy infrastructure is generally more expensive to build and operate then that for standard fossil fuels. Building and use the infrastructure to transfer biomass energy over longer distances would tend to increase its cost.
Another challenge is the land use and the management of resources. Biomass mostly requires large land areas to collect and process the incoming solar radiation before the energy can be harvested. Because of the growing demand for energy crops, agricultural production, the land for settlement, and land use management, form an environmental and societal trade-off. The large land areas required for growing energy crops and refining them into marketable fuels can result in food price increases and deforestation (Koh and Ghazoul, 2008). This in turn could lead to the loss of biodiversity and create a conflict between the atmospheric carbon balance and natural ecosystems (Huston and Marland, 2003), leading to net CO2 build-up in the atmosphere.
3
Besides economic optimisation, the reduction of the environmental impact over the whole life cycle has become a necessity. One of the environmental impact indicators is the carbon footprint - CFP (POST, 2006). Since the biomass sourcing locations (farms, forests etc.), require supply chain infrastructure, which includes field and road transport for collection and transportation, these would tend to increase the CFP of biomass energy supply.
The distributed availability of biomass over regions indicates that future bioenergy industrial structure should be necessarily more decentralised (Narodoslawsky, 2010). A method for optimal synthesis of regional biomass supply chains is needed accounting its logistic properties –the low transport density and high moisture content. A new balance between the 'environmental' and the 'economical' will have to be found:
transport of the biomass and the associated energy consumption and CFP have to be balanced against the efficiency increase of larger scale installations. The solution will likely be a moderately decentralised combination of collection points and process plants (Lam et al., 2010a; Narodoslawsky, 2010).
Based on the above analysis, there are several issues concerning regional biomass utilisation:
(i) The bio-energy networks should utilise the local raw materials to the maximum possible extent by generating as many useful products as economically feasible, at maximum efficiency to obtain the most favourable economics of the biomass utilisation.
(ii) The choices of feedstock and products are mutually related and affect significantly the overall economic viability and emissions. These are important information in designing the energy-product supply networks.
(iii) The trade-off between energy generation and land use should be tackled and solved simultaneously to avoid detrimental eco-social impacts to the considered region.
4
(iii) Another important challenge is to provide a framework and tools allowing the evaluation of alternative options for identifying, placing and sequencing the various processing and transportation operations in the supply networks.
1.2 Research Objectives
This thesis presents new methods for regional energy targeting and supply chain synthesis. The main objectives are:
i To develop a novel conceptual approach based on property targeting and visualisation, to the analysis and synthesis of renewable energy generation for a given region.
ii To enable identification of the maximum extent the local RES usage in a region.
iii To enable decision, asking for sustainable management of regional resources.
iv To provide a clear insight into renewable energy supply chains.
These objectives lead to the following specific research goals:
i Develop graphical tools to account for the interaction of each layer in a biomass production network.
ii Create an algorithm for the regional energy targeting and clustering.
iii Develop a visualisation allowing the decision makers to quickly evaluate the trade- off between the energy and land use issues.
iv Develop a combinatorially efficient synthesis procedure for biomass production networks.
5 1.3 Methodology and research strategy
Research is an intensive and purposeful search of knowledge (Kumar, 2008). In this thesis, it is more specific as a scientific activity undertaken to develop analytical tools for biomass supply chain synthesis.
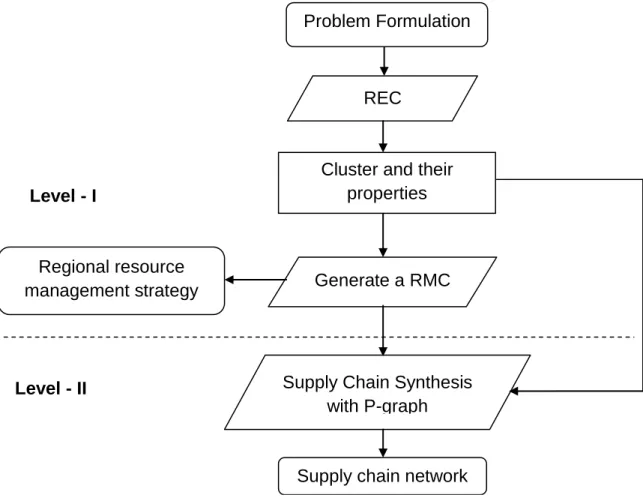
A two-level methodology for the synthesis of regional biomass energy supply chains has been formulated. The methodology is illustrated in Figure 1.1. This comprehensive research strategy is divided into two levels: supply-demand targeting and detailed supply chain synthesis. The first level including steps for REC, targeting the use of regional biomass resources and fossil fuels, and RMC provides the strategy for the regional resource management, which mainly involve the land-use and energy generation issues. In the second level, detailed supply chain synthesis inside each cluster step has defined a new application of the P-graph process optimization framework (Friedler et al., 1992).
Supply chains take as inputs various resources (biomass and fossil) and deliver to the final users of energy products – for instance heat, power, processed fuels such as pellets and ethanol. All unit operations in the supply chain can be characterised by relevant performance specifications, reflecting their energy conversion efficiencies, thus linking the product generation rates to the resource (input) consumption rates.
An energy supply system can include various components and contexts. The system boundary includes a region whose exact definition is case dependent. The region under consideration is modelled as a collection of zones. The zones are smaller areas within the region, accounting for administrative or economic boundaries, which are considered atomic (i.e. non-divisible). For each zone corresponding rates of energy demands and biomass resource availability are specified.
6
REC
Generate a RMC
Supply chain network Supply Chain Synthesis
with P-graph Level - I
Level - II
Problem Formulation
Cluster and their properties
Regional resource management strategy
Figure 1.1 Two-level strategy for supply chain network synthesis
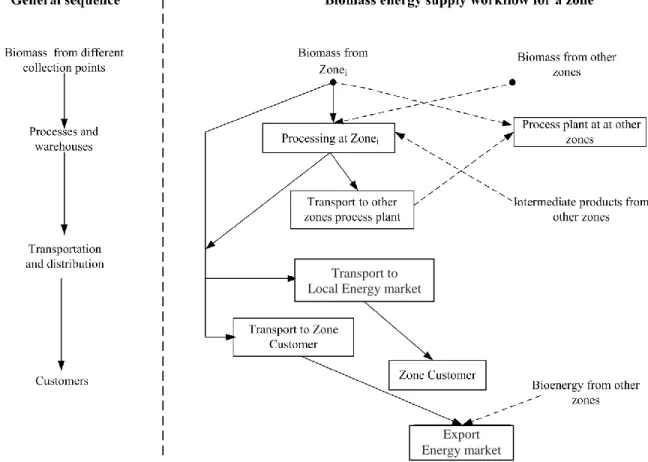
The workflow for delivering the energy from the biomass sources to the customers within a single zone is illustrated in Figure 1.2. The biomass raw materials, intermediate materials and the final products can be transported between the zones within the cluster, allowing larger processing facilities to be built, if this is economically beneficial.
7
Figure 1.2 Workflow for energy supply from biomass (Lam et al., 2010b)
On the left-hand side of Figure 1.2 is given the general sequence for harvesting, conversion and utilisation of the resources. The workflow used for identifying the possible streams/materials and the candidate operating units is shown on the right, following those generic stages. The solid line represents the transportation within the same zone, and the dotted line represents the transportation that into/ out crossing other zones.
Various interconnections are possible. They are constrained mainly by the compatibility between the materials and energy carriers, and also the operations. Additional constraints as upper bounds on throughputs and on investments are usually imposed.
Due to the mainly topological complexity the synthesis procedure beneficially employs the P-graph framework.
Transport to Local Energy market
Export Energy market
8
1.4 Outline of the Thesis
After the introduction provided in this Chapter 1, Chapter 2 gives the review on the topics related to the research scope and background, such as
(i) Renewables as the future energy sources,
(ii) Biomass supply chains and biomass to energy technologies, (iii) Biomass supply chain synthesis,
(iv) Applying and extending the Process Integration methodology into new fields.
Chapter 3, 4 and 5 present the original research outcome of this PhD works. Chapter 3 demonstrates the development of Regional Energy Clustering (REC) algorithms (Lam et al. 2010a). The developed mathematical Programming model is presented and supported by a case study demonstration. Furthermore, the extension work from REC is also presented such as the CFP pay back analysis and the application of REC in the waste-to-energy network synthesis.
Chapter 4 extends the techniques of REC to regional resources management with a novel tools namely Regional Resource Management Composite Curve - RMC (Lam et al., 2010c). A step-by-step case study is given demonstrating how to apply the RMC in handling a trade-off problem: competitive land use and energy generation.
Chapter 5 tackles the synthesis of biomass energy networks using P-graph (Friedler et al., 1992). The procedure has steps for maximum structure generation and optimum structure generation.
9
Chapter 6 is the summary of accomplishments of this PhD. It concludes the original contributions of the PhD candidate works and also the list of publications related this PhD research topic.
10
Biomass is one of the key renewable energy sources (RES), offering the potential for reducing environmental impact regarding energy supplies (WEA, 2004; Karp and Shield, 2008; Demirbas, 2009). It is a versatile source from which heat, electricity, and liquid bio-fuels can be generated. Its utilisation can also improve energy security, the development of rural regions, and employment (Gwehenberger and Narodoslawsky, 2008). This chapter starts with a review of the potential of biomass as a future energy source and what are the pros and cons of utilising biomass for this purpose. This is followed by a review of biomass supply chain systems, as well as the environmental impact indicator along the systems. This chapter also provides an overview the application of mathematical programming in supply chain synthesis. The last part of this chapter presents the advantages of employing a graphical method for system analysis on the examples of Pinch Analysis and its modifications that could be further extended for biomass supply chain synthesis.
2.1 Biomass as the Future Energy Sources Potential sources of biomass
There are many types of types of vegetation in the world, and many ways they can be used for energy production (Faaij, 2006; Karp and Shield, 2008). In general there are two approaches: growing plants specifically for energy use (energy crops), and using the residues from plants to be used for other things. The best approaches vary from one region to another according to climate, soil properties, geography, population, etc (Faaij, 2006).
11
The main sources for biomass are generally divided into these categories:
Energy crops can be grown on farms in potentially very large quantities, however in many cases replacing and competing with food crops, for example corn, sugar cane and sweet sorghum (Faaij, 2006, Demirbas, 2009).
Multifunctional crops could be used both for food and energy production simultaneously for example corn grain for food and corn stover for energy generation (Čuček et al., 2010).
Oil plants. Plants such as soybeans (Mandal et al., 2002), oil palm (Prasertsan , 1996; Lam et al., 2010d) and Jatropha (Achten et al, 2008) produce oil, which can be used to produce fuels. A rather different type of oil crop with great promise for the future is microalgae (Chinnasamy et al., 2010).
Forestry waste and woods. Forestry waste Schlamadinger and Marland, 1996) and wood waste are sawdust and bark from sawmills, shavings produced during the manufacture of furniture, and organic sludge (or "liquor") from pulp and paper mills (Joshi and Mehmood, 2010).
Other biomass residues. The forestry, agricultural, and manufacturing industries generate plant and animal wastes in large quantities (Faaij, 2006). City waste, in the form of rubbish and sewage, is also a source for biomass energy.
Biomass conversion technologies
The traditional way of converting biomass to energy, practiced for thousands of years, has been to simply burn it to produce heat. The heat can then be used directly, for heating, cooking, and also for industrial purposes. Today, new ways of using biomass are still being discovered and it always refer as analogy from waste-to-energy technologies (Vollebergh, 1997; Maniatis and Millich, 1998; Turkenburg et al., 2000;
Stehlík, 2007a, & 2007b; Celma et al., 2007; Stehlík et al., 2008; Demirbas, 2009;
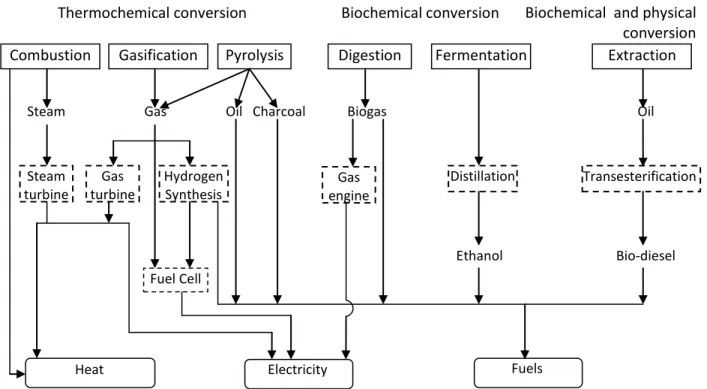
Veringa 2010; Gregg, 2010). The general paths for biomass conversion and utilisation technology options are shown in Figure 2.1. The main routes are analysed next.
12
Thermochemical conversion Biochemical conversion
Combustion Gasification Pyrolysis Digestion Fermentation Extraction
Steam Gas Oil Charcoal Biogas Oil
Steam turbine
Gas turbine
Hydrogen Synthesis
Distillation
Fuel Cell
Ethanol Bio-diesel
Heat Electricity Fuels
Transesterification Gas
engine
Biochemical and physical conversion
Figure 2.1 Main conversion options for biomass (Turkenburg et al., 2000)
Combustion and incineration. A classic application of biomass combustion is heat production for domestic applications (Faaij, 2006; Stehlík, 2007a).
Traditionally, the use of wood generally takes place at low efficiency and generally emits considerable amounts of pollutants such as dust and soot.
Technological development has led to the application of improved heating systems, which are automated, have catalytic gas cleaning and make use of standardized fuels (Stehlík, 2007a & 2007b; Stehlík, 2009). Incineration of biomass combined with waste can be considered as a form of recycling energy contained in treated materials. It partly releases the energy consumed during their production. Biomass combustion is labelled as waste-to-energy technology (WTE) (Stehlík, 2009). WTE is also referred to as the thermal processing of waste, including energy utilization. The combustion (thermal processing, incineration) of various types of waste is substantially reducing the waste volume and in addition, WTE systems can provide relatively clean, reliable, and renewable (to some extent) energy.
13
Gasification. Gasification is one of the technologies for utilising the thermo chemical conversion of biomass through the generation of gaseous fuels suitable for more efficient consumption (Kirubakaran et al., 2009). Gasification with air is a conversion of organic matter into low-energy gas (syngas or synthesis gas) which, after some modification, is suitable for use in boilers, combustion engines, gas turbines and, after proper cleaning, even in high-temperature fuel cells (Varbanov and Friedler, 2008).
Anaerobic digestion is a biochemical process where, in the absence of oxygen, bacteria break down organic matter to produce biogas and digestate (De Baere and Mattheeuws, 2008). The digestate can be produced out of many different kinds of biomass such as energy crops, organic waste, manure or a combination of these raw materials.
Fermentation usually refers to the bioethanol production such as from corn (Mojović et al., 2006) , sugar cane and sweet sorghum (Nguyen and Prince, 1996) Selection of a convenient biomass utilisation method needs to conform to the applicable local environmental legislation. National environmental legislations are far from uniform;
large variations can be found when comparing different countries (Stehlík, 2007b). The differences among emission limits of EU, the USA, and China are displayed in Table 2.1 (Stehlík, 2007b).
The values in the Table 2.1 are related to allowable emissions limits based on concentration (mg/Nm3) and they are not measured in total volume. The limits are given by environmental legislation and are obligatory for medium and large sources of emissions generation. E.g. NOx concentration is re-calculated to NO2 concentration and measured before the stack in incineration plants. The same is valid for other emissions.
The measurement is collected at the end of the discharge point.
Table 2.1 Environmental limits for emissions from incineration (Stehlík, 2007b)
14
Pollutant Units EU USA China
Dust mg/Nm3 10 24 80
CO mg/Nm3 100 62.5 –
187.5
150
NOx mg/Nm3 200 – 400 308-370 400
SO2 mg/Nm3 50 85.7 260
HCl mg/Nm3 10 41.3 75
Hg mg/Nm3 0.05 0.08 0.02
Cd + TI mg/Nm3 0.05 0.02 0.1
As +Co+Ni+Cr+Pb+Cu+Mn+V+Sb mg/Nm3 0.5 0.2 1.6
Dioxins/furans TEGng/Nm3 0.1 0.1 – 0.3 1.0
Pros and Cons of Biomass Utilisation
All energy sources have advantages and disadvantages, and it is important to evaluate them to determine whether the particular source (e.g. biomass) is really clean, safe, efficient, and effective. Table 2.2 summarises the main pros and cons of biomass utilisation.
There are always topics for the discussion about the pros and cons of biomass utilisation, for example: Is biomass energy better in production cost? Biomass is usually locally available. The typical locations of biomass sources (farms, forest, etc.) have the relatively low energy density, and the distributed nature of the sources require extensive infrastructures and huge transport capacities for implementing the biomass supply networks. For regional biomass supply chains road transport is the usual mode for collection and transportation. This tends to increase the cost of the biomass based energy. From the regional development point of view, biomass energy can be produced and supplied in the area, so there is no need for large pipelines or other massive infrastructure building. This also eliminates or decreases the cost and maintenance fees
15
caused by vehicles transporting the energy source from a long distance source point, e.g., the natural gas sending over from Russia.
Table 2.2 Pros and Cons of Biomass Utilisation (Hall and Scrase, 1998; Demorbas, 2009; Biofuel Watch, 2010)
Impact Advantages Disadvantages
Environmental Cleaner energy alternative to Fossil fuels
Waste-to-energy
Overuse threatens biodiversity
Green house gases emitted along the supply chain Societal and -
economical Can reduce the dependence of fossil fuels (imported in most countries)
Can stimulate regional growth
Maximise the usage of local energy sources and increase the productivities
Increase the local job opportunity for rural areas
Security of energy supply
Development of related industries
Export potential
Higher production cost
Land-use limitation
May reduce food production
Another hot issue: Is biomass energy clean enough? In one hand, biomass is considered ―clean – low carbon emission‖.
Biomass is considered as Clean Energy because it can be naturally replenished (Karp and Shield, 2008; Demirbas, 2009) through the process of photosynthesis, chlorophyll in plants captures the sun's energy by converting CO2 from the air and water from the ground into carbohydrates, complex compounds composed of C, H2 and O2. When these carbohydrates are burned, they turn back into CO2 and water and release the sun's energy they contain. On the down side, the biomass process plant has to be
16
properly designed else It can release greenhouse gases into the atmosphere when burned. Therefore, biomass energy plants need to be equipped with exhaust gas cleaning technology to make them completely environmentally friendly. Furthermore, biomass processes required a huge amount of power for the pre-treatment such as drying, chipping, compacting, cutting and shredding massive volumes of biomass is frequently required.
The higher production cost as compare to fossil fuel would put biomass at disadvantage in purely economic terms (Krotscheck et al., 2000). The nature of biomass: distributed source points and low energy - mass density increase the load of transportation, which directly affected the biomass production cost. Moreover, harvesting, collecting, and storing raw biomass materials can be very costly, especially if we take into consideration the large volumes needed in comparison to fossil fuels. This observation contradicts the conventional industrial wisdom regarding the economy of scale, where larger plants are usually favoured, and processing is centralized. Centralised biomass processing over a larger area would eventually lower transportation efficiency in the case of transporting raw biomass, due to the unnecessary amounts of water and the low physical density of the transported materials’ volumes. Even though, such cleaning technology is often not economically feasible for smaller plants. There are always a pay-off for the economical impact, especially the development of regional scale biomass utilisation always bring a potential job and export (energy and other biomass products) opportunities.
The pre-treatment step has a significant influence on the performance of bioenergy networks, especially on logistics. Densification, compaction, and drying prior to transportation is crucial, as converting biomass into a higher density intermediate product can save transport and handling costs. It can improve the efficiencies of the conversion stages (Uslu et al. 2008).
17
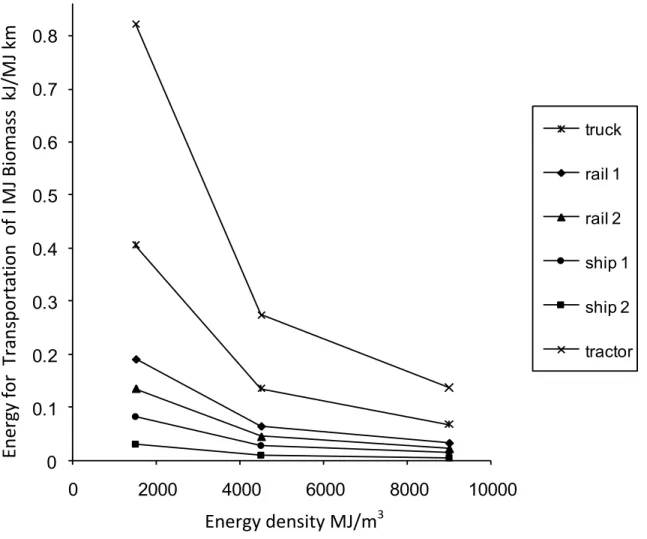
The importance of pre-treatment is supported by studies on the types of biomass transportation. Gwehenberger and Narodoslawsky (2008) evaluated the energies used by several modes when transporting biomass. Figure 2.2 shows that transportation using ships uses the smallest amount of energy, whilst, in contrast, transportation of low-density raw materials such as straw using tractors uses a greater amount of energy.
0 0.1 0.2 0.3 0.4 0.5 0.6 0.7 0.8 0.9
0 2000 4000 6000 8000 10000
truck rail 1 rail 2 ship 1 ship 2 tractor
Energy density MJ/m3
Energy for Transportation of I MJ Biomass kJ/MJ km
Figure 2.2
Energy used for transporting 1 MJ of biomass energy content 1 km (Gwehenberger and Narodoslawsky, 2008)
Because of the growing demand for biomass energy crops, agricultural production, the space for settlement, and land use management, form an environmental and societal trade-off. The large land areas required for growing energy crops and refining them into
18
marketable fuels can result in food price increases and deforestation (Koh and Ghazoul, 2008). This in turn could lead to the loss of biodiversity and create a conflict between the atmospheric carbon balance and natural ecosystems (Huston and Marland, 2003).
Land use conflict occurs when the land in an area is limited and the same land can support a variety of different uses. The latter define a trade-off scenario for the region.
Because of the significant growth in world population and the resource demand per capital, it makes land use management more critical: to produce food, energy and space for living in a competing resource base. Consequently land use strategy is required to be properly planned for sustainable development (Chen et al., 2005). The planning should be focused on the social and economic needs with integral considerations of the environment to be sustainable in the long term.
The concepts of sustainable regional resource and land use management have been presented elsewhere. Yamamoto et al. (2000) developed a global land use and energy model (GLUE) to evaluate bioenergy supply potentials, land use changes, and CO2
emissions in the world. The model analyses the land use competitions and overall biomass flows. Silalertruksa et al. (2009) used consequential life cycle assessment (LCA) approach to evaluate the environmental consequences of bioenergy (bio-ethanol) policy target on land use and greenhouse gas emissions. A strategic method focused on the land-use trade-off between biomass production and other land uses such as for food crops and urbanisation development is needed.
2.2 Environmental and Ecological Impact Indicators
Energy production, transformation, transports and end-use generally impacts the environment and ecology even though form RES that has been claimed as green energy. Increasing efficiency along the energy supply chain can reduce the environmental impact of emissions, although increasing efficiency generally requires
19
greater operating cost, increasing the environmental burdens associated with these and somewhat offsetting the environmental gains of improved efficiency (Rosen, 2009).
There are several previous works demonstrated the implementation of different environmental/ ecological impacts:
i Rosen (2009) presented the potential usefulness of exergy in addressing environmental impact. Exergy analysis is a thermodynamic technique for assessing and improving systems and processes, which is similar but advantageous to energy analysis, in large part because it is based on the second law of thermodynamics. The exergy of an energy form or a substance is a measure of its usefulness. Relations between environmental impact and exergy in general and chemical exergy of waste emissions in particular are observed to support the use of exergy as such an indicator. The measure of disequilibrium with respect to a reference environment provided by exergy is considered, along with the consequence that the exergy of unrestricted waste emissions has the potential to impact the environment.
ii The Sustainable Process Index (SPI) developed by Narodoslawsky and Krotscheck (1995) is a useful approach to calculate the ecological footprint casused by a process. SPI is based on the assumption that a sustainable economy builds only on solar exergy. Surface area is needed for the conversion of exergy into products and services. Surface area is a limited resource in a sustainable economy because the Earth has a finite surface. Area is the underlying dimension of the SPI. The more area a process needs to fulfil a service the more it costs from the sustainable point of view. SPIonExcel (Sandholzer et al., 2005) calculates the ecological footprint and the SPI of a product or service through the input that characterizes the process given by an eco-inventory (Sandholzer and Narodoslawsky, 2007) . The eco-inventories used for the calculation of the overall footprint contain engineering mass and energy
20
flows of processes in terms of input and output flows. Two different classes of inputs, impacts and intermediates, can be defined. An intermediate is a flow derived from and/or going to another process. This includes processes like electricity generation, transportation or waste flows to treatment plants and also products going to final consumption. Intermediates are produced via processes using themselves mass and energy flows. Their ecological pressure can be traced back to these flows, which in themselves can be either impacts or other intermediates. The SPI approached has been used to evaluate environmental performance in (i) integrated bioenergy systems (Krotscheck et al., 2000), and (ii) energy production systems (Narodoslawsky and Krotscheck, 2004)
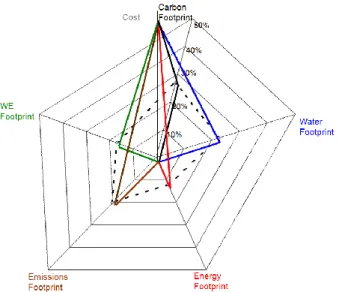
iii De Benedetto and Klemeš (2009, 2010) proposed a sustainable environmental performance indicator – Environmental Performance Strategy Map. This particular graphical map allows combination of the main environmental indicators (footprints) with the additional dimension of cost. The core of the concept is to calculate some specific sustainability indicators, based on Life Cycle Assessment (LCA). It is suggested to evaluate all options against the following categories:
• Carbon footprint;
• Water footprint;
• Energy footprint (Land, renewables, non-renewables);
• Emission footprint (emissions in air, in water, in soil, waste materials);
• Work environment footprint (work-environment and toxicological impacts).
To represent these relations and to compare options from an environmental and, more generally, business perspective a new graphical representation needs to be introduced: the Environmental Performance Strategy Map (Figure 2.3). The objective of this representation is to build upon the strength of Ecological Footprint and Life Cycle Analyses to provide a single indicator for each option.
The practitioner can make use of this indicator to direct the decision-making
21
process towards the best option from a sustainability and environmental perspective.
Figure 2.3 Environmental Performance Strategy Map (De Benedetto and Klemeš, 2009) In this work, Carbon Footprint (CFP) is used to evaluate environmental impacts of biomass process and supply chain. CFP as defined in (POST, 2006) is the total amount of CO2 and other greenhouse gases emitted over the full life cycle of a process or product. CFP has become an important environmental protection indicator as most industrialised countries have committed to reduce their CO2 emissions by an average of 5.2% in the period 2008–2010 in respect to the level of 1990 (Sayigh, 1999).
The CFP of a biomass supply chain is the total CO2 amount emitted throughout the supply chain life cycle (Perry et al., 2008). Energy supplied from biomass cannot be considered truly carbon-neutral even though the direct carbon emissions from combustion had been offset by carbon fixation during feedstock photosynthesis (Anderson and Fergusson, 2006). The net CFP is mainly caused by the indirect carbon emissions generated along the supply chain – especially by processing, transportation and burning which releases emissions. Especially transportation activities could contribute as the major part of the CFP in the supply chain (Forsberg, 2000).
22
Another CFP contribution results from the use of fertilisers and land cultivation activities for raising energy crops. The typical locations of biomass sources (farms, forest, etc.), the relatively low energy density, and the distributed nature of the sources require extensive infrastructures and huge transport capacities for implementing the biomass supply networks. For regional biomass supply chains road transport is the usual mode for collection and transportation. This tends to increases the CFP of the biomass based energy.
2.3 Overview of the Biomass Supply Chain and Network Synthesis
A typical biomass supply chain is shown in Figure 2.4. Maximising renewable energy utilisation requires a balanced mix of primary resources, including biomass, integrated in combined supply chains with food production and waste management (Junginger et al., 2001; Raven and Gregersen, 2007). Biomass supply chains deal with harvesting, densification, drying, storage, and transportation activities. Shah and his group (Dunnett et al., 2007) presented a systems modelling framework for the simultaneous design and operations scheduling of a biomass to heat supply chain. They proposed an efficient scheduling system that is affected by the harvest yield, crop moisture content, ambient drying rates and seasonal demand. Rentizelas et al. (2009) focus on the logistics issue of biomass utilisation, especially the storage and multi-biomass supply chain optimisation. The scope of those papers involves only harvesting, transportation and storage of biomass and does not integrate the energy conversion processes into the supply chain.
Industry Resident Commerce Electricity
Heat Fuel Transportation
Upstream Supply Chain
Downstream Supply Chain
Primary energy carrier Secondary energy carrier
Collection and distribution point & storage Biomass
Production and Pre-treatment
Energy conversion Plant & storage
23
Figure 2.4 Biomass flow in the energy supply chain (Lam et al., 2008)
There are also several biomass supply chain case studies presented such as:
i A case study of Far West Texas regional power generation systems has been presented by Becerra-López and Golding (2007). In this work the array of participating technologies has been optimised within a sustainability framework, which translates into a multi-objective optimisation problem. The problem is formulated and solved to determine supply shares for some chosen technologies based on both renewable power conversion and natural gas use. The cost based on the exergy and economic evaluations is established as primary competing factors. The deployment of renewable power technologies hypothetically follows the Gompertz Growth Model, which is constrained by exergy self sustenance.
The solution is given as a Pareto trade-off front for arrays of optimal technologies and capacities. Additionally, the sustainability of these arrays is analysed through indicators, and the current goal for renewable power technologies is discussed.
ii Junginger et al. (2001) proposed a fuel supply strategies for large-scale bio- energy projects – the electricity generation from agricultural and forest residues in North-eastern Thailand. The scope of study presented a methodology to set up fuel supply strategies for large-scale biomass conversion units (between 10 and 40 MWe), and to determine the connected risks and to minimize them. The methodology focuses (amongst others) on variations in residue quantities produced, limited accessibility of residues, utilization by other competitors and logistical risks. For each risk, possible ranges are determined and incorporated in different fuel supply scenarios which indicate how biomass quantities and prices may vary under different circumstances.
iii Freppaz et al. (2004) demonstrated a decision support system, which aim to optimise forest biomass exploitation for energy supply at a regional level. The
24
geographic information system based techniques are integrated with mathematical programming methods to yield a comprehensive system that allows the formalisation of the problem, decision taking, and evaluation of effects.
The aim of this work is to assess the possibility of biomass exploitation for both thermal and electric energy production in a given area, while relating this use to an efficient and sustainable management of the forests within the same territory.
iv Berndes et al. (2003) gave several case studies of the contribution of biomass in the future global energy supply. The question how an expanding bioenergy sector would interact with other land uses, such as food production, biodiversity, soil and nature conservation, and carbon sequestration has been insufficiently analyzed in the studies. A refined modelling of interactions between different uses and bioenergy, food and materials production - i.e., of competition for resources, and of synergies between different uses—would facilitate an improved understanding of the prospects for large-scale bioenergy and of future land-use and biomass management in general.
v A study of Mississippi region with the supply chain design for biomass-to-ethanol industry has been presented by Ambarish and his group (2008). This paper models the in-bound supply chain of a biorefinery as a network design problem with additional constraints. This model takes as an input the distribution and supply of biomass (corn and corn stover), and identifies the number and size of biorefineries needed to make use of the available biomass.
vi An Integrated Biomass Supply and Logistics (IBSAL) Model has been proposed and presented by Shahab et al. (2008). IBSAL is a powerful tool for evaluating the biomass supply chain from field to biorefinery. IBSAL consists of a series of equations that calculate the collectible fraction of biomass, while tracking biomass moisture during harvest and storage, machinery performance, compositional changes, and dry matter losses. The model analyzes the effects of
25
variations (annual weather patterns, variations in yield and moisture, variable biomass composition) associated with the feedstock supply.
vii Iakovou et al. (2010) gave an overview of the generic system components and then the unique characteristics of Waste biomass-to-energy supply chain management that differentiate them from traditional supply chains. Their work proceeds by discussing state-of-the-art energy conversion technologies along with the resulting classification of all relevant literature. It followed by the natural hierarchy of the decision-making process for the design and planning of waste biomass supply chain and provide a taxonomy of all research efforts as these are mapped on the relevant strategic, tactical and operational levels of the hierarchy.
The critical synthesis demonstrates that biomass-to-energy production is a rapidly evolving research field focusing mainly on biomass-to-energy production technologies.
There are several papers discussed and presented the implementation of regional clustering approach in the biomass production networks:
i Williams et al. (2008) presented a quantitative analytical method to provide delineation of agro-ecoregions in a more objective and reproducible manner, and with use of generalized crop-related environmental inputs offers an opportunity for delineation of regions with broader application. A raster (cell-based) environmental data at 1 km scale were used in a multivariate geographic clustering process to delineate agro-ecozones. Environmental parameters included climatic, edaphic and topographic characteristics hypothesized to be generally relevant to many crops. Clustering was performed using five a priori grouping schemes of 5–25 agro-ecozones.
ii Aguilar et al. (2009) utilized geo-referenced data on the location of primary wood products manufacturers in the US South to examine spatial clustering within this
26
industry. A marginal analysis indicated that counties with adequate transportation infrastructure and presence of related industries were most likely to attract new primary forest products manufacturers.
iii A two levels general Bioenergy Decision System (gBEDS) for bioenergy production planning and implementation was developed by Ayoub et al. (2007). It also includes a scenario database, which is used for demonstration to new users and also for case based reasoning by planners and executers. Based on the information base, the following modules are included to support decision making:
the simulation module with graph interface based on the unit process (UP) definition and the genetic algorithms (GAs) methods (Ayoub et al., 2007) for optimal decisions and the Matlab module for applying data mining methods (fuzzy C-means clustering and decision trees) to the biomass collection points, to define the location of storage and bioenergy conversion plants based on the simulation and optimization model developed of the whole life cycle of bioenergy generation.
iv Kajikawa and Takeda (2008) demonstrated their work in a citation network analysis of scientific publications to know the current structure of biomass and bio-fuel research. By clustering and visualizing the network, these revealed their taxonomic structure. Emerging technologies are detected by analyzing the average publication year of clusters. The paper also analyzed the position of each cluster in the global structure of research.
2.4 Optimisation with Mathematical Programming
Optimisation is one of the most powerful tools in process synthesis. Optimisation involves selecting the best solution from a set of candidate or feasible solutions (El- Halwagi, 2006). Process optimisation problems are formulated as mathematical models, where variables correspond to decisions - e.g., the flowrate of a stream, the amount of
27
heat provided by high-pressure steam - ,constraints corresponding to the conceptual model of the system - e.g., mass balance (Klemeš et al, 2010), and the objective function corresponding to the mathematical description of an optimisation criterion in the case of single-objective optimisation, or to the description of two or more criteria in the case of multi-objective optimisation.
Optimisation aims at finding appropriate values the variables, in such a way that (i) Constraints involving these variables are satisfied and
(ii) The objective function of the problem is minimised (or maximised). The constraints define the search space, whilst the objective function is used to determine the most favourable ―point‖ or ―points‖ within this space.
The principles of optimisation theory and algorithms are covered by various books (e.g., Grossmann 1996; Edgar and Himmelbalu 2001; Grossmann and Biegler 2004; Williams, 2005; El-Halwagi, 2006; Ravidran et al., 2006, and Klemeš et al., 2010) and overviews as Friedler (2009, 2010).
In general, a process synthesis problem is defined by specifying the available raw materials, candidate operating units, and desired products. Each of them is given by an individual mathematical model. The models cannot, by themselves, directly constitute the mathematical programming model for the synthesis problem. The mathematical model will be unclear with the risk of failure. The major steps of process synthesis are illustrated in Figure 2.5.