1
Differences of small-scale farmers and the related short agri-food value chains – an empirical evidence from Hungary
Zsófia Benedeka,*, Imre Fertőa,b, Lajos Barátha, József Tóthb
a Institute of Economics, Research Centre for Economic and Regional Studies, Hungarian Academy of Sciences
b Corvinus University of Budapest
* Corresponding author. E-mail: benedek.zsofia@krtk.mta.hu
Selected Paper prepared for presentation at the 140th EAAE Seminar, “Theories and Empirical Applications on Policy and Governance of Agri-food Value Chains,” Perugia, Italy, December 13-
15, 2013
Copyright 2013 by the authors. All rights reserved. Readers may make verbatim copies of this document for non-commercial purposes by any means, provided that this copyright notice appears on all such copies.
Abstract
Recently, short food supply chains have been thoroughly studied in some countries; however, data are sparse from others. In Hungary, the local food movement has been developing very fast and an outburst in the number of farmers markets has happened, due to the changes of the legal environment.
The paper addresses the question whether farmers selling at various short food supply chains are different based on their socio-demographic, farm- and production-related characteristics, expectations and motivations. Employing survey data our results confirm that short supply chains are different in terms of farmers’ profiles. The outcomes are important in the light of the coming EU funding schemes as different small-scale farmers require different supporting frameworks and solutions.
Keywords: short food supply chain, local food system, farmers’ market, organic farming JEL code: Q13, Q18, R58
2 1. Introduction
Conventional food supply chains may cause several sustainability problems (Farnsworth et al., 1996) including food security and ethical issues or environmental damages due to long-distance transport and logistics. Emergence of alternative and short food supply chains (SFSCs) that may be able to eliminate or diminish negative impacts of the conventional food system has been observed since the nineties, especially in developed countries (see e.g. Meter and Rosales, 2001; Tregear, 2011; Watts et al., 2005). SFSCs can be identified usually by two main characteristics (Kneafsey et al., 2013; Parker, 2005): food production, processing, trade and consumption occur within a particular narrowly defined geographical area; and the number of intermediaries (retailers) is minimised (ideally to zero).
There is an increasing body of literature on various aspects of SFSCs including potential economic, social and environmental benefits especially in the US, Australia, Northern and Western Europe (Kneafsey et al., 2013; Lea et al., 2006; Martinez et al., 2010; Pearson and Bailey, 2009). Although positive economic impacts of SFSCs in terms of higher farm income are commonly reported, empirical results only partially support this hypothesis (Kneafsey et al., 2013). Other related strand of literature focuses on the supply chain modernisation and governance structure in agri-food sectors with special emphasis on small-scale farmers (e.g. McCullough et al., 2008; Vorley et al., 2007).
Despite the research on supply chain modernisation in Central and Eastern Europe (Fertő, 2009), the role of SFSCs in this region is still unexplored. To bridge the gap, this paper focuses on farmers’
motivations regarding SFSCs in Hungary.
The local food approach in Hungary is still evolving by means of establishment and development of novel concepts such as community supported agriculture (estimated to involve approximately 10 CSA farmers in 2013, Réthy and Dezsény, 2013) or vegetable box schemes (with the first one established in 2008 in Budapest). On the other hand, forms such as markets, roadside or on-farm sales have long tradition. They have not disappeared during the transition; though official statistics are not able to provide information about the overall volume of food sold along these marketing channels. Recently Juhász (2012) has shown that within direct sales, market selling is by far the most important channel for the farmers, regarding their revenue. However, currently different market types are present in Hungary. “Traditional” markets and market halls (where the presence of retailers is predominate, though a smaller area is usually dedicated to producers, too) are maintained by local governments, there is no restriction about geographical distances. Since 2012, when the legal environment changed so the opening of farmers’ markets became much easier, the number of farmers’ markets has been increasing constantly. This market type is defined by law (producers operating within a distance of 40 km can sell their products) and typically run by NGOs or interested individuals. The third type is that of organic markets at which certification is required in order to sell. In this paper these differences are regarded.
Besides academic importance, research on SFSCs has also policy implications. Local food systems attract particular attention in the European Union. To answer the call, the Hungarian National Focus of the Rural Development Programme (2014–2020) involves the development of SFSCs in the coming budget period, which emphasizes the need for research input. In order to allocate the EU funds efficiently, the main characteristics (and capacities and needs) of small-scale farmers must be highlighted. The “one size fits all” policy approach is not efficient if potential heterogeneity of small- scale farmers using different marketing channels is taken into account, because they may require different supporting frameworks and solutions.
3
The literature offers various theoretical perspectives to analyse SFSCs (Tregear, 2011). For our purpose we investigate SFSCs as a mode of governance. Research on vertical coordination along food supply chain is commonly based on transaction cost theory or agency theory framework especially to study the choice of farmers between various marketing channels. However, our focus is different, because we address the issue why farmers do sell their products via SFSCs. More specifically, we concentrate on three main questions. First, what is the profile of the farmers selling in SFSCs? Second, is there any difference between various SFSCs regarding farmers’ profiles? Third, which farmer- and farm-specific factors may explain farmers’ decisions to sell at specific markets?
Survey data is analysed with statistical and semi-nonparametric models to present an empirical analysis of the key determinants of participation in SFSCs. Contrary to previous studies which concentrated mainly on potential economic benefits of farmers and consumers we investigate producers’ motivations regarding to SFSCs. This approach allows us to get more insights to better understand SFSCs.
The rest of the paper is organised as follows. Sampling and key variables are described in section 2.
This is followed by the presentation and discussion of the empirical results to explain the participation in SFSCs. The final section concludes.
2. Materials and methods
Our survey was conducted from April to June, 2013. 20 different traditional, organic and farmers’
markets were visited in Budapest (the capital, population of 1.7 million), Debrecen (the second biggest city of 207,000 inhabitants, county capital) and Tura (a small town of 8000 inhabitants in Pest County). All markets are held at least weekly, and many of them (especially the traditional markets), daily.
Independent variables can be classified into five groups:
a. Farmer-specific characteristics, such as age, education (measured on a scale of 5; 1: primary education (total studies of 8 years); 2: secondary education (total studies of 12 years); 3:
secondary education, with specialization in agriculture; 4: higher education; 5: higher education, with specialization in agriculture), years of experience, family background (farming traditions in the family), etc.;
b. Farm-specific characteristics, such as location (at settlement level), area size, size of rent, product diversity (number of products), number of permanent employees, use of organic methods, organic certification; etc.;
c. Motivations for selling at a specific market. Based on previous studies (Bakucs et al., 2012;
Bakucs et al., 2011; Juhász, 2012), the following motivating factors were identified a priori (and responses were categorized accordingly): higher price, prompt purchase in cash, all products can be sold; family and other traditions, other;
d. Future plans, external funding (support), participation in cooperation. These questions were used to analyse the openness of farmers.
e. Finally we focus on selling characteristics. Questions are raised about the marketing channels (both conventional and direct ones) used. Respondents were asked to characterize the importance of a mentioned channel on a scale ranging from 1 (occasionally used, not important in terms of
4
revenue) to 5 (most important in terms of revenue). This scale resembles the one of school grades in Hungary; therefore it can be easily interpreted by everyone.
Respondents are classified based on part e.; namely, which channel (market type) is considered as the most significant (4 or 5). If more types are mentioned as important, the following rank is applied:
traditional market (TM) < farmers’ markets (FM) < organic markets (OM); the respondent is classified according to the market of highest ranking.
Many of the questions resulted ordinal-scale answers, so non-parametric Kruskal-Wallis test was applied. We employ pairwise comparisons using Wilcoxon rank-sum (Mann-Whitney) tests with Bonferroni-corrected alphas, according to Marascuilo and Sweeney (1977).
Besides, to analyse factors that drive farmers’ decisions on where to sell their produce (whether to sell at traditional or farmers’ markets), we apply various discrete choice models. Discrete choice models usually adopt Maximum Likelihood techniques, using a priori chosen distributional assumptions.
However, parametric estimations are extremely sensitive on distributional assumptions; therefore, we employed the semi-nonparametric approach of Gallant and Nychka (1987) and the semi-parametric maximum likelihood approach of Klein and Spady (1993). We report only those models which perform better.
3. Results and Discussion
Final sample includes 156 observations. Most farmers are involved in horticulture, less in animal husbandry, while the number of mixed farms is the smallest. The number of farmers who apply organic methods is 33, and 21 of them are certified, too.
3.1. Identification of different farmers’ groups
Farmers are classified based on the market type (traditional market, farmers’ market or organic market) that they considered as the most important for them. 13 farmers preferred to sell their produce to wholesalers, specialized shops, etc., markets are not important for them; they are excluded from the comparisons.
Tables 1-3 are arranged as follows: first, the whole sample is characterised for a given variable; then average values of the three farmers’ groups are reported and compared with Kruskal-Wallis tests (p values are shown). Finally, the results of post tests are displayed. Having three pairwise comparisons, Bonferroni-corrected alphas are 0.033 (10%); 0.0167 (5%); 0.0033 (1%).
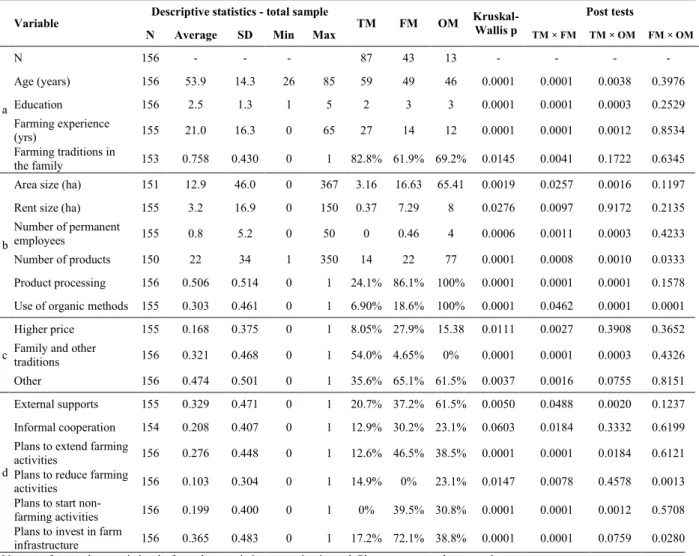
Table 1 shows the results for the four main variable groups: farmer characteristics; farm characteristics; motivations for selling at a specific market; plans, support and involvement in cooperation.
The results are in line with previous Hungarian and international studies (Fertő and Forgács, 2009;
Juhász, 2012; Kneafsey et al., 2013; Pearson and Bailey, 2009). Vendors of markets are typically middle-aged; organic farmers are younger and more educated. Farm size is relatively small; however, according to all variables connected to farm size (area, number of permanent employees, product diversity, etc.), there is a remarkable difference between TM farmers and the rest of the sample.
5
Motivating factors are different in the different farmers’ groups. Contrary to previous studies (Bakucs et al., 2012; Bakucs et al., 2011; Juhász, 2012), higher price as a motivating factor proved generally not to be the most important one in making decisions; habits and traditions have major role for TM farmers.
Small size is a limiting factor for TM farmers in applying for external funding. When farmers whose farm area size reached 1 hectare (which is the lower limit during applications) were compared, TM and FM farmers could not be differentiated (p=0.1913). Otherwise, FM farmers seem to be more open:
they much typically plan to extend their agricultural and non-agricultural but farm-related activities (based on the questionnaires, they most typically plan to be involved in rural tourism or to increase their capacity with respect to food processing) and invest in farm infrastructure and formal relationships.
Table 1. Selected variables in the total sample and among the farmers of different market types.
Variable
Descriptive statistics - total sample
TM FM OM Kruskal- Wallis p
Post tests
N Average SD Min Max TM × FM TM × OM FM × OM
a
N 156 - - - 87 43 13 - - - -
Age (years) 156 53.9 14.3 26 85 59 49 46 0.0001 0.0001 0.0038 0.3976
Education 156 2.5 1.3 1 5 2 3 3 0.0001 0.0001 0.0003 0.2529
Farming experience
(yrs) 155 21.0 16.3 0 65 27 14 12 0.0001 0.0001 0.0012 0.8534
Farming traditions in
the family 153 0.758 0.430 0 1 82.8% 61.9% 69.2% 0.0145 0.0041 0.1722 0.6345
b
Area size (ha) 151 12.9 46.0 0 367 3.16 16.63 65.41 0.0019 0.0257 0.0016 0.1197 Rent size (ha) 155 3.2 16.9 0 150 0.37 7.29 8 0.0276 0.0097 0.9172 0.2135 Number of permanent
employees 155 0.8 5.2 0 50 0 0.46 4 0.0006 0.0011 0.0003 0.4233
Number of products 150 22 34 1 350 14 22 77 0.0001 0.0008 0.0010 0.0333
Product processing 156 0.506 0.514 0 1 24.1% 86.1% 100% 0.0001 0.0001 0.0001 0.1578 Use of organic methods 155 0.303 0.461 0 1 6.90% 18.6% 100% 0.0001 0.0462 0.0001 0.0001
c
Higher price 155 0.168 0.375 0 1 8.05% 27.9% 15.38 0.0111 0.0027 0.3908 0.3652 Family and other
traditions 156 0.321 0.468 0 1 54.0% 4.65% 0% 0.0001 0.0001 0.0003 0.4326
Other 156 0.474 0.501 0 1 35.6% 65.1% 61.5% 0.0037 0.0016 0.0755 0.8151
d
External supports 155 0.329 0.471 0 1 20.7% 37.2% 61.5% 0.0050 0.0488 0.0020 0.1237 Informal cooperation 154 0.208 0.407 0 1 12.9% 30.2% 23.1% 0.0603 0.0184 0.3332 0.6199 Plans to extend farming
activities 156 0.276 0.448 0 1 12.6% 46.5% 38.5% 0.0001 0.0001 0.0184 0.6121 Plans to reduce farming
activities 156 0.103 0.304 0 1 14.9% 0% 23.1% 0.0147 0.0078 0.4578 0.0013 Plans to start non-
farming activities 156 0.199 0.400 0 1 0% 39.5% 30.8% 0.0001 0.0001 0.0012 0.5708 Plans to invest in farm
infrastructure 156 0.365 0.483 0 1 17.2% 72.1% 38.8% 0.0001 0.0001 0.0759 0.0280 Notes: a: farmer characteristics; b: farm characteristics; c: motivations; d: Plans, support and cooperation.
TM: traditional markets; FM: farmers’ markets; OM: organic markets.
Bonferroni-corrected alphas are 0.033 (10%); 0.0167 (5%); 0.0033 (1%).
Source: Own calculations based on the survey.
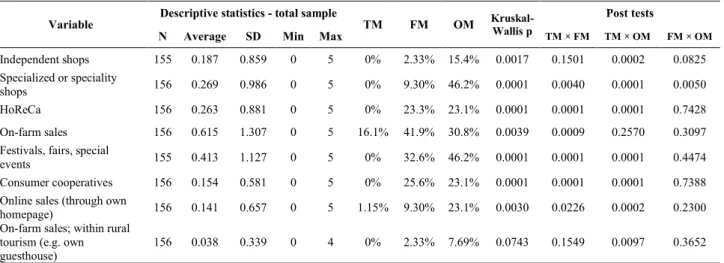
Table 2 displays the characteristics of some marketing channels of direct sales. HoReCa stands for the sector of Hotels, Restaurants and Catering. Currently, vegetable box schemes and home delivery services are typically provided by consumer cooperatives in Hungary. Other channels mentioned
6
include wholesalers, farmers’ cooperatives, public procurement, roadside sale, pick-your-own. Sample size seems to be too small to reveal characteristic differences along these channels.
Table 2. Marketing channels in the total sample and among the farmers of different market types.
Variable
Descriptive statistics - total sample
TM FM OM Kruskal-
Wallis p
Post tests
N Average SD Min Max TM × FM TM × OM FM × OM
Independent shops 155 0.187 0.859 0 5 0% 2.33% 15.4% 0.0017 0.1501 0.0002 0.0825 Specialized or speciality
shops 156 0.269 0.986 0 5 0% 9.30% 46.2% 0.0001 0.0040 0.0001 0.0050
HoReCa 156 0.263 0.881 0 5 0% 23.3% 23.1% 0.0001 0.0001 0.0001 0.7428
On-farm sales 156 0.615 1.307 0 5 16.1% 41.9% 30.8% 0.0039 0.0009 0.2570 0.3097 Festivals, fairs, special
events 155 0.413 1.127 0 5 0% 32.6% 46.2% 0.0001 0.0001 0.0001 0.4474
Consumer cooperatives 156 0.154 0.581 0 5 0% 25.6% 23.1% 0.0001 0.0001 0.0001 0.7388 Online sales (through own
homepage) 156 0.141 0.657 0 5 1.15% 9.30% 23.1% 0.0030 0.0226 0.0002 0.2300
On-farm sales; within rural tourism (e.g. own guesthouse)
156 0.038 0.339 0 4 0% 2.33% 7.69% 0.0743 0.1549 0.0097 0.3652 Notes: TM: traditional markets; FM: farmers’ markets; OM: organic markets.
Ratio of respondents mentioning the channel is shown among TM, FM and OM farmers.
Bonferroni-corrected alphas are 0.033 (10%); 0.0167 (5%); 0.0033 (1%)
Source: Own calculations based on the survey.
On average, TM farmers use much less marketing channels: 63% of them sell along only one channel, traditional markets (and typically, they spend all market days at the same market). The presence of long-term contracts with a market (and habits and traditions when they decide on a market where to sell) predominates among them (see Table 1 and 3).
FM and OM farmers use more channels in parallel (3.23 and 3.61 on average, respectively). Sales for specialized or speciality shops is more typical among OM farmers; otherwise they cannot be distinguished from FM farmers, based on how important they consider a given marketing channel.
However, the second most often used channel is different: while FM markers seem to prefer on-farm sales besides sales at farmers’ markets, organic farmers much more rely on festivals to sell their produce.
Table 3 shows some characteristics of sales.
Table 3. Characteristics of sales in the total sample and among the farmers of different market types.
Variable
Descriptive statistics - total sample
TM FM OM Kruskal-
Wallis p
Post tests
N Average SD Min Max TM × FM TM × OM FM × OM
More markets are attended 152 0.493 0.502 0 1 28.7% 93.0% 61.5% 0.0001 0.0001 0.0196 0.0048
Number of market days 151 3 2 0 14 3.23 3.23 2 0.0236 0.5821 0.0090 0.0126
Ratio of regular customers 143 58.8 23.1 0 100 57.1% 59.2% 72.7 0.0885 0.4982 0.0226 0.1101 Long-term contract with
the market 153 0.686 0.466 0 1 92.0% 40.5% 30.8% 0.0001 0.0001 0.0001 0.5328
Ratio of income generated by product processing (total sample)
151 22.8 36.8 0 100 6.6% 53.6% 32.4% 0.0001 0.0001 0.0001 0.1873 Ratio of income generated
by product processing (among those who deal with processing)
- - - - - 29.1% 62.4% 32.4% 0.0001 0.0001 0.0001 0.1873
Notes: TM: traditional markets; FM: farmers’ markets; OM: organic markets.
Bonferroni-corrected alphas are 0.033 (10%); 0.0167 (5%); 0.0033 (1%)
Source: Own calculations based on the survey.
7
TM farmers form a distinct group within the total sample; they are the most loyal to their chosen market. (Interestingly, they seem to have the lowest ratio of regular customers, but it can be revealed when they are compared to OM farmers.) The role of food processing is the smallest among them.
Previously at most traditional markets it was not permitted to sell processed food due to strict food safety regulations that did not distinguish between small-scale and industrial producers. Processed food (besides the fact that the increase of selection may attract further consumers) can result in higher prices and are of importance as the main generator of income especially out of the growing season.
Although the regulation has changed, most farmers have no knowledge about it. Thus, because of the problems of communication, many farmers think that they have no alternative but to buy produce (especially during winter) to be present on the market and not to lose their regular customers.
However, traceability of food, which is a key aspect of short food supply chains, becomes questionable this way.
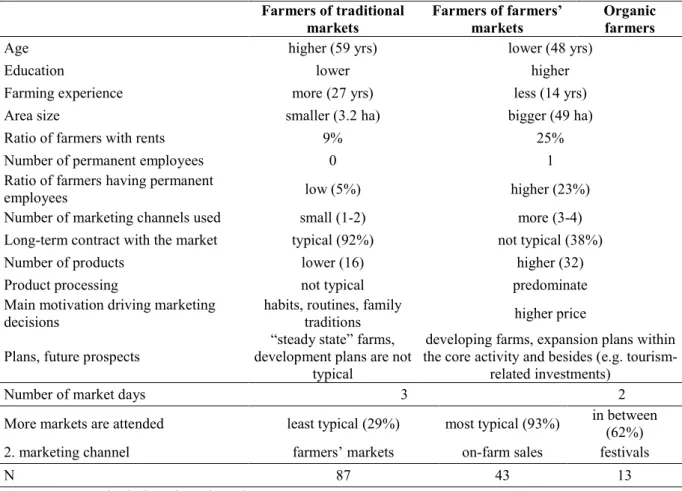
The most important findings are summarized in Table 4.
Table 4. Differences of farmers’ groups.
Farmers of traditional
markets
Farmers of farmers’
markets
Organic farmers
Age higher (59 yrs) lower (48 yrs)
Education lower higher
Farming experience more (27 yrs) less (14 yrs)
Area size smaller (3.2 ha) bigger (49 ha)
Ratio of farmers with rents 9% 25%
Number of permanent employees 0 1
Ratio of farmers having permanent
employees low (5%) higher (23%)
Number of marketing channels used small (1-2) more (3-4)
Long-term contract with the market typical (92%) not typical (38%)
Number of products lower (16) higher (32)
Product processing not typical predominate
Main motivation driving marketing decisions
habits, routines, family
traditions higher price
Plans, future prospects
“steady state” farms, development plans are not
typical
developing farms, expansion plans within the core activity and besides (e.g. tourism-
related investments)
Number of market days 3 2
More markets are attended least typical (29%) most typical (93%) in between (62%)
2. marketing channel farmers’ markets on-farm sales festivals
N 87 43 13
Source: Own calculations based on the survey.
Many different aspects of conventional and organic farmers are known; the novelty of this paper is that a further farmers’ group (that of farmers’ market farmers) is identified. FM farmers do not sell at traditional markets and with many respects, they resemble organic market farmers, but they usually do not adopt organic production methods. Main differences between FM and OM farmers seem to be connected to sales: the main marketing channels they use; FM farmers regularly attend more markets (possibly, because the sector of farmers’ markets is still changing; farmers are trying their luck
8
constantly to find the best alternative in terms of distance, turnover, etc). FM farmers also spend more time with selling.
Regarding most farmer- and farm-related characteristics, FM farmers cannot be differentiated from OM farmers. A possible solution would be the enlargement of the sample size; however, the number of organic markets is still low which may pose a barrier to such attempts in the near future. Some 20%
of FM farmers are organic farmers (with or without certification). The selection at farmers’ markets, compared to traditional markets, is big (especially with all the processed food involved) and high quality and trustworthiness is also attributed due to face-to-face interactions between farmers and consumers (Cavicchi et al., 2011; Lyon et al., 2009; Trobe, 2001; Vecchio, 2010). As prices at farmers’ markets are below that of the organic ones, farmers’ market farmers can be major competitors of the organic sector players – especially in the light of the finite financial possibilities of the average (conscious) consumers.
3.2. Factors influencing decisions about market type choice
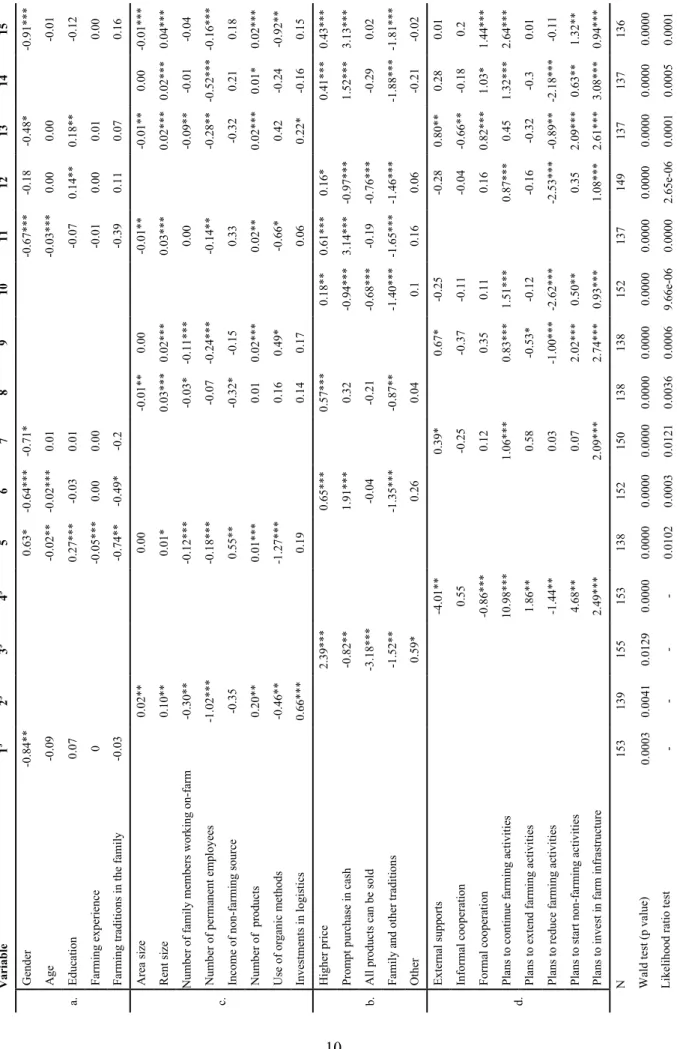
Response of all the 156 farmers is involved in this part of research. First, models are estimated for all variable groups (a-d) separately; then all the combinations are calculated. This results 15 models altogether, for both cases (selling at TMs as well as FMs), see Tables 5 and 6. The semi-nonparametric approach of Gallant and Nychka provides good results for most models, based on Wald-test and/or likelihood ratio test. The rest of the models are estimated with the semi-parametric maximum likelihood approach of Klein and Spady; these results are marked with $ in Table 6.
Table 5 shows the discrete choice models; the choice is whether to sell at traditional markets; Table 6 stands for farmers’ markets.
9 Table 5. The 15 semi-nonparametric models of ’Selling at TMs’.
15 -1,14* 0,03 -0,03 0,05* -1,36** -0,03 0 0,03 -0,57 -0,21 -0,01 -1,58* -0,82 0,07 -2,26* 0,87 3,42 -1,23** 0,83 -0,16 0,56 -0,95** -1,58*** 1,93 0,13 -0,08 136 0.0000 0,0036
14
-0.04** -0.03** 0.09** -0.77*** 0.69** -0.02 -1.79*** -1.94*** -0.16 -2.57***
0.75 4.79*** -1.50*** 0.62 1.11*** 0.42 0.37 -0.52 4.87*** -0.48 0.07 137 0.0000 0.0023
13 -1.25** 0.01 -0.39** 0.06*** -0.05 -0.04** -0.02 0.01 -0.10 -0.96* -0.013 0.07 -0.44
-0.51 0.31 0.20 -0.29 -0.59 19.jan 0.18 -0.14
137 0.0000 0.0149
12 -0.58*** 0.01 -0.19*** 0.04*** -0.29
-0.17 -0.51
0.11 1.09*** -0.42** -0.12 -0.14 0.49* -0.22 -0.55** 0.27 0.07 -0.14 149 0.0000 0.0000
11 -0.50 0.06*** -0.11 0.01 -0.64** -0.05*** -0.02* 0.02 -0.59** -0.41 -0.03*** -0.57* -1.08*** -0.90*** -3.19*** 1.27*** 4.68*** -1.15***
137 0.0000 0.0001
10
-0.27 -3.51** 0.20 2.22*** -0.68 -1.29** -0.13 -0.24 16.j
an -0.57 0.89 -1.13 -0.52 152 0.0000 0.0002
9
-0.10*** 0.02*
0.08 -0.36 -0.25 0.01 -2.33** -0.47**
0.28 -0.06 0.90 -0.38 -0.56 4.23*** 0.14 -1.13 138 0.0000 0.0226
8
-0.04*** -0.02*** -0.10 -0.80*** 0.45*** -0.02*** -1.25*** -1.28*** -0
.36*** -3.00*** 1.59*** 4.74*** -0.72***
138 0.0000 0.0008
7 -0.97*** 0.01 -0.41*** 0.04*** -0.08
-0.43*
0.08 0.37 -0.48 -0.42 0.43 -0.01 -0.41* 150 0.0000 0.0004
6 -0.47** 0.02*** -0.17** 0.04*** -0.10
-0.21*** -0.53
0.04 1.17*** -0.41*
152 0.0000 0.0005
5 -1.17*** 0.01 -0.33** 0.06*** 0.27 -0.04*** -0.02*** 0.01 -0.05 -0.56 -0.01* 0.05 -0.38
138 0.0000 0.0011
4
-1.57*** 0.82*** 1.53*** -0.06 -0.85*** 0.72*** -1.16 -1.67***
153 0.0000 0.0078
3
-0.63*** -2.84***
0.22 1.87*** -0.47
155 0.0000 0.0080
2
-0.05*** -0.01** 0.08*** -0.39*** 0.44* -0.01 -1.59*** -1.43***
139 0.0000 0.0077
1 -0.83*** 0.00 -0.39*** 0.05*** 0.20
153 0.0000 0.0001
Variable Gender Age Education Farming experience Farming traditions in the family Area size Rent size Family members working on-farm Number of permanent employees Income of non-farming source Number of products Use of organic methods Investments in logistics Higher price Prompt purchase in cash All products can be sold Family and other traditions Other External supports Informal cooperation Formal cooperation Plans to continue farming activities Plans to extend farming activities Plans to reduce farming activities Plans to start non-farming activities Plans to invest in farm infrastructure N Wald test (p value) Likelihood ratio test
a. b. c. d.
10
Table 6. The 15 semi-nonparametric and semi-parametric models (the latter marked with $) of ’Selling at FMs’.
15 -0.91*** -0.01 -0.12 0.00 0.16 -0.01*** 0.04*** -0.04 -0.16*** 0.18 0.02*** -0.92** 0.15 0.43*** 3.13*** 0.02 -1.81*** -0.02 0.01 0.2 1.44*** 2.64*** 0.01 -0.11 1.32** 0.94*** 136 0.0000 0.0001
14 0.00 0.02*** -0.01 -0.52*** 0.21 0.01* -0.24 -0.16 0.41*** 1.52*** -0.29 -1.88*** -0.21 0.28 -0.18 1.03* 1.32*** -0.3 -2.18*** 0.63** 3.08*** 137 0.0000 0.0005
13 -0.48* 0.00 0.18** 0.01 0.07 -0.01** 0.02*** -0.09** -0.28** -0.32 0.02*** 0.42 0.22* 0.80** -0.66** 0.82*** 0.45 -0.32 -0.89** 2.09*** 2.61*** 137 0.0000 0.0001
12 -0.18 0.00 0.14** 0.00 0.11 0.16* -0.97*** -0.76*** -1.46*** 0.06 -0.28 -0.04 0.16 0.87*** -0.16 -2.53*** 0.35 1.08*** 149 0.0000 2.65e-06
11 -0.67*** -0.03*** -0.07 -0.01 -0.39 -0.01** 0.03*** 0.00 -0.14** 0.33 0.02** -0.66* 0.06 0.61*** 3.14*** -0.19 -1.65*** 0.16 137 0.0000 0.0000
10 0.18** -0.94*** -0.68*** -1.40*** 0.1 -0.25 -0.11 0.11 1.51*** -0.12 -2.62*** 0.50** 0.93*** 152 0.0000 9.66e-06
9 0.00 0.02*** -0.11*** -0.24*** -0.15 0.02*** 0.49* 0.17 0.67* -0.37 0.35 0.83*** -0.53* -1.00*** 2.02*** 2.74*** 138 0.0000 0.0006
8 -0.01** 0.03*** -0.03* -0.07 -0.32* 0.01 0.16 0.14 0.57*** 0.32 -0.21 -0.87** 0.04 138 0.0000 0.0036
7 -0.71* 0.01 0.01 0.00 -0.2 0.39* -0.25 0.12 1.06*** 0.58 0.03 0.07 2.09*** 150 0.0000 0.0121
6 -0.64*** -0.02*** -0.03 0.00 -0.49* 0.65*** 1.91*** -0.04 -1.35*** 0.26 152 0.0000 0.0003
5 0.63* -0.02** 0.27*** -0.05*** -0.74** 0.00 0.01* -0.12*** -0.18*** 0.55** 0.01*** -1.27*** 0.19 138 0.0000 0.0102
4$ -4.01** 0.55 -0.86*** 10.98*** 1.86** -1.44** 4.68** 2.49*** 153 0.0000 -
3$ 2.39*** -0.82** -3.18*** -1.52** 0.59* 155 0.0129 -
2$ 0.02** 0.10** -0.30** -1.02*** -0.35 0.20** -0.46** 0.66*** 139 0.0041 -
1$ -0.84** -0.09 0.07 0 -0.03 153 0.0003 -
Variable Gender Age Education Farming experience Farming traditions in the family Area size Rent size Number of family members working on-farm Number of permanent employees Income of non-farming source Number of products Use of organic methods Investments in logistics Higher price Prompt purchase in cash All products can be sold Family and other traditions Other External supports Informal cooperation Formal cooperation Plans to continue farming activities Plans to extend farming activities Plans to reduce farming activities Plans to start non-farming activities Plans to invest in farm infrastructure N Wald test (p value) Likelihood ratio test
a. c. b. d.
11
Note: * significant at 10%, ** 5%, ***1%. Source: Own calculations based on the survey.
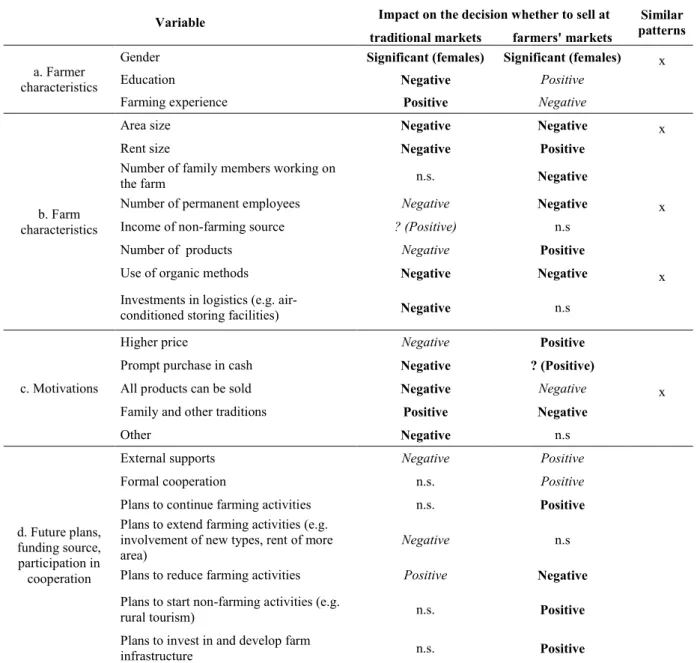
All variables are included in altogether 8 models out of the total 15. Tendencies are summarized and compared in Table 7. Any impact was taken as significant if it was found to be significant in more than 4 models (at either significance level). Any impact was taken as partially significant if it was found to be significant in 3 or 4 models (at either significance level). Signs were conservative in most cases (maximum 1 different sign was allowed); otherwise mark “?” shows in Table 7 that the given tendency is ambiguous.
Table 7. Factors influencing the decisions about selling at different markets.
Variable Impact on the decision whether to sell at Similar patterns traditional markets farmers' markets
a. Farmer characteristics
Gender Significant (females) Significant (females) x
Education Negative Positive
Farming experience Positive Negative
b. Farm characteristics
Area size Negative Negative x
Rent size Negative Positive
Number of family members working on
the farm n.s. Negative
Number of permanent employees Negative Negative x
Income of non-farming source ? (Positive) n.s
Number of products Negative Positive
Use of organic methods Negative Negative x
Investments in logistics (e.g. air-
conditioned storing facilities) Negative n.s
c. Motivations
Higher price Negative Positive
Prompt purchase in cash Negative ? (Positive)
All products can be sold Negative Negative x
Family and other traditions Positive Negative
Other Negative n.s
d. Future plans, funding source, participation in cooperation
External supports Negative Positive
Formal cooperation n.s. Positive
Plans to continue farming activities n.s. Positive
Plans to extend farming activities (e.g.
involvement of new types, rent of more area)
Negative n.s
Plans to reduce farming activities Positive Negative
Plans to start non-farming activities (e.g.
rural tourism) n.s. Positive
Plans to invest in and develop farm
infrastructure n.s. Positive
Bold: significant (significant in 5-8 models). Italic: partially significant (significant in 3 or 4 models). n.s.: not significant.
?: significant, but the sign varies in the models.
Source: Own calculations based on the survey.
Altogether 23 factors are identified as at least partially significant in shaping the decision of which market type to sell at in one or both arrangements. Similarities are found only in case of 5 factors.
12
Results are also in line with the previous outcomes. Traditional and farmers’ markets do form distinct farmer groups, based on their farmer- and farm-based characteristics and motivations. Compared to TM farmers, FM farmers are typically more educated, have less farming experience but tend to rent some area to improve their capacity, which results in the higher level of their product diversity. FM farmers are initiators: they have plans for the future, e. g. to invest in the farm infrastructure (for which they occasionally try to find some external financial support) or to launch non-farm but farm-related activities.
Motivations are also different in the two groups. Only farmers selling at FMs seem to decide rationally, based on financial considerations; they definitely reject habits and traditions as driving factors to make their choices. Patterns of TM farmers seem to be the contrary.
4. Conclusions
In response to the rapid and profound changes taking place in the Hungarian agri-food sector, the aim of this paper is to analyse factors that have impact on a farmer’s decision to sell their products via SFSCs. In addition, we were interested in the farmers’ profile preferring the use of SFSCs. Our key findings are following. In Hungary, farmers’ market as a channel is mostly used by a relatively young, educated and innovative group of small-scale farmers that differs from farmers of traditional markets, and to some extent (e.g. with respect to the use of organic techniques), from organic farmers.
Consequently, farmers previously selling at traditional markets typically do not use this new option so they seem to require further assistance (education, organizing body, etc.) to efficiently take part in the growing local food movement and so be able to achieve fair prices – if they are also able to produce high-quality products. Our major results are robust regardless to applied methodologies.
Our work presents novelty for the following reasons. Previously there was no data on farmers of Hungarian farmers’ markets whatsoever. Identification of farmers’ groups offers new insight, even in the international arena. Also, addressing motivation issues quantitatively is not a typical approach in the SFSC literature. There is another theoretical significance of our work: most studies analysing food supply chains are based on the theory of transaction costs economics, and three possibilities are distinguished with respect to marketing channels: markets, hybrid forms (such as contracts) and vertical integration (Fertő et al., 2010). Within this framework, market as such is assumed to be homogenous; however, the SFSC context may reveal that there are more market types that are the result of entirely different market needs and motivations.
The main limitation of our work is its representativeness. There are no previous national or regional statistics within the direct sales sector so results cannot be compared to any expectations. Furthermore, the number of farmers’ markets is still growing, importance of other marketing channels is increasing so further changes are anticipated.
13 Acknowledgements
The help of Zsuzsanna Nagy, Anett Privigyei, Zsolt Baráth and Gáborné Pecze interviewers and József Baráth, Irma Hellinger, Arnold Kucsera market managers in data collection is highly appreciated. The authors acknowledge the financial support of the National Agricultural Advisory, Educational and Rural Development Institute of Hungarian National Rural Network. Zs. B. was also supported by a grant of the Hungarian Scientific Research Fund (OTKA PD 109177). J. T. has got financial support from the Hungarian Scientific Research Fund (OTKA K 84327) ‘Integration of small farms into the modern food chain’.
References
Bakucs, L.Z., Fertő, I., Szabó, G.G., 2012. Benefits of a Marketing Co-operative in a transition agriculture: Mórakert Purchasing and Service Co-operative. Society and Economy 34, 453–468.
Bakucs, L.Z., Forgács, C., Elek, S., Fertő, I., 2011. The contractual relationships along food chains: a Hungarian example, EAAE Congress 2011, 30 August - 2 September, Zurich, Switzerland.
Cavicchi, A., Rocchi, B., Baldeschi, M., 2011. Consumers' attitude towards farmers' markets: an explorative analysis in Tuscany. University of Florence, University of Macerata.
Farnsworth, R.L., Thompson, S.R., Drury, K.A., Warner, R.E., 1996. Community supported agriculture: filling a niche market. Journal of food distribution research 27, 90-98.
Fertő, I., 2009. How can producers access the modern agri-food chain? A Central and Eastern European perspective. CAB Reviews: perspectives in Agriculture, Veterinary Science, Nutrition and Natural Resources 4, 1-9.
Fertő, I., Bakucs, Z., Elek, S., Forgács, C., 2010. Contracts in Hungarian Food Chains, MIC 2011:
Managing Sustainability? Proceedings of the 12th International Conference, Portorož, 23–26 November 2011 [Selected Papers]. University of Primorska, Faculty of Management Koper, pp. 425- 436.
Fertő, I., Forgács, C., 2009. The choice between conventional and organic farming–a Hungarian example. APSTRACT: Applied Studies in Agribusiness and Commerce 3.
Gallant, A.R., Nychka, D.W., 1987. Semi-nonparametric maximum likelihood estimation.
Econometrica: Journal of the Econometric Society, 363-390.
Juhász, A., 2012. A közvetlen értékesítés szerepe és lehetőségei a hazai élelmiszerek piacrajutásában [The current performance and opportunities of farm-direct sales in the food supply chaim in Hungary], Agrárgazdasági Tanulmányok. Agrárgazdasági Kutató Intézet [Research Institute of Agricultural Economics], Budapest.
Klein, R.W., Spady, R.H., 1993. An efficient semiparametric estimator for binary response models.
Econometrica: Journal of the Econometric Society, 387-421.
Kneafsey, M., Venn, L., Schmutz, U., Balázs, B., Trenchard, L., Eyden-Wood, T., Bos, E., Sutton, G., Blackett, M., 2013. Short Food Supply Chains and Local Food Systems in the EU. A State of Play of their Socio-Economic Characteristics, in: Santini, F., Gomez y Paloma, S. (Eds.), JRC Scientific and Policy Reports. Joint Research Centre Institute for Prospective Technological Studies, European Commission.
Lea, E., Phillips, J., Ward, M., Worsley, A., 2006. Farmers’ and Consumers’ Beliefs About Community-Supported Agriculture in Australia: A Qualitative Study. Ecology of Food and Nutrition 45, 61-86.
14
Lyon, P., Collie, V., Kvarnbrink, E.B., Colquhoun, A., 2009. Shopping at the farmers' market:
consumers and their perspectives. Journal of Foodservice 20, 21-30.
Marascuilo, L.A., McSweeney, M., 1977. Nonparametric and distribution-free methods for the social sciences. Brooks/Cole Publishing Company CA.
Martinez, S., Hand, M., Da Pra, M., Pollack, S., Ralston, K., Smith, T., Vogel, S., Clark, S., Lohr, L., Low, S., Newman, C., 2010. Local Food Systems: Concepts, Impacts, and Issues. ERR. 97. U.S.
Department of Agriculture, Economic Research Service, Washington, D.C.
McCullough, E.B., Pingali, P.L., Stamoulis, K.G., 2008. The transformation of agri-food systems:
globalization, supply chains and smallholder farmers. Food & Agriculture Org.
Meter, K., Rosales, J., 2001. Finding Food in Farm Country. Community Design Center of SE Minnesota.
Parker, G., 2005. Sustainable food? Teikei, Co-operatives and Food Citizenship in Japan and the UK.
Pearson, D., Bailey, A., 2009. Business opportunities in local food supply chains: an investigation in England and Australia, 83rd Annual Conference of Agricultural Economics Society, Dublin.
Réthy, K., Dezsény, Z., 2013. Közösség által támogatott mezőgazdaság [Community Supported Agriculture]. ÖMKI [Hungarian Research Institute of Organic Agriculture], Budapest.
Tregear, A., 2011. Progressing knowledge in alternative and local food networks: Critical reflections and a research agenda. Journal of Rural Studies 27, 419-430.
Trobe, H.L., 2001. Farmers' markets: consuming local rural produce. International Journal of Consumer Studies 25, 181-192.
Vecchio, R., 2010. Local food at Italian farmers' markets: three case studies. International Journal of Sociology of Agriculture and Food 17, 122-139.
Vorley, W., Fearne, A., Ray, D., 2007. Regoverning markets: A place for small scale producers in modern agrifood chains. Gower Publishing, Ltd.
Watts, D.C., Ilbery, B., Maye, D., 2005. Making reconnections in agro-food geography: alternative systems of food provision. Progress in human geography 29, 22-40.