UNDERSTORY FOLIAGE COVER IN AN HUNGARIAN OAK FOREST IN 2012
Tamás Misik1*, Dóra Csontos2 & Sándor Molják2
1Department of Environmental Science and Landscape Ecology, Eszterházy Károly University, Eger, Hungary, 3300 Eger, Leányka str. 6; 2Innoregion Knowledge Centre,
Eszterházy Károly University, Eger, Hungary, 3300 Eger, Leányka str. 6-8;
*E-mail: misik.tamas@uni-eszterhazy.hu
Abstract: The serious oak decline was reported for the 1979–80 period and 63.0% of adult oaks died in a mixed oak forest in the Síkfőkút site, in the north- eastern part of Hungary. The data were used to obtain (1) quantitative information on shrub canopy, including foliage cover percentage of the shrub layer, mean cover of shrub species in 2012; (2) structural information on shrub foliage arrangement and (3) true description from the present ecological condition of the subcanopy layer. In the monitoring plot, the foliage cover condition of specimens only above 8.0 m was observed in 2012. The data relating to the projected foliage areas of high shrubs have been evaluated and foliage map waas digitized in ArcGis. It was measured a very low value of the foliage cover. The shrub layer cover was 61.5%, the duplex- and multiplex was 13.1% and only 76.8% total foliage cover in the understorey. The mean cover of the shrub species changed between 0.5 m2 and 6.4 m2 in the high shrub layer. The maximum mean cover values were recorded by the dominant woody species (Acer campestre, Acer tataricum and Cornus mas) in the shrub community. The GIS analysis confirmed that total foliage cover of the subcanopy layer and of the higher dominant woody individuals was 522.4 m2. Our results suggest that the foliage cover size of shrub layer was a very low in 2012 and was measured similar low mean cover values of shrub species.
Keywords: ArcGis, shrub layer, Acer campestre, mean cover, shrub foliage cover, georeferencing
INTRODUCTION
Numerous studies used different structural variables, biotic and abiotic indicators to long-term detect and monitor the forests health and dynamics (Jukola-Sulonen et al. 1990; Strand 1995;
Wicklum and Davies 1995). Several biotic and abiotic factors have been considered as important in forest health studies, such as
extreme weather conditions, drought, storms, heat (Drobyshev et al. 2008; Bolte et al. 2010), and insect fluctuations (Moraal and Hilszczanski 2000), disease outbreaks (Mistretta 2002) or human induced influences such as climate change, air pollution and fires (Signell et al. 2005; Kabrick et al. 2008). These factors may modify the functioning of the whole forest ecosystem and may lead to tree decline events.
The tree decline has heavily affected oak species and especially Quercus petraea Matt. L. (sessile oak) trees in European countries and naturally in Central Europe (Freer-Smith and Read 1995;
Führer 1998; Thomas and Büttner 1998). An increasing decline of oak forests has been observed in many regions of Hungary since 1978. The oak decline in Slovakia began in 1976, in former Yugoslavia in 1979 and finally reaching the eastern regions of Austria in 1984 (Hämmerli and Stadler 1989). The stand dynamics of oak forests in Europe has been a topic of interest and concern to resource managers and scientists in the last period. Many studies have examined the effects of tree decline on stand (especially on canopy layer) development but relatively few research papers deal with shrub community and shrub layer dynamics in the process of tree decline (Alaback and Herman 1988; Gracia et al. 2007; Gazol and Ibáñez 2009).
Different structural variables can be used as indicators of disturbance regime and management practices in forests (Zumeta and Ellefson 2000; Larsson and Danell 2001). These variables are among others cover. Open areas and tree species diversity had a positive relationship to shrub cover because a diverse overstorey generally created more canopy gaps (Gazol and Ibáñez 2009).
Canopy layer stand structure strongly influences understorey cover by resources, altering microsites and environmental conditions by light availability (Alaback 1982; Oliver and Larsson 1996). Shrub cover is linked to habitat quality and a number of interconnected ecological processes (Carey 1995; Hagar et al. 1996).
The species composition of the canopy layer was stable until 1979 and the healthy density of Q. petraea and of Quercus cerris L.
(Turkey oak) also remained constant in the study site. The massive dieback of oaks started in 1979–80 and 68.4% of Q. petraea trunks died until 2007. The oak decline of the sample site resulted in an opening of the canopy. The overall species composition of the canopy has changed little, only some trees of Tilia cordata Mill. and
Carpinus betulus L. lived as new species in the site. The results of Jakucs (1988) suggested that the soil acidification induced by disappearance of mycorrhiza fungi and the air pollutants that promote water and nutrient absorption have been considered and identified as primary causes of deciduous forest decline.
Most papers only used changes in structural conditions in the tree layer to monitor the ecological process in the forest community after tree decline (Bussotti and Ferretti 1998; Brown and Allen-Diaz 2009). The studies of shrub species performed have mostly focused on the static population structure (age and size structures) (Tappeiner et al. 1991; Stalter et al. 1997). Other studies have focused on the cover and diversity of shrubs (Kerns and Ohmann 2004; Gracia et al. 2007). The decreased oak tree density led to numerous significant structural changes in the understorey such as herbaceous layer and shrub layer. The objectives of this study were to (1) give quantitative information on shrub canopy, including foliage cover percentage of the shrub layer, mean cover of shrub species in 2012; (2) describe structural information on shrub foliage arrangement and finally (3) give description from the present ecological condition of the subcanopy layer.
MATERIAL AND METHODS Study site
The 27 ha reserve research site is located in the Bükk Mountains of northeast Hungary (47°55′ N, 20°46′ E) at a distance of 6 km from the city of Eger and at an altitude of 320–340 m a.s.l. The site was established in 1972 by Jakucs (1985) and has been used for the long-term study of forest ecosystems. The mean annual temperature is 9.9°C and mean annual precipitation typically ranges from 500 to 600 mm. The mean annual temperature and precipitation are based on measurements at the meteorological recording tower of the site. Descriptions of the geographic, climatic, and soil conditions, and vegetation of the forest were reported in detail by Jakucs (1985, 1988). Paper of Koncz et al. (2011) showed the seed bank and herbaceous vegetation condition of the forest.
The most common forest association in this region is sessile oak and Turkey-oak forest community (Quercetum petraeae-cerris) with a dominant canopy of Q. petraea (sessile oak) and Q. cerris
(Turkey oak) deciduous tree species. Both oak species are important dominant native deciduous tree species of the Hungarian natural woodlands. Other codominant tree species in the site included C. betulus, Prunus avium L. and T. cordata. The plots under study were made up of evenly aged temperate deciduous forest trees that were at least 100 years old and had not been thinned for more than 50 years.
Sampling and statistical analysis
The necessary data of shrub layer condition has been collected at a definite period on a 48 m × 48 m monitoring plot. The permanent subplots (4 m × 4 m) were established in 1972. The data were obtained from a 24ha study site at regular intervals within the site.
The investigations were performed during the growing season in 2012.
Canopy trees were classified as sessile oak and Turkey-oak tree species > 13.0 m in height and ≥10.0 cm in diameter at 1.3 meters above ground (dbh). Shoot height and shoot diameter of the shrub individuals were the two main variables recorded. Specimens which were higher than 1.0 m were categorized as high shrub. The lower specimens were categorized as low shrub. Stems < 50.0 cm height of oak species were inventoried and identified to oak seedlings. The term “dominant woody” is used to refer to A.
campestre, A. tataricum and C. mas species that play a key role in an understorey based on the high densities and largest mean sizes for the shrub community.
The following measurements were carried out in each subplot:
was detected foliage cover percentage and mean cover condition of high shrub individuals. In 2012 were sampled 486 high shrub individuals and then subjected to the mean cover analysis of shrub species. Box plot method used for graphically depicting groups of shrub’s foliage cover data through their quartiles. Foliage cover, duplex- and multiplex cover (shrub canopy overlapped other shrub species) of the high shrub layer and total cover of the all high shrub individuals were also recorded. Location and cover of all high shrub specimens were mapped in each subplot. A projected foliage area cartogram of high shrubs was prepared using a method described in several studies (Jakucs 1985; Misik et al. 2007). Since 2012, data relating to the projected foliage areas of high shrubs have been evaluated and foliage map waas digitized in ArcGis. ArcGIS is a
geographic information system (GIS) for working with maps and geographic information in our study site. After the scanning, in the sample site was surveyed 24 pieces hand drawn segments and these segments were georeferencing on the basis of the cardinal gps coordinates to the EOV coordination system. On the basis of the delineated foliage margin on the georeferenced segments we vektorized all living individuals of the shrub species in the monitoring plot. Territorial and circumferential data belonged to the all shrub individuals. The total cover of the understorey was recorded on the basis of the contraction of the all polygon. The foliage cover overlapes of the shrub layer was determined by means of the "Intersect" ArcGIS tool. The distributed georeferring, digitalization and the actions of the geographical information system was making with the ArcMap 10.4 geographical information software. Based on the digitized map we estimated the foliage area of shrub species with the GIS environment.
RESULTS
In 2012, 11 native woody species were identified across the entire study area in the high shrub layer; Acer campestre L. (field maple), Acer tataricum L. (Tatar maple), Cerasus avium L. (wild cherry), Cornus mas L. (European cornel), Cornus sanguinea L. (common dogwood), Crataegus monogyna Jacq. (common hawthorn), Euonymus europaeus L. (common spindle), Euonymus verrucosus Scop. (warted spindle), Ligustrum vulgare L. (common privet), Lonicera xylosteum L. (fly honeysuckle) and Tilia cordata Mill.
(small-leaved linden) were present as high shrub species in the sample site. It was determined the foliage cover sizes of these species.
In 2012 was measured a very low size of the foliage condition.
The shrub layer cover was 61.48%, the duplex- and multiplex cover was 13.11% and was recorded only 76.83% total foliage cover in the understorey. This dataset was the lowest from the starting of the measurements (Table 1).
Table 1. Foliage cover condition in the understorey shrub layer in 2012 and between 1972-2007 period in Síkfőkút.
year foliage cover (%)
duplex and multiplex cover
(%) total cover (%)
2012 61.48 13.11 76.83
1972-2007 77.57 41.47 129.53
mean 69.53 27.29 103.18
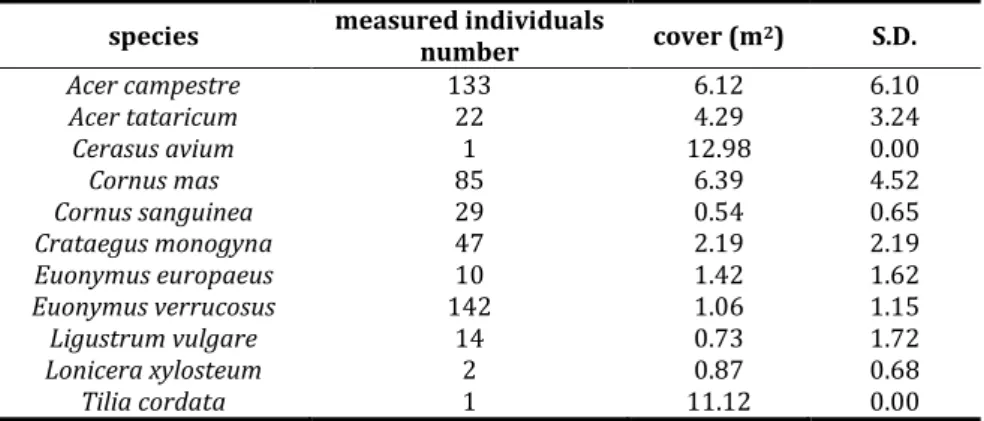
The mean cover of the shrub species individuals changed between 0.54 m2 and 6.39 m2 in the high shrub layer. It was measured 4.29-6.39 m2 mean foliage cover by the dominant woody species of the shrub community. The highest cover values were detected for a single C. avium and single T. cordata tree species with 12.98 m2 and with 11.12 m2 under the oak canopy layer (Table 2).
Table 2. Mean foliage cover (±S.D.) of the species in the understorey shrub layer in 2012.
species measured individuals
number cover (m2) S.D.
Acer campestre 133 6.12 6.10
Acer tataricum 22 4.29 3.24
Cerasus avium 1 12.98 0.00
Cornus mas 85 6.39 4.52
Cornus sanguinea 29 0.54 0.65
Crataegus monogyna 47 2.19 2.19
Euonymus europaeus 10 1.42 1.62
Euonymus verrucosus 142 1.06 1.15
Ligustrum vulgare 14 0.73 1.72
Lonicera xylosteum 2 0.87 0.68
Tilia cordata 1 11.12 0.00
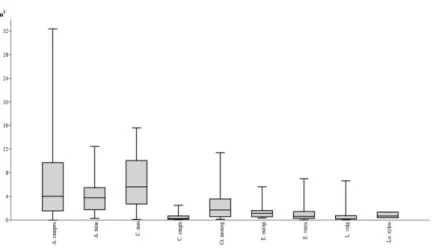
Box plot showed the cover distribution of high shrub species individuals in 2012. The median cover value of C. mas was the maximum; the lowest values were recorded by C. sanguinea, E.
verrucosus and L. vulgare. The maximum standard deviation of cover values were detected by A. campestre individuals. Many field maples reached the tree size; the cover dataset was confirmed this statement (Figure 1).
Figure 1. Statistical summary of cover sizes distribution of high shrub species on the monitoring plot in 2012. Boxes shown are the 25–75% percentile, median, minimum and maximum values (N = 486). (Notation: A. campes. = Acer campestre;
A. tatar. = Acer tataricum; C. mas = Cornus mas; C. sangu. = Cornus sanguinea; Cr.
monog. = Crataegus monogyna; E. europ. = Euonymus europaeus; E. verru. = Euonymus verrucosus; L. vulg. = Ligustrum vulgare; Lo. xylos. = Lonicera xylosteum)
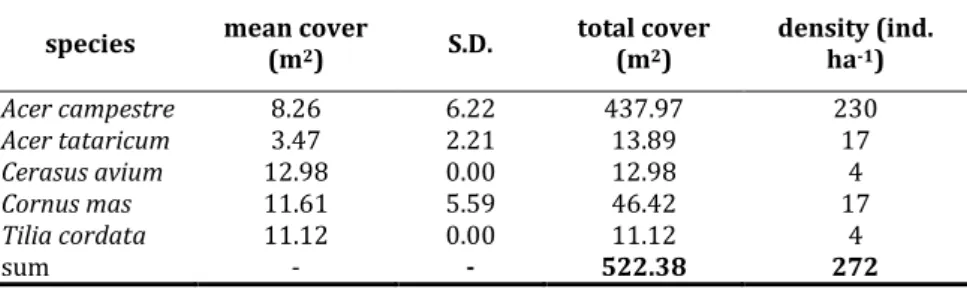
In the subcanopy layer (between 8.0-13.0 m), and above this layer 3 dominant woody species were identified across the entire study area: A. campestre, A. tataricum and C. mas. The field maple was the dominant species with 53 individuals in the subcanopy and tree layer of the study site. The GIS analysis confirmed that total foliage cover of the subcanopy layer and of the higher dominant woody individuals was 522.38 m2. Mean cover of A. campestre individuals was 8.26 m2 in the subcanopy and tree layer; it was measured 3.47 m2 and 11.61 m2 mean foliage cover values by A.
tataricum and C. mas individuals. The C. mas individuals has got the biggest mean foliage cover in the subcanopy layer. Above the 8.0 m height limit, the field maple is the dominant species, because nearly 84.0% percent of the total cover has got own individuals. It was found single C. avium and single T. cordata tree individuals in the subcanopy (Table 3).
Table 3. Mean (±S.D.) and total foliage cover of the woody and tree species individuals in the subcanopy layer in 2012.
species mean cover
(m2) S.D. total cover
(m2) density (ind.
ha-1)
Acer campestre 8.26 6.22 437.97 230
Acer tataricum 3.47 2.21 13.89 17
Cerasus avium 12.98 0.00 12.98 4
Cornus mas 11.61 5.59 46.42 17
Tilia cordata 11.12 0.00 11.12 4
sum - - 522.38 272
DISCUSSION
Nowińska (2010) examined the ecological impact of canopy and canopy gaps on the development of lower forest layers in five protected phytocoenoses of oak-hornbeam habitats (natural and regeneration stands) and oak-pine habitats in the Wielkopolska National Park of Western Poland. Foliage gaps do not affect bryophyte richness and cover. The impact of gaps on the herb layer is not uniform for the investigated forests. Gaps often, though not in all cases, cause a significant increase in the total herb layer cover, vascular antrophophyte cover, vascular species richness and a greater Shannon diversity. In our site In the study of Gracia et al.
(2007) the relationship between shrubs cover and basal area of overstory was only significant for two species, and in both two cases, cover decreased with basal area. Other studies have shown negative correlations of understory cover with canopy trees basal area (Gilliam and Turrill 1993) presumably because of differential light availability.
Tree species influenced shrub, herb and moss cover size (Klinka et al. 1996). Results from Kerns and Ohmann (2004) suggest that forest community structure, stand development, site disturbance history and environment all interact to influence shrub layer cover in Oregon landscape. Shrub cover was negatively correlated with Tsuga heterophylla basal area and density of shade tolerant tree individuals. Total shrub cover increased significantly (P < 0.001) with time since canopy gaps. Furthermore, the increase in total species foliage cover was significantly more pronounced in mature than old-growth stands of Canada (De Grandpré et al. 2011). Total
cover of the understory shrub layer increased slightly, but nonsignificantly in a mature oak forest of USA, from 45.0% in 1950 to 51.0% in 1969 and 1979.
Misik et al. (2013) reported that in the studied oak forest the shrub layer foliage cover increased remarkably from 1972 to 1988;
since 1993 onwards there has not been a clear tendency in the change of the shrub layer cover. No significant differences were revealed between oak tree density and duplex- and multiplex cover in the shrub community (P > 0.05). A. campestre individuals showed a significant mean percent cover increase (P ≤ 0.05) after serious oak decline. Besides than higher foliage cover was recorded by C. mas and A. tataricum species 6.4 and 4.5 m2 mean cover. In our present study the cover size in the understory showed an important decreasing in the last five years. The most important reason of the foliage decrease was the weather condition, because the summer was very hot and extreme dry in 2012 (Sippel and Otto 2014).
CONCLUSIONS
In 2012 was measured a very low size of the foliage condition. The shrub layer’s cover size dataset was the lowest from the starting of the measurements, from 1972. The mean cover of the shrub species individuals changed between 0.54 m2 and 6.39 m2 in the high shrub layer. The dominant woody species of the shrub community have got the maximum mean foliage cover with 4.29-6.39 m2 values. The median cover value of C. mas was the maximum; the lowest values were recorded by C. sanguinea, E. verrucosus and L. vulgare species individuals. The maximum standard deviation of cover values were detected by A. campestre individuals and many field maples reached the tree size. The GIS analysis confirmed that total foliage cover of the subcanopy layer and of the higher dominant woody individuals was 522.38 m2. The cover dataset in the shrub community was a very low in 2012 and showed considerably decreasing compared with the last three decades cover values.
REFERENCES
ALABACK,P.B. (1982).Dynamics of understory biomass in Sitka spruce–western hemlock forests of southeast Alaska. Ecology63:1932–1948.
ALABACK,P.B.&HERMAN,F.R.(1988).Long-term response of understory vegetation to stand density in Picea-Tsuga forests. Canadian Journal of Forest Research 18:
1522–1530.
BOLTE,A.,HILBRIG,L.,GRUNDMANN,B.,KAMPF,F.,BRUNET,J.&ROLOFF,A. (2010). Climate change impacts on stand structure and competitive interactions in a southern Swedish spruce–beech forest. European Journal of Forest Research 129:
261−276.
BROWN,L.B.&ALLEN-DIAZ,B. (2009). Forest stand dynamics and sudden oak death:
Mortality in mixed-evergreen forests dominated by coast live oak. Forest Ecology and Management 257: 1271–1280.
BUSSOTTI,F.&FERRETTI,M. (1998). Air pollution, forest condition and forest decline in Southern Europe: an overview. Environmental Pollution 101: 49–65.
CAREY,A.B. (1995). Sciurids in Pacific Northwest managed and old-growth forests.
Ecological Applications 5: 648–661.
DROBYSHEV,I.,NIKLASSON,M., EGGERTSSON,O.,LINDERSON,H.& SONESSON,K. (2008).
Influence of annual weather on growth of pedunculate oak in southern Sweden. Annals of Forest Science 65: 512−512.
FREER-SMITH,P.H.&READ,D.B. (1995). The relationship between crown condition and soil solution chemistry in oak and Sitka spruce in England and Wales.
Forest Ecology and Management 79: 185–196.
FÜHRER,E. (1998). Oak decline in Central Europe: a synopsis of hypotheses. In:
MCMANUS, M.L. & LIEBHOLD, A.M. (eds.): Population Dynamics, Impacts, and Integrated Management of Forest Defoliating Insects. Banská Štiavnica, 18.-23.
August 1996. Radnor, USDA Forest Service, pp. 7–24.
GAZOL,A. & IBÁÑEZ,R. (2009). Different response to environmental factors and spatial variables of two attributes (cover and diversity) of the understorey layers. Forest Ecology and Management 258: 1267–1274.
GILLIAM,F.S.&TURRILL,N.L. (1993). Herbaceous layer cover and biomass in a young versus a mature stand of a central Appalachian hardwood forest. Bulletin of the Torrey Botanical Club 120: 445−450.
GRACIA, M., MONTANÉ, F., PIQUÉ, J. & RETANA, J. (2007). Overstory structure and topographic gradients determining diversity and abundance of understory shrub species in temperate forests in central Pyrenees (NE Spain). Forest Ecology and Management 242: 391−397.
HAGAR, J.C., MCCOMB, W.C. & EMMINGHAM, W.H. (1996). Bird communities in commercially thinned and unthinned Douglas-fir stands of western Oregon.
Wildlife Society Bulletin 24: 353–366.
HÄMMERLI,F.&STADLER,B. (1989). Eichenschäden - Eine Übersicht zur Situation in Europa und in der Schweiz. Schweizerische Zeitschrift für Forstwesen 140: 357–
374.
JAKUCS,P. (ed.) (1985). Ecology of an oak forest in Hungary. Results of „Síkfőkút Project” I. Akadémia Kiadó, Budapest.
JAKUCS,P. (1988). Ecological approach to forest decline in Hungary. Ambio 17: 267–
274.
JUKOLA-SULONEN,E.L.,MIKKOLA,K.&SALEMAA,M. (1990). The vitality of conifers in Finland, 1986–88. In: KAUPPI,P. (ed.): Acidification in Finland. Berlin, Springer- Verlag, pp. 523–560.
KABRICK, J.M., DEY, D.C., JENSEN, R.G. & WALLENDORF, M. (2008). The role of environmental factors in oak decline and mortality in the Ozark Highlands.
Forest Ecology and Management 255: 1409–1417.
KERNS,B.K.& OHMANN,J.L. (2004). Evaluation and prediction of shrub cover in coastal Oregon forests (USA). Ecological Indicators 4: 83−98.
KLINKA,K.,CHEN,H.Y.H.,WANG,Q.L.& DE MONTIGNY,L.(1996). Forest canopies and their influence on understory vegetation in early-seral stands on west Vancouver Island. Northwest Science 70: 193−200.
KONCZ,G.,TÖRÖK,P.,PAPP,M.,MATUS,G.& TÓTHMÉRÉSZ,B. (2011). Penetration of weeds into the understory and seed bank of an oak forest in Hungary.
Community Ecology 12: 227−233.
LARSSON,S.& DANELL, K. (2001). Science and the management of boreal forest biodiversity. Scandinavian Journal of Forest Research 3: 5−9.
MISIK, T., VARGA, K., VERES, ZS., KÁRÁSZ, I. & TÓTHMÉRÉSZ, B. (2013). Long-term response of understorey cover, basal area and diversity to stand density in a mixed oak forest on the Síkfőkút plot in Hungary. Journal of Forest Science 59:
319–327.
MISTRETTA,P.A. (2002). Southern forest resource assessment highlights: managing for forest health. Journal of Forestry 100: 24–27.
MORAAL,L.G.&HILSZCZANSKI,J. (2000). The oak buprestid beetle, Agrilus biguttatus (F.) (Col., Buprestidae), a recent factor in oak decline in Europe. Journal of Pest Science 73: 134–138.
NOWIŃSKA,R. (2010). Reactions of the herb and moss layer, tree saplings and the shrub layer to tree deaths in forests of the Wielkopolska National Park (Western Poland). Biologia 65: 265–272.
OLIVER,C.D.&LARSON,B.C. (1996). Forest Stand Dynamics. Wiley, New York, 520 pp.
SIPPEL, S. & OTTO, F.E.L. (2014). Beyond climatological extremes - assessing how the odds of hydrometeorological extreme events in South-East Europe change in a warming climate. Climatic Change 125: 381–398.
STALTER,A.M.,KRASNY,M.E.& FAHEY,T.J. (1997). Sprouting and layering of Acer pensylvanicum L. in hardwood forests of central New York. Journal of the Torrey Botanical Society 124: 246–253.
STRAND, G.H. (1995). Estimation of the difference in crown vigour for 2280 coniferous trees in Norway from 1989 to 1994, adjusted for the effects of ageing. Environmental Monitoring and Assessment 36: 61–74.
TAPPEINER,J.C.,ZASADA,J.,RYAN,P.&NEWTON,M. (1991). Salmonberry clonal and population structure: the basis for a persistent cover. Ecology 72: 609–618.
THOMAS,F.M.& BÜTTNER, G. (1998). Nutrient relations in healthy and damaged stands of mature oaks on clayey soils: two case studies in northwestern Germany. Forest Ecology and Management 108: 301–319.
WICKLUM, D.& DAVIES, R.W. (1995). Ecosystem health and integrity? Canadian Journal of Botany 73: 997–1000.
ZUMETA,D.C.&ELLEFSON,P.V. (2000). Conserving the biological diversity of forests:
program and organizational experiences of state governments in the United States. Environmental Management 26: 393−402.
(submitted: 19.09.2017, accepted: 27.11.2017)