Tari-Keresztes Noemi, Piko Bettina, Gupta Himanshu, Decelis Andrew, Dely-Palinkas Aniko, Fejes Zsuzsanna. Prototype perception of physically active peers: result from a study among Hungarian university students. Pedagogy and Psychology of Sport. 2021;07(01):41-60. elSSN 2450-6605. DOIhttp://dx.doi.org/10.12775/PPS.2021.07.01.002
https://apcz.umk.pl/czasopisma/index.php/PPS/article/view/PPS.2021.07.01.002 https://zenodo.org/record/4497277
The journal has had 5 points in Ministry of Science and Higher Education parametric evaluation. § 8. 2) and § 12. 1. 2) 22.02.2019.
© The Authors 2021;
This article is published with open access at Licensee Open Journal Systems of Nicolaus Copernicus University in Torun, Poland
Open Access. This article is distributed under the terms of the Creative Commons Attribution Noncommercial License which permits any noncommercial use, distribution, and reproduction in any medium, provided the original author (s) and source are credited. This is an open access article licensed under the terms of the Creative Commons
Attribution Non commercial license Share alike. (http://creativecommons.org/licenses/by-nc-sa/4.0/) which permits unrestricted, non commercial use, distribution and reproduction in any medium, provided the work is properly cited.
The authors declare that there is no conflict of interests regarding the publication of this paper.
Received: 20.01.2021. Revised: 20.01.2021. Accepted: 03.02.2021.
PROTOTYPE PERCEPTION OF PHYSICALLY ACTIVE PEERS:
RESULT FROM A STUDY AMONG HUNGARIAN UNIVERSITY STUDENTS
Name Noemi Tari-Keresztes
Affiliation University of Szeged, Department of Behavioral Sciences, Szeged
Wellbeing and Preventable Chronic Diseases Division, Menzies School of Health Research, Charles Darwin University, Darwin, Australia
Country Hungary
Bio Statement —
Principal contact for editorial correspondence.
Name Bettina Piko
Affiliation University of Szeged, Department of Behavioral Sciences, Szeged
Country Hungary
Bio Statement —
Name Himanshu Gupta
Affiliation Wellbeing and Preventable Chronic Diseases Division, Menzies School of Health Research, Charles Darwin University, Darwin
Country Australia
Bio Statement —
Name Andrew Decelis
Affiliation Institute for Physical Education & Sport, University of Malta, Msida
Country Malta
Bio Statement —
Name Aniko Dely-Palinkas
Affiliation Doctoral School of Health Sciences, Faculty of Health Sciences, University of Pecs, Pecs
Country Hungary
Bio Statement —
Name Zsuzsanna Fejes
Affiliation University of Szeged, Faculty of Medicine, Department of Radiology, Szeged
Country Hungary
Bio Statement —
Abstract
Introduction: Previous studies argued the role of social prototypes in making desicisions on healthy and unhealthy behaviors. Positive images associated with a certain behavior might increase the possibility of developing the behavior. While most of the studies focused on health risk behaviors, health promoting behaviors have been less investigated yet. However, young adults are more conscious about the social images associated with health behaviors compared with their younger equivalents; much of the relevant research has been conducted with the latter groups. Purpose: The main aim of this study was to (1) examine how university students perceive their physically active peers, (2) map the adjectives associated with the ‘physically active peers’ prototypes, (3) identify respondents’ categories based on their prototype perception, and (4) detect relationships between social images, sociodemographic variables, sporting habits and social attitudes. Material and Method: Cross-sectional, self-report data were obtained from a convenience sample of 515 respondents aged 18-31 years via a survey with students from a Hungarian university. Result: Cluster analyses detected three independent clusters: “Negative” image”
group, “Positive appearance” group, “Positive appearance and personality” group. Age, gender, self- assessed SES, sporting friends, social support, social network, Internet use, competitiveness and the need to belonging seemed to make a difference along these groups of social images. Conclusion: Our findings suggested that social variables may play a moderate role in university students’ sport-related prototype formation.
Key words: university students; prototypes; physical activity; social attitude
Introduction: Social images play a crucial role in making decisions on healthy behaviors (Werch, 2007). If an adolescent thinks drinking is “sociable” and “cool”
(Haddock & Zanna, 1994) or smoking is “cool” and “popular” (Piko, Bak, & Gibbons, 2007), they are more possibly build positive attitudes toward substance use and probably participate in substance use at a later point. Likewise, if one thinks of healthy eating makes them “self-confident” (Gerrits et al., 2009) or of physical activity as
“healthy” and “ motivating”(Rivis & Sheeran, 2003), it may increase the likelihood of healthy eating or regular physical activity. Therefore, including positive social images may have serious practical implications for health promotion programs. While earlier studies have focused on exploring the relationship between social image and substance use (Piko et al., 2007), little evidence is available on the correlation between social
image and physical activity (Keresztes, Piko, Gibbons, & Spielberger, 2009; Ouellette, Hessling, Gibbons, Reis-Bergan, & Gerrard, 2005).
Prototypes are social images indicating the perception of a typical person engaging in or refraining from certain health-related behaviors such as typical drinker/non-drinker, smoker/non-smoker, exerciser/non-exerciser, and healthy/unhealthy eater (Gibbons &
Gerrard 1995). These images usually develop as early as age 7, before the behavior is begun (Andrews & Peterson 2006). However, social images may change over time, for example, young adults may be more conscious about these social images than when they are younger (Arnett, 2000). This elevated consciousness may lead to a higher motivation to change these images and may motivate to accept messages of positive social images.
Previous studies have emphasized prototypes as antecedents of behaviorFal decision making among young adults . For example, the Prototype/Willingness Model (PWM) developed by Gibbons & Gerrard describes how prototype may guide young adults’
behavior (Gibbons & Gerrard 1997). PWM is a dual-process model that includes both a reasoned pathway determined by intention and a social-reactive pathway determined by the willingness to engage in the behavior (Gibbons, Gerrard, & Lane, 2003). PWM shows that favorable prototypes of people who take part in different health behaviors are associated with the willingness to engage in those behaviors when the opportunity surfaces (Gibbons & Gerrard 1995). In the original model, prototypes explain behavior only through willingness; however, later studies that had applied PWM, recognized that prototypes also explain intentions (Zimmermann & Sieverding, 2010) and behavior (Rivis & Sheeran, 2003). Thus, prototypes associate with behavior via their impact on willingness and intentions (Andrews et al., 2008).
To understand prototypes, studies focused on a list of pre-determined adjectives that described certain images such as typical smoker (Piko et al., 2007), typical drinker (van Lettow, Vermunt, de Vries, Burdorf, & van Empelen, 2013), typical un/healthy eater (Gerrits et al., 2009) and typical physically active youth (Keresztes et al., 2009).
Furthermore, they also attempted to identify adjective clusters to get a clearer picture of these images (van Lettow et al., 2013). This is because these images often reflect heterogeneity (for example, positive prototypes do not necessarily include only positive items or negative prototypes only negative items). Therefore, altering prototypes by interventions requires an understanding of the relevant items used to describe such images (Gerrard et al., 2006).
In addition to examining the content of a prototype, it is also important to reveal factors linked to these prototypes. This is because as prototypes regularly describe images within a social context, they may impact behavior through certain social attitudes, such as social comparison orientation or competitiveness, and other aspects of social processes (Gerrard et al., 2002).
The social comparison implies the action of evaluating one’s own ability and opinion by comparing them with the abilities and opinions of others. It involves comparing the self to others or to the image of others (Gibbons & Gerrard 1997). Thus, social comparison is often implemented in a system aimed at promoting increased physical activity levels. Evidence shows that people would become more physically active to perform better than others (Zucherman & Gal-Oz, 2014). A recent study showed that people with high levels of social comparison orientation tended to increase their
exercising behavior (Ouellette et al., 2005). In addition, social comparison tendencies might support the development of positive personality-related prototypes about physically active peers (Keresztes et al., 2009).
Another social attitude, competitiveness, a form of comparison with others, is a strong motivational force that can affect behavior in numerous contexts such as physical activity (Sambolec, Kerr, & Messé, 2007). Previous studies have showed that physically active individuals had higher win emphasis and competitiveness than their non-active peers (McQuillan & Biggs, 2007) and that physical activity was associated with an increased likelihood of developing a positive personality-related prototype regarding physically active peers (Keresztes et al., 2009).
The need to belong is another critical factor that influences prototypes and thus behavior. The need to belong is considered a fundamental motivation for humans (Hornsey & Jetten, 2004) “to form and maintain strong, stable interpersonal relationships” (Baumeister & Leary, 1995, p. 497). According to the “classic”
psychological theories, the need to belong has two main features: 1) the need to establish interpersonal contacts and 2) the need for those connections to be stable, emotionally involved and likely to carry on (Fromm, 1955). A number of studies on sport also support the role of belongingness in facilitating positive emotionality among exercisers, sport team members and also among fans (Adie, Duda, & Ntoumanis, 2012;
Theodokaris, Wann, Nassis, & Luellen, 2012). For instance, Adie et al found
a positive association between belongingness with vitality among young recreational sport performers (Adie et al., 2012).
Social network and social support also affect prototypes and behavior (Lindstrom, Moghaddassi, & Merlo, 2004), that is, behaviors are socially patterned (Berkman, Glass, Brissette, & Seeman, 2000). For instance, studies that have looked at the impact of social support on physical activity, found that social support was positively associated with increased physical activity among young adults (Allen, Markovitz, Jacobs Jr., &
Knox, 2001) and older women (Bidonde, Goodwin, & Drinkwater, 2009). A systematic review concluded that higher level of social support, particularly the number of sporting friends, was significantly related to higher level of physical activity (Wendel-Vos, Droomers, Kremers, Brug, & van Lenthe, 2007). Social network of friends and neighbors also contributed to higher frequency of leisure time physical activity (Yu et al., 2011).
Finally, in our modern world where computers have entered almost every part of our life, we should not neglect the role of social media and Internet use within social processes. Conflicting views have been identified in this context: 1) heavy computer usage effects the psychological and social well-being negatively and excessive users are described with larger body mass index (BMI) and lower physical inactivity (Berkey et al., 2000) and 2) regular computer use correlates with more active socio-behavioral lifestyle, such as high physical activity levels, higher involvement with recreational and social activities, and higher perceived social support than the non-regular computer users (Ho & Lee, 2001).
Aim of the work: Studies on prototype perception of health promoting behaviors are scant. Few attempts have been made to analyze some components of their social correlates. These appear to address these elements separately, while detecting the
impact of a set of social correlates on the physically active peers’ prototype is lacking.
Thus, the aims of this study were to:
1) examine how university students perceive their physically active peers. To map these perceptions and adjectives associated with the ‘physical active peer’ prototypes, university students were categorized by using different prototype adjectives.
2) investigate how participants’ prototype perception categories may differ along some other variables like a) socio-demographics; b) Internet use habits; c) social attitudes;
and d) sporting habits.
Material and Methods: Cross-sectional, self-report data were obtained from a convenience sample of 515 respondents aged 18 –31 years (Mage=21.8, S.D.+2.26 years) via a paper and pencil survey, between October 2013 and March 2014. The sample consisted of full-time Hungarian (81%) and international students (19%) enrolled at the University of Szeged, Hungary, 51% of the sample were males. 650 questionnaires were sent out yielding a 79% response rate.
Convenience sampling approach was assisted by trained university students and lecturers who distributed the questionnaires during their lectures or seminars. Students completed the surveys in a classroom setting under the supervision of their lecturer and trained university students. A Participant Information sheet (PIS) was provided to the students prior to completing the surveys and their consent was obtained. The PIS contained information on the purpose of the survey, the anonymity of their identity and responses, and their voluntary participation in the study. The survey took about 35-40 minutes to complete. Completed surveys were collected in sealed envelopes to maintain confidentiality. The study was approved by the University Institutional Review Board.
The survey comprised items on sociodemographic characteristics, physical activity and social influences (such as social attitudes, social support and network), prototypes about physically active peers and the use of the social media. The language of the survey was Hungarian; however, it was translated into English for international students. The translation was done by the research team members (NK, BFP) and the English version was back-translated to Hungarian to check for language errors and comprehension.
Initially, descriptive analyses were conducted to explore overall patterns in the survey data. The key demographic variables (e.g., age, sex, nationality and SES) plus variables on physical activity are reported in Table 1, the key independent variables (namely: social support scale, network scale, need to belong scale, social comparison scale and competitiveness scale) are reported in Table 2 and the prototype variables are presented in Table 3-5. SPSS 20.0 program was used for the analyses.
The next stage of the analysis involved conducting a K-mean cluster analysis to categorize (make clusters) of students based on their opinion about physically active peers. To determine the optimal number of clusters (based on the agglomeration schedule and dendrogram) and to check for outliners, hierarchical cluster analysis was applied. Then, we used K-means cluster analysis for the categorization of the students since our sample size was appropriate to this method (Kassambara, 2017).
To identify differences between these clusters by socio-demographic characteristic, physical activity behavior, internet use and social attitudes, chi-square test and ANOVA were applied.
The following question was asked about physical activity: “How many times in the last 3 months did you engage in physical activity besides school Physical Education (for at
least a half hour)?” Response categories were never (1), once or twice (2), two or three times a month (3), once or twice a week (4), and three or more times per week (5). This variable was recoded into (1) low and (2) high activity group (Keresztes, Piko, Pluhar,
& Page, 2008) by using a dichotomized variable (1=once or less than once a week;
2=minimum twice or more times a week).
Besides activity level, questions on other aspects of physical activity were also asked, particularly those having a social relevance. First, organization of physical activity (1=
within school, 2=sport club, 3=with friends, 4=alone) was asked (Keresztes, Pluhár, &
Pikó, 2003). Then we were also interested in the physical activity behavior of the students’ social network. The number of regularly active friends was measured by the following response categories:(1) none of them; (2) some of them; (3) half of them; (4) most of them; (5) all of them (Page, Ihasz, Simonek, Klarova, & Hantiu, 2007). Finally, we asked the students with whom they engage in physical activity (1=with friends, 2=classmates, 3=alone, 4=others) (Keresztes, 2015).
Participants were asked to evaluate their physically active peers. The instructions of the prototypes assessment (Gibbons & Gerrard 1995) read: ”When trying to describe someone, people usually use characteristics of that person. For example, if you describe someone of your age who always gets good marks, you might say that this person is smart, bright and “bookworm”. We would like you to think about the image that you have of a physically active /inactive peer of your age for a moment. We are interested in your opinion about the typical physically active /inactive peer of the same age as you.
The typical physically active peer is: ….”.
Participants were then asked to describe the typical physically active peer by using 14 bipolar items reflecting personal characteristics and attributes of the target (namely, irresponsible/responsible, active/lazy, sloppy/meticulous, undisciplined/disciplined, insecure/self-confident, focused on future/focused on present, wise/foolish, not sporty/sporty, chubby/slim, dissatisfied/satisfied, unkempt/ well-groomed, thinks the body is important/thinks the body is not important, attractive/unattractive and unpopular/ popular). Answers were provided on a seven-point scale. The adjectives used were derived from a study of young people’s other preventive health behavior (eater) prototypes (Gerrits et al., 2009).
For the purpose of the analyses we created a “Positive Physically Active Prototype”
scale, adding the 14 items together using the positive end of the bipolar scale. Prototype scale showed a good reliability (Cronbach’s alpha= 0.87) in our present sample similarly to a previous healthy and unhealthy prototype study (Cronbach’s alpha= 0.89 and 0.88) (Gerrits et al, 2009).
The survey instrument included items on the Internet-using habits (Egger &
Rauterberg, 1996; Ivanova, 2013). Weekly hours on different Internet use were measured with an open-ended question: “How many hours do you spend on the following Internet services (namely: surfing/browsing; email, discussion groups/forums;
chat/social networks; multiplayer games, other services)?”. For the purpose of the analyses we created a variable called Internet activity where we added all hours spent on different Internet services. In addition, Internet-using variables were recoded into low, moderate and high categories where low 15% of the frequency went into the low category, top 15% into the high and all the others to moderate category. Multiplayer
games and other Internet services were deleted from the analyses since their frequency was very low.
The Need to Belong Scale was developed to measure “the desire for acceptance and belonging for use in an experiment investigating reactions to potential acceptance and rejection.” (Leary, Kelly, Cottrell, & Schreindorfer, 2013). The scale contained 10 items (e.g., “I try hard not to do things that will make other people avoid or reject me”), including 4 reversed statements (e.g., “If other people don't seem to accept me, I don't let it bother me”) with the same response categories. Answers were coded from 1 to 5 (5 to 1 for reversed items). Based on our data the Cronbach’s alpha was 0.5.
The social comparison tendencies were measured by the Hungarian version of the Iowa Netherlands Comparison Orientation Measure (INCOM) (Gibbons & Buunk, 1999;
Piko, Luszczynska , Gibbons , & Teközel, 2005). The scale included 11 items pertaining to how an individual compares himself or herself with others (e.g., “I always pay a lot of attention to how I do things compared with how others do things”). The scores ranged from 11 to 55 using a 5-point response scale. It was translated from English into Hungarian and back-translated by bilingual translators. The reliability coefficient was 0.66.
Competitiveness was measured by the revised Competitiveness Index (Houston, Harris, McIntire, & Francis, 2002). The index contains 14 items designed to assess the desire to win in interpersonal situations (e.g., “I am a competitive individual,” “I often try to outperform others”). The Likert-type responses include a 5-point scale format ranging from 1 (strongly disagree) to 5 (strongly agree). The scale was translated from English into Hungarian and back-translated by bilingual translators. The scale was reliable, with a Cronbach’s alpha value of 0.52 with the current sample.
Social network and social support were measured with the frequency of contacts within the respondents’ networks of relatives, friends, and neighbors and the quality of such contacts measured through opportunities for care, financial support and information the individuals could receive in difficult times. The questions were drawn from the Office of National Statistics (ONS) Social Capital Question Bank. They were designed to identify the size of the individuals’ networks and the quality of interactions, as a stress-buffering mechanism (Yu et al., 2011). Regarding social network, the questions were: “How often you personally meet up with relatives/friends”; “How often you personally speak to relatives/friends on the phone”; “How often do you personally write to relatives/friends” and “How often do you personally speak to neighbors”.
Response categories were: (1) never; (2) less than once a month; (3) once or twice a month; (4) once a week or more and (5) most days. The responses to social network were constructed into an additive scale as a continuous overall index ranging. The reliability coefficient was 0.57.
To measure social support, the following questions were asked: “How many people could you ask for help to go shopping if you are unwell”; “How many people could you ask for help to lend you money to see you through the next few days?”; “How many people could you ask for help to give you advice and support in a crisis?” The response categories of social support were categorised into ’none’, ’one or two’ and ’more than two’ (Yu et al., 2011). For the purpose of the study, similarly to social network, we also created a continuous scale from the responses adding the three response categories together. The Cronbach’s alpha value was 0.78.
Results: Of 515 respondents who completed the survey, 262 (51%) were male, 417 (81%) were Hungarian, 98 (19%) were international students, and 324 (63%) reported being middle class. The age range of respondents was between 18 and 31 years (mean age 21.8 years and SD 2.26 years). The survey response rate was 79%.
About 65% of respondents belonged to the highly active group and 56% took part in some form of physical activity with their friends. Increased levels of attendance were reported for setting-based physical activity (e.g. sport clubs: 43%) and friends’ activity level was low (e.g. only 33.8% of them reported that most of them or all of them are regularly active). 66% of the respondents’ friends were characterized by low, occasional activity level. Moderate level of Internet activity was reported by the majority of respondents (86%) with moderate frequency of Internet use on different Internet activities (ranging between 60% and 70% on each activity). According to the social attitudes and social support/network scales, we computed the following descriptive statistics: social support scale (mean: 7.78; SD= 1.32); network scale (mean: 23.26;
SD=4.25); need to belong scale (mean: 33.32; SD= 6.15); social comparison scale (mean: 36.86; SD= 7.31); competitiveness scale (mean: 46.26; SD= 10.60).
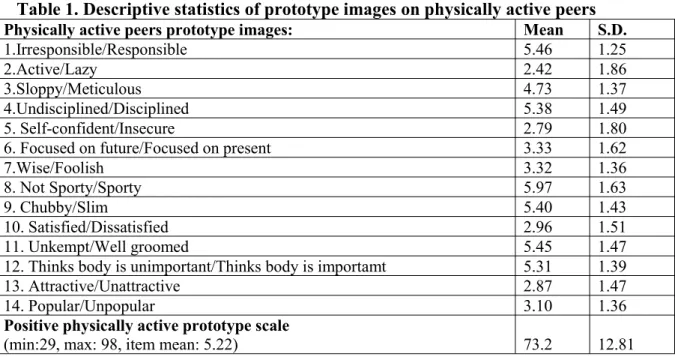
For the prototype image items on physically active peers and positive physically active prototype scale, we found that respondents had homogeneous and well-defined positive views about physically active peers, excluding the following adjectives:
sloppy/meticulous image where participants’ ratings were around the center of the scale.
The mean of the positive physically active prototype scale was 73.2 (S.D. = 12.81) and the item mean was 5.22, showing a positive attitude toward this scale (see Table 1).
Table 1. Descriptive statistics of prototype images on physically active peers
Physically active peers prototype images: Mean S.D.
1.Irresponsible/Responsible 5.46 1.25
2.Active/Lazy 2.42 1.86
3.Sloppy/Meticulous 4.73 1.37
4.Undisciplined/Disciplined 5.38 1.49
5. Self-confident/Insecure 2.79 1.80
6. Focused on future/Focused on present 3.33 1.62
7.Wise/Foolish 3.32 1.36
8. Not Sporty/Sporty 5.97 1.63
9. Chubby/Slim 5.40 1.43
10. Satisfied/Dissatisfied 2.96 1.51
11. Unkempt/Well groomed 5.45 1.47
12. Thinks body is unimportant/Thinks body is importamt 5.31 1.39
13. Attractive/Unattractive 2.87 1.47
14. Popular/Unpopular 3.10 1.36
Positive physically active prototype scale
(min:29, max: 98, item mean: 5.22) 73.2 12.81
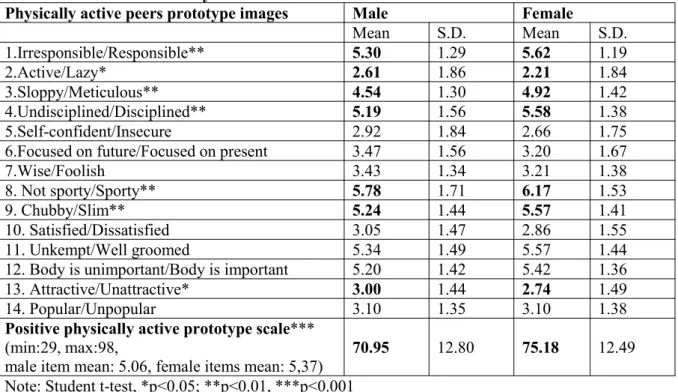
Comparing male and female university students’ perceptions of physically active peers using student t-test, some differences were found. Female respondents’ ratings of physically active peers were significantly higher than males. Regarding the composite positive physically active prototype scale, female respondents (mean: 75.18; S.D.=12.49)
had more positive overall images than their male counterparts (mean: 70.95; S.D.=
12.80) (see Table 2).
Table 2. Descriptive statistics of prototype images on physically active peers among male and female university students
Physically active peers prototype images Male Female
Mean S.D. Mean S.D.
1.Irresponsible/Responsible** 5.30 1.29 5.62 1.19
2.Active/Lazy* 2.61 1.86 2.21 1.84
3.Sloppy/Meticulous** 4.54 1.30 4.92 1.42
4.Undisciplined/Disciplined** 5.19 1.56 5.58 1.38
5.Self-confident/Insecure 2.92 1.84 2.66 1.75
6.Focused on future/Focused on present 3.47 1.56 3.20 1.67
7.Wise/Foolish 3.43 1.34 3.21 1.38
8. Not sporty/Sporty** 5.78 1.71 6.17 1.53
9. Chubby/Slim** 5.24 1.44 5.57 1.41
10. Satisfied/Dissatisfied 3.05 1.47 2.86 1.55
11. Unkempt/Well groomed 5.34 1.49 5.57 1.44
12. Body is unimportant/Body is important 5.20 1.42 5.42 1.36
13. Attractive/Unattractive* 3.00 1.44 2.74 1.49
14. Popular/Unpopular 3.10 1.35 3.10 1.38
Positive physically active prototype scale***
(min:29, max:98,
male item mean: 5.06, female items mean: 5,37) 70.95 12.80 75.18 12.49 Note: Student t-test, *p<0.05; **p<0.01, ***p<0.001
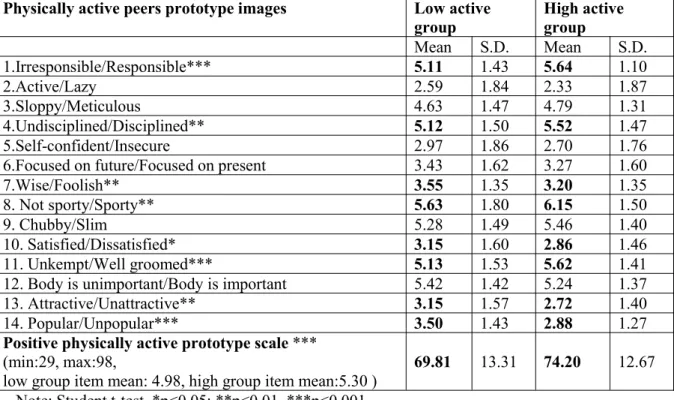
Low-and- high activity groups of respondents were also compared. Findings showed that least active and highly active respondents also had different perceptions of their physically active peers. Highly active students had a more positive physically active prototype and thus had more positive overall images than those in the least active group (mean: 74.20; S.D.=12.67 vs. mean: 69.81; S.D.=13.31) (see Table 3).
Table 3. Descriptive statistics of prototype images on physically active peers in the light of activity level
Physically active peers prototype images Low active
group High active
group
Mean S.D. Mean S.D.
1.Irresponsible/Responsible*** 5.11 1.43 5.64 1.10
2.Active/Lazy 2.59 1.84 2.33 1.87
3.Sloppy/Meticulous 4.63 1.47 4.79 1.31
4.Undisciplined/Disciplined** 5.12 1.50 5.52 1.47
5.Self-confident/Insecure 2.97 1.86 2.70 1.76
6.Focused on future/Focused on present 3.43 1.62 3.27 1.60
7.Wise/Foolish** 3.55 1.35 3.20 1.35
8. Not sporty/Sporty** 5.63 1.80 6.15 1.50
9. Chubby/Slim 5.28 1.49 5.46 1.40
10. Satisfied/Dissatisfied* 3.15 1.60 2.86 1.46
11. Unkempt/Well groomed*** 5.13 1.53 5.62 1.41
12. Body is unimportant/Body is important 5.42 1.42 5.24 1.37
13. Attractive/Unattractive** 3.15 1.57 2.72 1.40
14. Popular/Unpopular*** 3.50 1.43 2.88 1.27
Positive physically active prototype scale***
(min:29, max:98,
low group item mean: 4.98, high group item mean:5.30 ) 69.81 13.31 74.20 12.67 Note: Student t-test, *p<0.05; **p<0.01, ***p<0.001
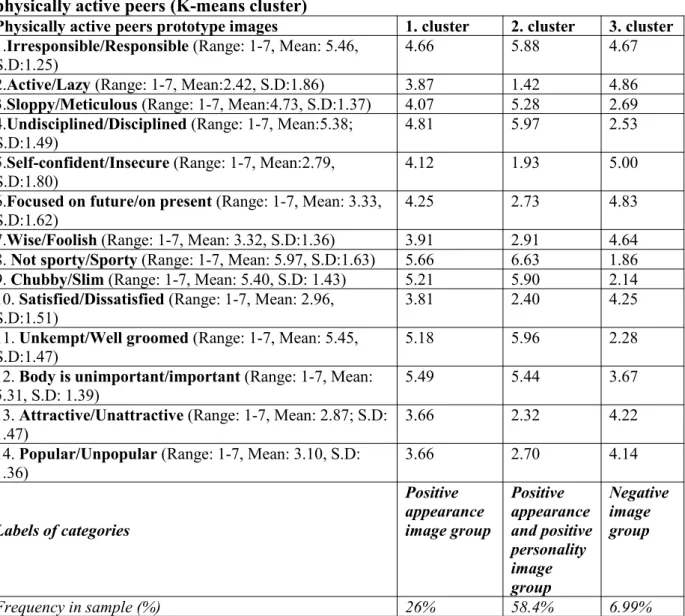
Table 4 summarizes the result of the K-means cluster analysis. Three independent clusters were identified, with these clusters covering 86% of the total sample. About 58% of respondents belonged in the “Positive appearance and personality” image group.
They had positive extrinsic (appearance, outlook, etc.) and intrinsic (personality) perceptions of physically active peers, the perceptions included sporty, slim, well- groomed and self-confident, satisfied, and focused on future. Twenty-six percent of them were in the “Positive appearance” image group. These students also had positive perception, but only about the physically active peers’ appearance. Finally, a very small proportion of respondents (7%) had a negative image of their physically active peers, namely: undisciplined, sloppy, unkempt and insecure, focused on the present, and foolish.
Table 4. Categorization of university students based on their opinion about physically active peers (K-means cluster)
Physically active peers prototype images 1. cluster 2. cluster 3. cluster 1.Irresponsible/Responsible(Range: 1-7, Mean: 5.46,
S.D:1.25) 4.66 5.88 4.67
2.Active/Lazy(Range: 1-7, Mean:2.42, S.D:1.86) 3.87 1.42 4.86 3.Sloppy/Meticulous(Range: 1-7, Mean:4.73, S.D:1.37) 4.07 5.28 2.69 4.Undisciplined/Disciplined(Range: 1-7, Mean:5.38;
S.D:1.49) 4.81 5.97 2.53
5.Self-confident/Insecure(Range: 1-7, Mean:2.79,
S.D:1.80) 4.12 1.93 5.00
6.Focused on future/on present(Range: 1-7, Mean: 3.33,
S.D:1.62) 4.25 2.73 4.83
7.Wise/Foolish(Range: 1-7, Mean: 3.32, S.D:1.36) 3.91 2.91 4.64 8.Not sporty/Sporty(Range: 1-7, Mean: 5.97, S.D:1.63) 5.66 6.63 1.86 9.Chubby/Slim(Range: 1-7, Mean: 5.40, S.D: 1.43) 5.21 5.90 2.14 10.Satisfied/Dissatisfied(Range: 1-7, Mean: 2.96,
S.D:1.51) 3.81 2.40 4.25
11.Unkempt/Well groomed(Range: 1-7, Mean: 5.45,
S.D:1.47) 5.18 5.96 2.28
12.Body is unimportant/important(Range: 1-7, Mean:
5.31, S.D: 1.39) 5.49 5.44 3.67
13.Attractive/Unattractive(Range: 1-7, Mean: 2.87; S.D:
1.47) 3.66 2.32 4.22
14.Popular/Unpopular(Range: 1-7, Mean: 3.10, S.D:
1.36) 3.66 2.70 4.14
Labels of categories
Positive appearance image group
Positive appearance and positive personality image group
Negative image group
Frequency in sample (%) 26% 58.4% 6.99%
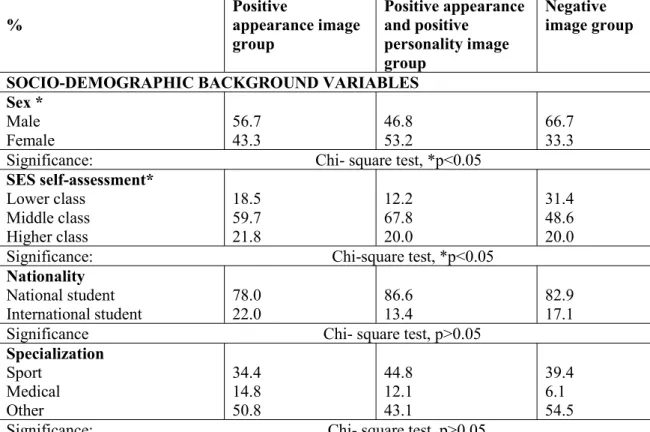
Subsequently, we searched for differences between these clusters by socio- demographic characteristics. Using Chi-square tests, we found significant differences by gender and self-assessed SES. More male students were in the categories of the
“Negative” image group (67% vs. 33%) as well as “Positive appearance” group (57% vs.
43%), while females were more likely to be in the “Positive appearance and personality” group (53% vs. 47%) (all p<0.05). In all three clusters, the middle class had the highest frequency, ranging between 49-68% (p<0.05). However, in the
“Negative image” group, 31% of the respondents were from the low SES. Nationality and specialization at the university did not have any significant relationship with clusters (see Table 5).
Table 5. Categories of university students’ opinion about physically active peers by socio-demographic background
% Positive
appearance image group
Positive appearance and positive
personality image group
Negative image group SOCIO-DEMOGRAPHIC BACKGROUND VARIABLES
Sex *
MaleFemale 56.7
43.3 46.8
53.2 66.7
Significance: Chi- square test, *p<0.05 33.3 SES self-assessment*
Lower class Middle class Higher class
18.559.7 21.8
12.267.8 20.0
31.448.6 Significance: Chi-square test, *p<0.05 20.0
Nationality National student
International student 78.0
22.0 86.6
13.4 82.9
Significance Chi- square test, p>0.05 17.1 Specialization
Sport Medical Other
34.414.8 50.8
44.812.1 43.1
39.46.1 Significance: Chi- square test, p>0.05 54.5
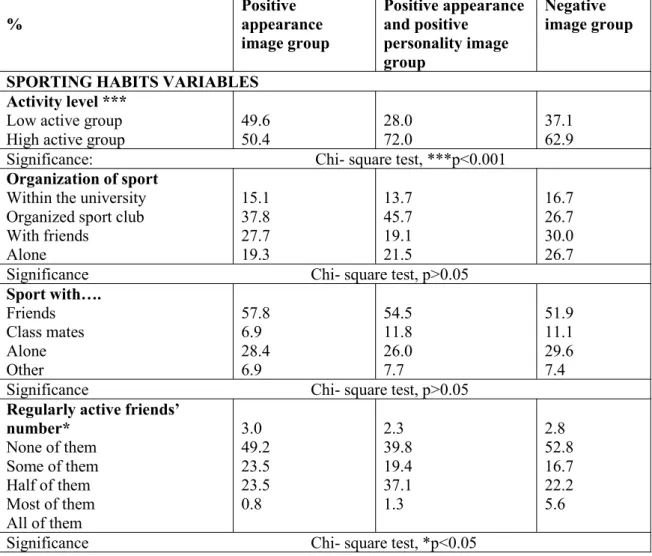
The activity level and the number of regularly active friends were significantly associated with clusters. Specifically, highly active respondents appeared more frequently in the “Positive appearance” and the “Positive appearance and personality”
group. However, 63% of the “Negative” image group were highly active students as well. The chi-square test also showed that respondents with inactive friends were more likely to be in the “Negative” image group, whereas students with regularly active friends were in the “Positive appearance” and “Positive appearance and personality”
groups (all p<0.001) (see Table 6).
Table 6. Categories of university students’ opinion about physically active peers by their sporting habits
% Positive
appearance image group
Positive appearance and positive
personality image group
Negative image group SPORTING HABITS VARIABLES
Activity level ***
Low active group
High active group 49.6
50.4 28.0
72.0 37.1
Significance: Chi- square test, ***p<0.001 62.9 Organization of sport
Within the university Organized sport club With friends
Alone
15.137.8 27.719.3
13.745.7 19.121.5
16.726.7 30.026.7
Significance Chi- square test, p>0.05
Sport with….
Friends Class mates Alone Other
57.86.9 28.46.9
54.511.8 26.07.7
51.911.1 29.67.4
Significance Chi- square test, p>0.05
Regularly active friends’
number*
None of them Some of them Half of them Most of them All of them
3.049.2 23.523.5 0.8
2.339.8 19.437.1 1.3
2.852.8 16.722.2 5.6
Significance Chi- square test, *p<0.05
The chi-square test also showed that the prototype perception categories were significantly associated with the frequency of surfing/browsing and the total internet activity. Most of the students were in the moderate group, but respondents from the high surfing/browsing and internet activity were more likely to have negative images of a typical physically active peer (all p<0.01) (see Table 7).
Table 7. Categories of university students’ opinion about physically active peers by their internet-using behavior
% Positive
appearance image group
Positive
appearance and positive
personality image group
Negative image group
INTERNET-USING VARIABLES Frequency of visiting forums/discussion groups
LowModerate High
19.464.2 16.4
15.966.6 17.6
22.263.9 13.9
Significance Chi- square test, p>0.05
Frequency of chatting/social networking LowModerate
High
20.966.4 12.7
13.674.4 12.0
11.172.2
Significance Chi- square test, p>0.05 16.7
Frequency of browsing and surfing*
LowModerate High
13.469.4 17.2
13.375.1 11.6
16.752.8
Significance Chi- square test, *p<0.0130.6
Frequency of email checking LowModerate
High
19.461.9 18.7
17.969.1 13.0
16.758.3
Significance Chi- square test, p>0.05 25.0
Internet activity **
LowModerate High
9.080.6 10.4
6.687.0 6.3
5.672.2
Significance Chi- square test, **p<0.0122.2
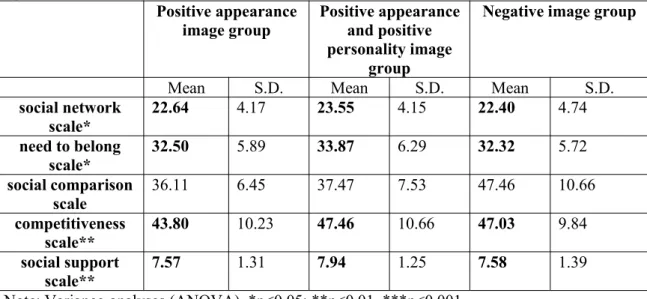
Finally, Table 8 shows that comparing the means with ANOVA, the “Positive appearance and personality image” group had the highest mean scores on the social network scale (p<0.05), the need to belong scale (p<0.05), as well as on the competitiveness scale and the social support scale (both p<0.01) (see Table 8).
Table 8. Categories of university students’ opinion about a physically active peers by social attitudes scales
Positive appearance
image group Positive appearance and positive personality image
group
Negative image group
Mean S.D. Mean S.D. Mean S.D.
social network
scale* 22.64 4.17 23.55 4.15 22.40 4.74
need to belong
scale* 32.50 5.89 33.87 6.29 32.32 5.72
social comparison
scale 36.11 6.45 37.47 7.53 47.46 10.66
competitiveness
scale** 43.80 10.23 47.46 10.66 47.03 9.84
social support
scale** 7.57 1.31 7.94 1.25 7.58 1.39
Note: Variance-analyses (ANOVA), *p<0.05; **p<0.01, ***p<0.001 Discussion
Previous research suggests that social images play an important role in people’s behavioral decisions (Werch, 2007). While the majority of these studies have focused on health risk behaviors such as smoking or alcohol use (Todd & Mulan, 2011), health promoting behaviors, such as physical activity, has been under-investigated (Keresztes et al., 2009). The limited work suggests that a positive social image toward physical activity such as “healthy and motivated” may increase the likelihood of a regular active lifestyle (Rivis & Sheeran, 2003). Hence, it would be important to get more detailed information on these social images, since they may have important practical implications for health promotion programs, especially among youth.
Since these images develop at a very early age, several previous studies focused on children and adolescents (Andrews & Peterson 2006). However, young adults could also be an important target population as they are more conscious about these social images than their younger counterparts (Arnett, 2000). Our findings also identified that young adults possess very well defined positive and quite homogeneous images, as found among high school students in other studies (Keresztes et al., 2009).
Despite of the homogeneity, we found some important significant differences within the images of physically active peers varying by respondents’ socio-demographic characteristics. While results among high school students indicated that exercise prototypes did not vary by gender (Keresztes et al, 2009), in the present study, female respondents’ ratings of physically active peers were significantly more positive concerning images about appearance and personality in addition to an overall positive picture than their male counterparts. Similar to a previous study (Keresztes et al., 2009), prototypes were also influenced by the respondents’ physical activity status (whether they belong to lower or higher activity groups), in our study. Not surprisingly, respondents in the high activity group had more positive prototypes of physically active peers, including both extrinsic and intrinsic characteristics as positive and desirable
attributes of physical activity behavior might serve as a drive, a motivational goal for them (Keresztes et al., 2009).
To understand the prototypes, previous studies used a list of pre-determined adjectives that described certain images such as ”typical smoker”, ”typical drinker”, ”typical un/healthy eater” as well as ”typical physically active youth (Gerrits et al., 2009; Keresztes et al., 2009; Piko et al., 2007; van Lettow et al., 2013).
Since the content of an image and the image composer adjectives have been addressed less, we created clusters based on the respondents’ prototype perceptions, to identify specific subgroups of young adults based on their social images of a physically active peer.
Using K-means cluster analyses similarly to van Lettow et al’s (2013) study, three independent clusters were created: “Negative” image group, “Positive appearance”
group and “Positive appearance and personality group”. More male students belonged to the “Negative” image group as well as “Positive appearance” group, while females were more likely to be in the “Positive appearance and personality group”. These results suggest that females and males develop their social images toward physical activity during the young adult stage in a different way. Further studies are required to identify how these images develop along these ages, and how they influence physical activity behavior. The SES self-assessment did not show any significant differences along the clusters. However, in the “Negative image group”, 31% of respondents were from lower classes. This suggests that positive social images may reflect a “general middle class”
image while lower classes may have more negative prototypes. Hence, the relationship between SES and social images about physical activity and physically active peers needs further exploration to understand how SES might affect physical activity level through social images. Youth from lower SES might be less active due to the lack of resources and access to sport programs (Drenowatz et al., 2010; Piko & Keresztes, 2008) that are likely to be associated with their perception of negative images about physical activity and physically active peers.
Similarly, the majority of respondents in the high activity group and those with physically active friends fell into both “Positive appearance” and the “Positive appearance and personality group”. However, about 63% of the “Negative” image group were highly active students as well. This suggests that engaging in higher activity levels can elevate more positive intrinsic and extrinsic social images toward physical activity (Keresztes et al., 2009).
Social media is likely to have an important role in social image formation in both negative and positive ways (Berkey et al., 2000; Gordon-Larsen, McMurray, & Popkin, 1999; Ho & Lee, 2001; Kraut et al., 1998). Our study found that heavy computer users were more likely to develop negative images toward physically active peers’ prototypes.
In contrast, we also found that regular but moderate Internet exposure can help to develop positive images.
Finally, we also investigated potential differences between clusters according to social attitudes such as, social support and network, social comparison, and belongingness and competitiveness. Except for social comparison, all other social attitudes were significantly associated with “Positive appearance and personality” image.
These results also suggest that prototypes may develop within a social context (Gerrard et al., 2002) and this needs to be considered when designing health promotion programs.
Summary and conclusion:To summarize, this study shows that: 1) university students fundamentally have positive images toward physical activity; 2) although they have a well-defined homogeneous image, there exist some differences varying by their socio- demographic background, sporting and Internet using habits, and 3) based on their opinion about physically active peers, they can be categorized into three independent image groups (cluster)
While a cross-sectional study design, the method of data collection and small sample can be the limitations to this study; the inclusion of young adult population, the use of cluster analyses and the inclusion of a wide range of social correlates are the strengths of this study. Our findings indicate that specialized health promotion programs targeting both genders, active and inactive students as well as students from lower class might be more effective. In addition, our results also indicate that mindful and self-conscious computer use, and socially supportive environment can be key factors in developing positive image toward physical activity. Our future analyses might focus on the similarity and favorability of the prototype as an important antecedent of behavioral decision making.
References
Adie J.W., Duda J.L., & Ntoumanis N. (2012). Perceived coach-autonomy support, basic need satisfaction and the well-and ill-being of elite youth soccer players: A longitudinal investigation. Psychology of Sport and Exercise, 13/1, pp.51–59.
doi.org/10.1016/j.psychsport.2011.07.008
Allen J., Markovitz J., Jr Jacobs D.R., & Knox S.S. (2001). Social Support and Health Behavior in Hostile Black and White Men and Women in CARDIA.
Psychosomatic Medicine, 63/4, pp.609–618. doi: 10.1097/00006842- 200107000-00014. PMID: 11485115.
Andrews J.A., Hampson S.E., Barckley M., Gerrard M., Gibbons F.X. (2008). The effect of early cognitions of cigarette and alcohol use during adolescence.
Psychology of Addictive Behaviors, 22/1, pp.96-106. doi.org/10.1037/0893- 164X.22.1.96
Andrews J.A., & Peterson M. (2006). The development of social images of substance users in children: A Guttman unidimensional scaling approach. Journal of Substance Use, 11/5, pp.305–321. doi: 10.1080/14659890500419774. PMID:
18604283; PMCID: PMC2443056.
Arnett J.J. (2000). Emerging adulthood. A theory of development from the late teens through the twenties. American Psychologist, 55/5, pp. 469–480.
doi.org/10.1037/0003-066X.55.5.469
Baumeister R.F., & Leary M.R. (1995). The need to belong: Desire for interpersonal attachments as a fundamental human motivation. Psychological Bulletin, 117/3, pp. 497–529. doi.org/10.1037/0033-2909.117.3.497
Berkey C.S., Rockett H.R., Field A.E., Gillman M.W., Frazier A.L., Jr Camargo C.A.,
& Colditz G.A. (2000). Activity, dietary intake, and weight changes in a longitudinal study of preadolescent and adolescent boys and girls. Pediatrics, 105/4, pp.E56.
Berkman L.F., Glass T., Brissette I., & Seeman T.E. (2000). From social integration to health: Durkheim in the new millennium. Social Sciences Medicine, 51/6, pp.843–857. doi: 10.1016/s0277-9536(00)00065-4.
Bidonde M.J., Goodwin D.L., & Drinkwater D.T. (2009). Older Women’s experiences of a fitness program. The importance of a social networks. Journal of Applied Sport Psychology, 21(Suppl.1), pp.S86-S101. doi:10.1080/10413200802595963 Drenowatz C., Eisenmann J.C., Pfeiffer K.A., Welk G., Heelan K., Gentile D. & co-
workers.(2010). Influence of socio-economic status on habitual physical activity and sedentary behavior in 8- to 11-year old children. BMC Public Health, 10, pp.214. Retrieved from https://www.ncbi.nlm.nih.gov/pubmed/20423487.
doi:10.1186/1471-2458-10-214 doi.org/10.1186/1471-2458-10-214
Egger O., & Rauterberg M. (1996). Internet behavior and addiction. Zurich: Swiss Federal Institute of Technology.
Fromm E. (1955). The Sane Society. New York Holt, Rinehart, & Winston.
Gerrard M., Gibbons F.X., Brody G.H., Murry V.M., Cleveland M.J., & Wills T.A.
(2006). A theory-based dual-focus alcohol intervention for preadolescents: The strong African American families program. Psychology of Addictive Behaviors, 20/2, pp.185–195. doi.org/10.1037/0893-164X.20.2.185
Gerrard M., Gibbons F.X., Reis -Bergan M., Trudeau L., Van de Lune L.S., & Buunk B.
(2002). Social comparison as a moderator of the prototype–behavioral willingness relation. Unpublished manuscript.
Gerrits J.H., O’Hara R.O., Piko B.F., Gibbons F.X., de Ridder D.T.D., Keresztes, N., &
co-workers. (2009). Self control, diet concerns and eater prototypes influence fatty foods consumption of adolescents in three countries. Health Education Research, 25/6, pp.1031-1041. doi: 10.1093/her/cyq055. Epub 2010 Sep 22.
Gibbons F.X., & Buunk B.P. (1999). Individual differences in social comparison:
Development of a scale of social comparison orientation. Journal of Personality and Social Psychology, 76/1, pp.129–142. doi.org/10.1037/0022-3514.76.1.129 Gibbons F.X., & Gerrard M. (1995). Predicting young adults’ health-risk behavior.
Journal of Personality and Social Psychology, 69/3, pp.505–517. doi:
10.1037//0022-3514.69.3.505.
Gibbons F. X., & Gerrard M. (1997). Health images and their effects on health behavior.
In B. P. Buunk & F. X. Gibbons (Eds.), Health, coping, and well-being (pp. 63–
94). Mahwah, NJ: Erlbaum.
Gibbons F.X., Gerrard M., & Lane D.J. (2003). A social reaction model of adolescence health risk. In J. Suls & K. Wallson (Eds.), Social psychological foundations of health and illness (pp. 107-136). Oxford: Blackwell.
Gordon-Larsen P., McMurray R.G., & Popkin B.M. (1999). Adolescent physical activity and inactivity vary by ethnicity: The National Longitudinal Study of Adolescent Health. The Journal of Pediatrics, 135/3, pp.301-306. doi:
10.1016/s0022-3476(99)70124-1.
Haddock G., & Zanna M.P. (1994). Preferring ‘housewives’ to ‘feminists’:
Categorization and the favorability of attitudes toward women. Psychologyof Women Quarterly, 18/1, pp.25–52. doi.org/10.1111/j.1471-6402.1994.tb00295.x Ho S.M.Y., & Lee T.M.C. (2001). Computer Usage and Its Relationship
WithAdolescent Lifestyle in Hong Kong. Journal of Adolescent Health, 29/4, pp.258-266. doi: 10.1016/s1054-139x(01)00261-0.
Hornsey M.J., & Jetten J. (2004). The individual within the group: balancing the need to belong with the need to be different. Personality and Social Psychology Review 8/3, pp.248–264. doi: 10.1207/s15327957pspr0803_2.
Houston J.M., Harris P.B., McIntire S., & Francis D. (2002). Revising the Competitiveness Index. Psychological Reports, 90/1, pp. 31–34. doi:
10.2466/pr0.2002.90.1.31.
Ivanova E. (2013). Internet as a social instrument: Relationship with personality traits and well-being of adolescence. Paper presented at the ISSBD Regional Workshop,, Budapest, Hungary.
Keresztes N. (2015). Social images about physically inactive peers. Létünk, 1, pp.147- Keresztes N., Piko B., Pluhar Z., & Page R. M. (2008). Brief report: Social influences in160.
leisure time sport activity among early adolescents. The Journal of Royal Society for Promotion of Health, 128/1, pp.21-25.
Keresztes N., Piko B.F., Gibbons F.X., & Spielberger C.D. (2009). Do high and low active adolescents have different prototype of physically active peers? The Psychological Report, 59, pp.39-52. doi.org/10.1007/BF03395648
Keresztes N., Pluhár Z., & Pikó B. (2003). A fizikai aktivitás gyakorisága és sportolási szokások általános iskolások körében (In Hungarian). Magyar Sporttudományi Szemle, 4, pp.43-47.
Kraut R., Patterson M., Lundmark V., Kiesler S., Mukopadhyay T., & Scherlis W.
(1998). Internet paradox. A social technology that reduces social involvement and psychological well-being? American Psychologist, 53/9, pp.1017-1031.
doi.org/10.1037/0003-066X.53.9.1017
Leary M.R., Kelly K.M., Cottrell C.A., & Schreindorfer L.S. (2013). Construct validity of the need to belong scale: mapping the nomological network. Journal of Personality Assessment, 95/6, pp.610–624. doi:10.1080/00223891.2013.819511 Lindstrom M., Moghaddassi M., & Merlo J. (2004). Individual self-reported health,
social participation and neighbourhood: A multilevel analysis in Malmo, Sweden. Preventive Medicine, 39/1, pp.135–141. doi:
10.1016/j.ypmed.2004.01.011.
McQuillan D.F., & Biggs A. (2007). Getting Riled Up: Prototypes, Aggression and Competitiveness Levels as Differentiated amongst Athletes and Position.
Retrieved from:
https://www.mckendree.edu/academics/scholars/issue8/mcquillan.htm
Ouellette J.A., Hessling R., Gibbons F.X., Reis-Bergan M., & Gerrard M. (2005). Using images to increase exercise behavior: Prototypes versus possible selves.
Personality and Social Psychology Bulletin, 31/5, 610-620.
doi.org/10.1177/0146167204271589
Page R.M., Ihasz F., Simonek J., Klarova R., & Hantiu I. (2007). Friendship and physical activity: Investigating the connection in Central- Eastern European adolescents. International Journal of Adolescent Medicine and Health, 19/2, pp.187-198. doi.org/10.1515/IJAMH.2007.19.2.187
Piko B.F., Bak J., & Gibbons F.X. (2007). Prototype perceptions and smoking. Are negative or positive social images more important in adolescence? Addictive Behaviors, 32/8, pp.1728-1732. doi.org/10.1016/j.addbeh.2006.12.003
Piko B.F., & Keresztes N. (2008). Sociodemographic and socioeconomic variations in leisure time physical activity in a sample of Hungarian youth. International Journal of Public Health, 53/6, pp.306-310. Retrieved from https://www.ncbi.nlm.nih.gov/pubmed/19112593. doi:10.1007/s00038-008- 7119-9
Piko B. F., Luszczynska A., Gibbons F.X., & Teközel M. (2005). A culture-based study of personal and social influences of adolescent smoking. European Journal of Public Health, 15/4, pp.393–398. doi: 10.1093/eurpub/cki008. Epub 2005 Jul 4.
Rivis A., & Sheeran P. (2003). Social influences and the theory of planned behavior:
Evidence for direct relationship between prototypes and young people’s exercise behavior. Psychology and Health, 18/5, pp.567-583. doi: : 10.1080/0887044032000069883
Sambolec E.J., Kerr N.L., & Messé L.A. (2007). The Role of Competitiveness at Social Tasks: Can Indirect Cues Enhance Performance? Journal of Applied Sport Psychology, 19/2, pp.160-172. doi.org/10.1080/10413200601185164
Theodokaris N.D., Wann D., Nassis P., & Luellen T.B. (2012). The relationship between sport team identification and the need to belong. International. Journal of Sport Management and Marketing, 12/1-2, pp.25-38. doi:
10.1504/IJSMM.2012.051249
Todd J., & Mulan B. ( 2011). Using the theory of planned behavior and prototype willingness model to target binge drinking in female undergraduate university students. Addictive Behavior, 36, pp.980-986. doi:
10.1016/j.addbeh.2011.05.010
van Lettow B., Vermunt J.K., de Vries H., Burdorf A., & van Empelen P. (2013).
Clustering of drinker prototype characteristics: What characterizes the typical drinker? The British Journal of Psychology, 104/3, pp.382-399.
/doi.org/10.1111/bjop.12000
Wendel-Vos W., Droomers M., Kremers S., Brug J., & van Lenthe F. (2007). Potential environmental determinants of physical activity in adults: A systematic review.
Obesity Reviews, 8/5, pp. 425–440. doi: 10.1111/j.1467-789X.2007.00370.x.
Werch C.C. (2007). The Behavior-Image Model: a paradigm for integrating prevention and health promotion in brief interventions. Health Education Research, 22/5, pp.677-690. doi.org/10.1093/her/cyl146
Yu G., Renton A., Schmidt E., Tobi P., Bertotti M., Watts P., & co-workers. (2011). A multilevel analysis of the association between social networks and support on leisure time physical activity: Evidence from 40 disadvantaged areas in London.
Health and Place, 17/5, pp.1023-1029.
Zimmermann F., & Sieverding M. (2010). Young adults’ social drinking as explained by an augmented theory of planned behaviour: The roles of prototypes, willingness, and gender. British Journal of Health Psychology, 15/3, pp.561–581.
doi: 10.1348/135910709X476558. Epub 2009 Oct 24.
Zucherman O., & Gal-Oz A. (2014). Deconstructing gamification: evaluating the effectiveness of continuous measurement, virtual rewards, and social comparison for promoting physical activity. Personal and Ubiquitous Computing, 18, pp.1705-1719. doi.org/10.1007/s00779-014-0783-2