COMMISSIONS G1 AND G4 OF THE IAU INFORMATION BULLETIN ON VARIABLE STARS
Volume 63 Number 6249 DOI: 10.22444/IBVS.6249
Konkoly Observatory Budapest
27 July 2018
HU ISSN 0374 – 0676
PERIODIC Hα EMISSION IN THE ECLIPSING BINARY VV CEPHEI
POLLMANN, E.1; BENNETT, P. D.2; VOLLMANN, W.3; SOMOGYI, P.4
1Emil-Nolde-Straße 12, 51375 Leverkusen, Germany
2Dept. of Physics and Atmospheric Science, Dalhousie University, Halifax, NS, Canada
3Damm¨ackergasse 28/D1/20, A-1210, Wien, Austria
4Zr´ınyi u. 23, 2890 Tata, Hungary
Abstract
We present a high-cadence time series of spectroscopic observations of the Hαemission line profile obtained during the egress and total eclipse phases of the M supergiant binary VV Cephei (M2 Iab + B0-2 V) for the 2017-2018 eclipse. Medium-resolution spectroscopy, obtained at an almost nightly cadence by the ARAS Spectroscopy Group from April 2017 through June 2018, has been used to construct a time-series of equivalent widths (EWs) of the Hαemission line flux. The peak fluxes of the blue (V) component and the red (R) component relative to the continuum, as well as their ratio, V/R, have also been found. We report on a new 43.5-day periodic variation in the Hαemission that is present throughout the entire time series and, in particular, persists through mid-eclipse.
1 Introduction
VV Cephei (= HR 8383 = HD 208816; M2 Iab + B0-2? V) is the brightest, M supergiant eclipsing variable binary in the sky. At 5th magnitude, it is an easily accessible spec- troscopic target for amateur astronomers. As is typical for red supergiants, the M star’s apparent brightness is somewhat variable, V = 4.9−5.4 mag, with a dominant period of about 150 days. The VV Cep binary system consists of a red supergiant with mass about 20 solar masses and a hot, presumably main sequence, early B-type companion of com- parable mass (Wright 1977). The red supergiant primary eclipses the much smaller (in radius) B-type secondary star every 20.34 years. The system is now (July 2018) midway through its 1.5-year long total eclipse that began in late October 2017. Total eclipse (2nd contact) began on JD 2458054 (2017 Oct 28) and mid-eclipse occurred on JD 2458288 (2018 June 19), based on the eclipse times of Leedj¨arv et al. (1999) for the 1997/98 eclipse and the 7430.5 d (20.34 yr) period of Wright (1977). The relative orbit of VV Cep is shown to scale in Fig. 1.
The optical spectrum of VV Cephei in the red spectral region is that of an M supergiant, but with strong Hα line emission from an accretion region around the hot companion (Wright 1977). This emission is probably due to accretion from the massive wind of the M supergiant, and not from mass transfer via Roche-lobe overflow. The large orbital eccentricity (e = 0.346; Wright 1977) and large mean orbital separation of a/R1 ≈ 5.1 (Bennett, private communication), where R1 is the radius of the M supergiant, argue against the close binary nature required for Roche-lobe overflow to occur.
2 IBVS6249
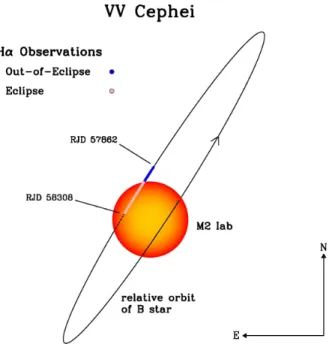
Figure 1. The relative orbit of VV Cephei to scale, as projected on the sky. The relative position of the hot B-type companion is shown by small blue circles out-of eclipse, and pink circles in total eclipse
for the duration of the current data set.
The Hαemission line (Fig. 2) is prominent, with typical peak fluxes several times that of the M star continuum, and broad with a full width of±300 km s−1 out of eclipse. The only place in the system with velocities this large is deep in the gravitational potential of the B star and so the broad wings of Hα must be formed by rapidly infalling gas in the immediate vicinity of the B star. But, rather surprisingly for an emission region associated with the hot star, the Hαemission weakens and narrows in width, but does not completely vanish during total eclipse. This implies the existence of a spatially-extended region of Hα emission that remains uneclipsed must contribute significantly to the overall emission. Because of these difficulties, it remains unclear exactly where the Hα emission line is formed in VV Cep relative to the B star and the associated accretion region.
In structure, the Hαemission line appears doubled with two prominent peaks separated by self-absorption near line center (Fig. 2). Wright (1977) assumed that this profile was due to a single, intrinsic symmetric emission profile with superimposed absorption from low-velocity neutral hydrogen along the line of sight through the wind of the M supergiant.
He found that the emission centroid followed the velocity of the B star around its orbit, moving back and forth in velocity with respect to the nearly fixed central absorption. By estimating the position of the (missing) intrinsic emission peak, and assuming it shared the radial velocity of the B star, Wright (1977) was able to derive an orbit solution for the companion. Therefore, with the orbit of the M supergiant primary already established, he was able to derive masses of about 20 solar masses for both stars of this eclipsing binary system.
However, Wright also noted that a difference of 1.7 km s−1 was found between the systemic velocities of the M star and B star orbital solutions, possibly an indication that the velocity of the Hα emission centroid is somewhat displaced from that of the hot star.
One of the goals of the present observational campaign is to clarify the geometry of the Hα emission region by obtaining and analysing high-cadence spectroscopic observations
IBVS6249 3
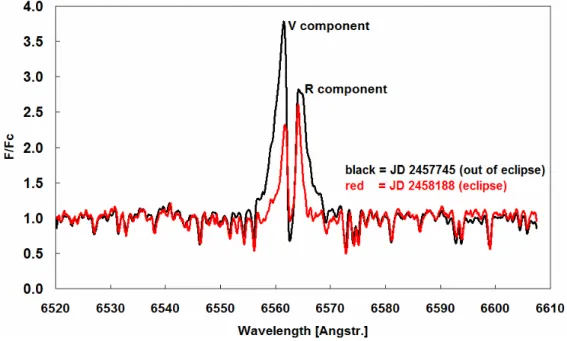
Figure 2. Medium-resolution spectrum of the Hαemission line in VV Cep; black: out-of-eclipse = 2016-12-23; red: total eclipse = 2018-03-10.
of VV Cep during the 2017-2018 eclipse period. It is hoped that this effort will lead to an improved orbit and masses for VV Cep, which is one of the most massive and luminous evolved binaries in the sky.
2 Observations
The work of the ARAS group (Pollmann, 2018) reported here consists of a long-term spectroscopic monitoring program of the Hα emission line of VV Cephei. Spectroscopic observations have been obtained on a regular basis of the red spectral region around Hα, on a regular basis with high-cadence (approximately nightly) monitoring from April 2017 (JD 2457850) through to July 2018 (JD 2458310). These medium-resolution Hα spectra (R=λ/∆λ∼15000) offer the opportunity to study the dynamics of the hot stars and its associated H II region, responsible for the Balmer lines (and continuum) recombination spectrum, with unprecedented time resolution.
For this observing campaign, for each spectrum, equivalent widths (EWs) of the en- tire Hα emission profile have been calculated, and peak fluxes of the blue (V) and red (R) emission components have been measured relative to the continuum. The V and R components are defined with reference to the central absorption that splits the Hα emis- sion line profile into two (Fig. 2). The precise definition of continuum value used for the calculation of the EW is shown in Fig. 3, and details of the definition of the V and R components are given in Fig. 4.
One issue to be aware of when measuring Hα emission fluxes in VV Cep is that this emission originates from a source (near the B star companion) that is spatially distinct from that of the M supergiant’s continuum. EWs are normally calculated with respect to the stellar continuum, but for VV Cep that continuum is itself somewhat variable and so
4 IBVS6249
Figure 3. The continuum value used for the HαEW calculation was the mean flux level between the Fe I 6546 ˚A and Ti I 6556 ˚A spectral lines indicated. The spectrum shown is of VV Cep on 2017 May
27 (JD 57900.45).
Figure 4. Definition of the V and R components.
IBVS6249 5
the variability of the M supergiant introduces an apparent variation in the Hα emission flux inferred from the EW.
To obtain the intrinsic variation of the Hα component, the effect of the continuum variability should be removed. This can be done for EW observations by multiplying the raw EWs by a factor of 10−0.4∆V0, where ∆V0 =V −V0, and V is the V-band magnitude at the time of the observation, andV0 is the long-term mean V magnitude. However, the data presented here have not been corrected in this manner.
Furthermore, neither of the V and R peak fluxes (which were measured relative to the M star continuum) have been corrected for M star variability, and so these values should be interpreted with caution. In places, the slow 150-day variability of the M supergiant can be seen in these fluxes. However, the effect of the variable continuum cancels out in the calculation of the blue-to-red ratio, V/R, and so that is the key diagnostic used in the present analysis.
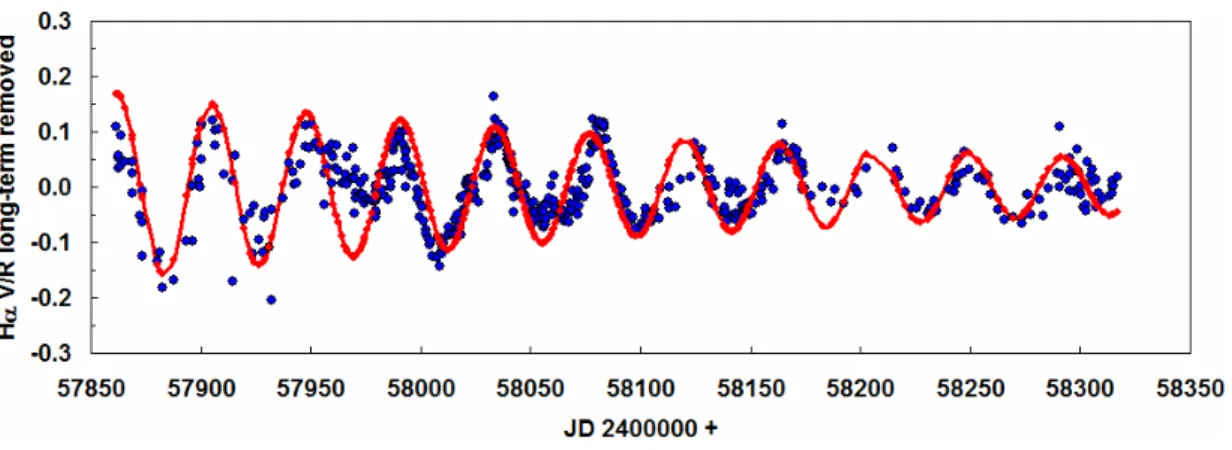
Figure 5. The total Hαemission flux (EW) behaviour [red points, refer to right axis] over the past year showing a 43.5-day periodic variation. The ratio of the Hαblue component peak flux (V) to the red component peak flux (R) is also shown [blue circles, refer to left axis]. Both components have the
same 43.5-day period, but the V/R ratio varies antisynchronously with the EW variation. The predicted time of mid-eclipse (JD 2458289) is shown, from the 1997/1998 eclipse of ephemeris of
Leedj¨arv et al. (1999) and the orbital period of Wright (1977).
The cyclic variability of the Hα EWs and the V/R ratio shown in Fig. 5 have been analysed in terms of a periodic behaviour and has led to the discovery of a persistent periodic variation of 43.5 days (Figs. 8 & 9) in the Hα EWs. This periodicity is present in the total EW, in the individual V and R peak fluxes, and most prominently in the V/R ratio. All of these components vary synchronously with the 43.5 day period, but the R flux varies with a consistently larger amplitude than the V flux. Hence the ratio V/R varies antisynchronously with that of the total EW.
What is surprising is that this 43.5 day periodicity persists into total eclipse when the hot companion and its associated accretion region have been occulted, and the total Hα flux has decreased substantially. However, the limited, out-of-eclipseU-band photometry available (Fig. 7 bottom) shows no obvious 43.5 day periodicity, suggesting that the B- star itself is not the source of the Hα variability; but, the size of the binary system is so large (the M star radius beingR1 ∼1000 solar radii) that the wind crossing time to travel a stellar radius (t1 ∼ 1 year) is much greater than the 43.5 day period. This rules out some type of regular structure propagating in the M supergiant wind as a source of the
6 IBVS6249
Figure 6. HαV/R flux residuals (blue dots) after subtraction of the long-term trend in Fig. 5 due to eclipse ingress. An exponentially decaying periodic variation (red dots) has been fit to these residuals
with the following function:
Fit to V/R residuals =Ae−ϕ/Tcos(2πϕ);A= 0.15;T = 15.0;ϕ= (JD−JD0)/P;P = 43.5 d; Epoch JD0= 2457905.
variability because it would be virtually impossible to retain a coherent variation over the spatial scales required to explain the persistence of the variation through total eclipse.
The inevitable conclusion is that the variability must be driven by variable excitation from the hot component, even when that component is totally eclipsed and hidden from our line of sight.
We will leave any further discussion of the nature of this 43.5 day variability to a future paper; in this current work we will merely present the observational material.
3 Summary and Results
The 43.5-day period is seen in both the total Hα EW (Fig. 5) and the blue-to-red flux peak ratio V/R (Fig. 5). The latter variation implies a periodic variation in net radial velocity also. This periodic variability has persisted well into totality through the present time just past mid-eclipse (July 2018). Going into eclipse, the overall Hα emission flux declines in peak intensity and in full width, indicating that the broad-line emission region originates in the immediate vicinity of the hot star, as expected. The decline of the EW into eclipse is much slower than expected for a point source, implying most of the emission comes from a substantially extended region.
The persistence of Hαemission through mid-eclipse implies about 1/3 of the emission comes from a very extended region with an area larger than the projected stellar disc of the M supergiant (with a stellar of radius R1 ∼ 1000 solar radii). The V/R flux ratio declined steadily during eclipse ingress, but started increasing at a slow rate well before mid-eclipse. This behaviour of the V/R curve implies the spatial configuration of the extended Hα emission is not symmetric about mid-eclipse. The secondary B star’s out- of-eclipse continuum flux does not appear to be variable, and this would seem to eliminate the hot star as the source of the variability. The M supergiant, which dominates the V- band flux and is somewhat variable, has a much longer ∼150 day period (Fig. 7 top) and is not the source of the 43.5-day periodicity. Finally, the M supergiant’s wind velocity (∼20 km s−1) is low, implying long wind crossing times (of∼1 year or more) for distances of the size of the Hα emitting region (≥R1). This wind timescale is too long to explain
IBVS6249 7
the 43.5-day variability. We conclude that the source of the excitation must be radiative in nature and originate from the hot component, but probably not from the B-type star itself.
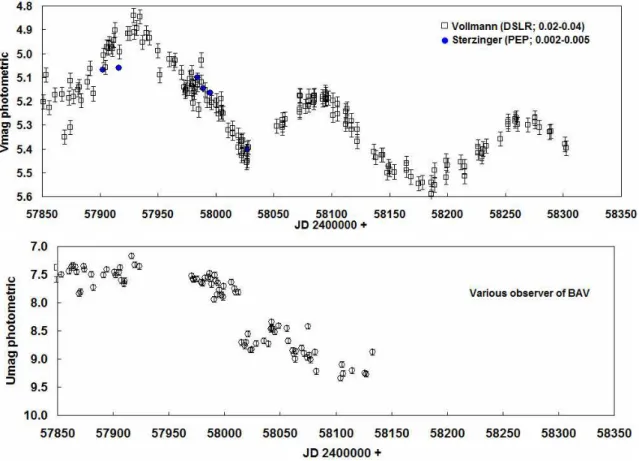
Figure 7. (top): V photometry of VV Cephei obtained over the same time period. There is no evidence of the 43.5-day period in this light curve (dominated by the M supergiant). (bottom): The U-band photometry available during the monitoring period, courtesy of the BAV, shows the onset of the eclipse around JD 2458000. The out-of-eclipseU-band photometry shows no obvious 43.5 day
periodicity, although the time sampling is poor.
At present, just past the time of mid-eclipse, it seems prudent to publish the observa- tional material in hand, and wait for the completion of totality and egress from eclipse.
It is hoped that having the complete times series of Hα emission flux data over the entire eclipse period will help elucidate the source of this puzzling periodic variation. It would be most useful the amateur community could obtain high-cadence observations of the ultraviolet continuum of the B star, especially once the star emerges from eclipse. For this purpose, Str¨omgren u photometry would be ideal, although Johnson U photometry would still be useful. We will defer a discussion of the nature of the variability to a future paper that will incorporate a more complete dataset.
Acknowledgements: The results presented here were only possible with the many VV Cep Hαspectra contributed by the ARAS observers. We are grateful for their continuing support. We are also grateful to the various members of the BAV (BAV = Bundesdeutsche Arbeitsgemeinschaft Ver¨anderliche Sterne) for providing theV and U brightnesses.
8 IBVS6249
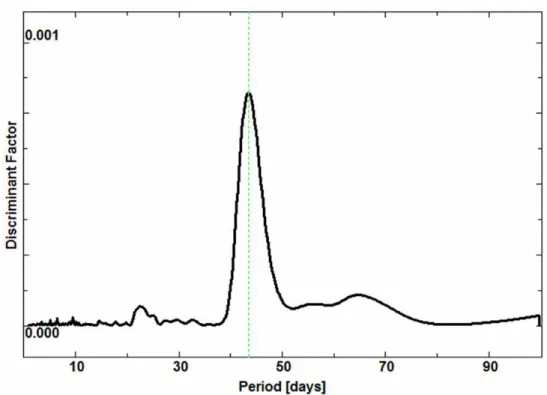
Figure 8. Scargle periodogram of the V/R flux residuals in Fig. 6, produced by the program AVE (Barbera 1998), showing the dominant 43.5 ±0.12 day period.
Figure 9. Phase plot of the found period of 43.5 days in Fig. 8; EpochT0= JD 2457905.
IBVS6249 9
Observers of the ARAS Spectroscopy Group
ARAS website - http://www.astrosurf.com/aras/ O. Garde, J. Foster, E. Bertrand, O. Thizy, M. Keiser, J. Guarro, E. Pollmann, C. Sawicki, P. Fosanelli, Dong Li, J. Martin, Ch. Kreider, U. Zurm¨uhl, M. Trypsteen, P. Somogyi, V. Desnoux, J. Broussat, Th.
Lemoult, Th. Griga, B. Koch, F. Neußer, K. Pixberg, M. Schwarz, T. Lester, J. Schirmer, E. Bryssinck.
ARAS Forum 28.11.17
http://www.spectro-aras.com/forum/viewtopic.php?f=19&t=1798&p=9863#p9863
References:
Barbera, R. 1999, AVE code, version 2.51,http://astrogea.org/soft/ave/aveint.htm Bennett, P. D., Hagen-Bauer, W. 2015, ”Giants of Eclipse: The zeta Aur Stars and other
Binary Systems”, Springer DOI
Leedj¨arv, L., Graczyk, D., Mikolajewsi, M. et al., 1999, A&A,349, 511
Pollmann, E. 2018, Moderator, VV Cep Campaign, ARAS Spectroscopy Forum, http://www.spectro-aras.com/forum/viewforum.php?f=19
Wright, K.O., 1977, JRASC, 71, 152

![Figure 5. The total Hα emission flux (EW) behaviour [red points, refer to right axis] over the past year showing a 43.5-day periodic variation](https://thumb-eu.123doks.com/thumbv2/9dokorg/1416441.119660/5.892.142.754.423.642/figure-total-emission-behaviour-points-showing-periodic-variation.webp)