Analysis of Fuzzy Logic Assisted Evaluation of the Minnesota Code
Norbert Sram*, Márta Takács **
* Óbuda University, PhD student, Budapest
** Óbuda University, Budapest, John von Neumann Faculty of Informatics, Hungary
*sramm.norbert@phd.uni-obuda.hu, **takacs.marta@nik.uni-obuda.hu
Abstract— In this paper the authors present the results of an ECG diagnostic system, which is based on the Minnesota Code with fuzzy assisted decision making. The paper uses the classical diagnostic approach provided by the Minnesota Code system definition as a reference point to compare it to the results produced by the fuzzy logic based approach.
Multiple fuzzy logic operators are used to provide the fuzzy logic assisted results and to investigate the advantages provided by a fuzzy logic approach. The paper studies the differences between the classical and fuzzy based approach without going into the details of medical correctness. The described tests are conducted on the publicly available PhysioNet database.
I. INTRODUCTION
The correctness and efficiency of Minnesota Code as an ECG diagnostic process has been studied in the past, providing insight into both the strength and weakness of the system. It has been shown multiple times that the major weakness of the diagnostic system is the crisp value based definitions of the diagnostic rules. In the paper [8]
the authors shown that by applying fuzzy logic to a subset of rules the diagnostic efficiency increased by 9%
compared to the classic approach. Based on these results the authors concluded that a comprehensive soft computing based approach could further improve the diagnostic results of the Minnesota Code system. The authors chose to complement the classic diagnostic system with fuzzy inference based diagnostic results instead of replacing the classic approach. The reason for this is that the efficiency of the classic approach was already proved to be comparable in efficiency to the visual analysis of the ECG signal done by medical professionals. The purpose of the presented approach is to build upon this efficiency and further improve it using fuzzy inference. The diagnostic system provides multiple results for an input and identifies borderline and inconsistent cases. This paper presents the results of the fuzzy complemented Minnesota Diagnostic system for a dataset of approximately 725 medical records from the PhysioNet database.
II. ECGDIAGNOSTIC KNOWLEDGE BASE The base of the diagnostic model used in this paper is the Minnesota Code system[7]. The Minnesota Code is a classification system for the electrocardiogram that utilizes a defined set of measurement rules to assign
specific numerical codes according to severity of ECG findings. It is the most widely used ECG classification system in the world for clinical trials and epidemiologic studies. The classification ruleset used by the diagnostic system has been tested and approved by medical professionals. From a high level view, the Minnesota Code is a structured list of rules that examine specific characteristcs of ECG waveforms. The fact that is has been proven to be efficient and that it already has a definition which is representable by fuzzy logic lead to the dicision to choose the Minnesota Code as the knowlegdge base for the diagnostic system.
The crisp values used in the definition of the rules play an important role from a diagnostic point of view. They either identify a heart condition or rule it out. The sharp distinction provided by the crisp values used in the rules is an important part of the Minnesota diagnostics system.
For a diagnostic system to be classified as Minnesota Code compatible is must meet those requirements.
However the usage of fuzzy sets along of the defined crisp values in the diagnostic rules provides additional information and the possibility to optimize the algorithms.
The diagnostic system uses this approach to identify diagnostic results which might provide an incorrect result.
III. DIAGNOSTIC SYSTEM DESCRIPTION
The knowledge base is built using an ontology based approach [2, 3]. The ontology is extended with fuzzy annotations to provide fuzzy reasoning capabilities [4].
Figure 1. displays a definition of a membership function inside the ontology model. A fuzzy membership function is specified as an XML string, the example shown in Figure 1. is the definition of an S-Shaped membership function. The fuzzy definitions allow a small margin for error on the measurement side. As an initial approach, the fuzzy sets will be set up to tolerate a 10% error in the measurement values. The result of the fuzzy inference provides the degree of truth at which an input waveform value matched a certain diagnostic rule. Thus the error margin is reflected in the output of the fuzzy system.
Based on the defined mapping of ECG waveform and Minnesota code diagnostic concepts [2, 3] the ontology is populated by a software application, which, for each diagnostic sample (ECG beat) creates an ontology individual, the corresponding class assertation axioms and data property axioms to represent the type and crisp value
– 121 –
ICCC 2013 • IEEE 9th International Conference on Computational Cybernetics • July 8-10, 2013 • Tihany, Hungary
978-1-4799-0063-3/13/$31.00 ©2013 IEEE
of an available waveform. This process is done for all available test samples on an empty ontology model. Using ontology reasoning the system deduces the specific diagnostic rules which can be executed and evaluates those using a classic expert system based approach, along with a fuzzy logic based approach using multiple fuzzy aggregation operators. For each input sample the diagnostic system produces an output for each Minnesota code which can be evaluated using multiple methods.
Figure 1. Membership function definition of an ontology concept
IV. DIAGNOSTIC TEST CASE
For conducting the tests, the authors used three publicly available databases from PhysioNet, the T-Wave Alternans Challenge Database (TWA database) and the St.-Petersburg Institute of Cardiological Technics 12-lead Arrhythmia Database (Incart database) and the PTB Diagnostic ECG Database [1]. The three databases contain the combined number of 725 multichannel ECG records. The subjects include patients (male and female) between the ages of 17 and 87 (mean age around 55), with myocardial infarctions, transient ischemia, ventricular tachyarrhythmia and other risk factors for sudden cardiac death, as well as healthy controls and synthetic cases. The duration of the ECG recordings varies between the ranges of 2 minutes to 30 minutes. To execute the diagnostic inference system, 3 typical ECG samples were chosen from each recording. The used algorithm for selecting the ECG samples avoids extreme cases and extracts the ones which represent the typical cases for a specific record.
The conducted test runs the Q and QS pattern rules of the Minnesota code for each extracted sample. The Q and QS patterns include the following 9 rules: 1-1-1, 1-1-2, 1-1-3, 1-2-1, 1-2-2, 1-2-6, 1-3-1, 1-3-3, 1-3-5. For details about a specific rule refer to the publicly available Minnesota code definition [7]. For each sample the diagnostic system produces three outputs, one which reflects the classical expert system approach and two fuzzy logic based calculations. The fuzzy logic based diagnostic calculations vary between the fuzzy operators applied to produce the antecedent. This may lead to different diagnostic output for those diagnostic rules which have multiple input waveforms. In the presented test the authors used the ‘min’ and ‘max’ operators for the fuzzy diagnostic calculations.
For the processing of the diagnostic results the authors classified the diagnostic outputs into four categories:
borderline, inconsistent, dominant and normal. In the categorization algorithm the fuzzy ‘min’ operator based result is used as the base of the comparison, because it is the most similar to the original Minnesota code declaration.
A diagnostic result can fall into multiple categories. A diagnostic result is flagged as borderline when the classic expert system based diagnostic result and the fuzzy ‘min’
operator based results have a 10% difference between their values. For example, a classic diagnostic result is true, but the fuzzy result has a degree of truth with a value of 0.89.
A diagnostic output classifies as inconsistent when the diagnostic output of the classic approach differs from the fuzzy ‘min’ operator based approach. The diagnostic result values of the classic and fuzzy ‘min’ operator based approach are classified as different if the difference between their values is significant, meaning greater or equal to 50%. For example, the classic result is true, fuzzy ‘min’ operator based is 0.5.
If a diagnostic outputs fuzzy results have a significant difference (50%) between their degrees of truthfulness values, it would be flagged as dominant. An example for this is the case when the ‘min’ operator based output is 0.25, but the ‘max’ operator based one is 0.75. This is usually a sign that one of the input waveforms significantly alters the truthfulness of a rule.
The diagnostic result for the Incart [x] database consists of 5265 outputs for the Q and QS pattern rules. Of the 5265 outputs 88 were flagged as borderline cases, 621 were flagged as dominant and 19 as inconsistent. Table 1.
shows the percentages of specific categories for the sample set.
Category Samples Percentage of Total
Borderline 88 1.67%
Dominant 621 11.79%
Inconsistent 19 0.36%
Table 1. Categorized results for the Incart database
The results for the TWA database [1] consist of 4980 samples for the Q and QS pattern rules. 162 samples were given the borderline category, 661 were categorized as dominant and 73 as inconsistent.
Category Samples Percentage of Total
Borderline 162 3.25%
Dominant 661 13.27%
Inconsistent 73 1.46%
Table 2. Categorized results for the TWA database
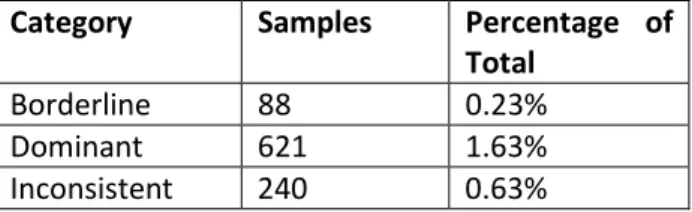
Category Samples Percentage of Total
Borderline 88 0.23%
Dominant 621 1.63%
Inconsistent 240 0.63%
N. Sram and M. Takács • Analysis of Fuzzy Logic Assisted Evaluation of the Minnesota Code
– 122 –
Table 3.Categorized results for the PTB database.
The results for the PTB database [1] consist of 37960 diagnostic samples for the Q and QS pattern rules. The number of borderline category samples is 88, the number of samples flagged as dominant is 621 and 240 samples were flagged as inconsistent.
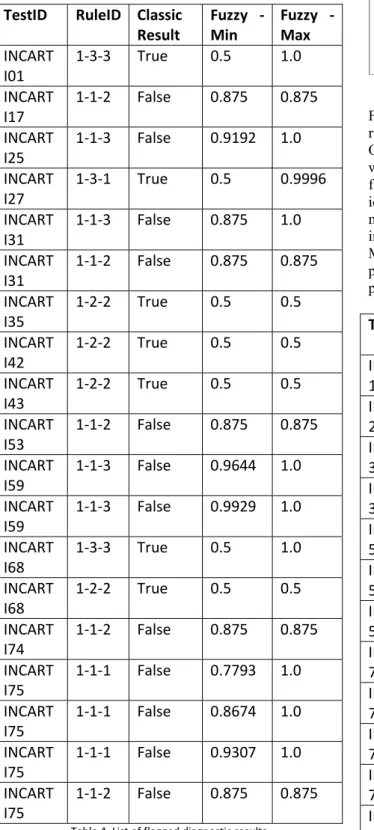
TestID RuleID Classic Result
Fuzzy - Min
Fuzzy - Max INCART
I01
1-3-3 True 0.5 1.0 INCART
I17
1-1-2 False 0.875 0.875 INCART
I25
1-1-3 False 0.9192 1.0 INCART
I27
1-3-1 True 0.5 0.9996 INCART
I31
1-1-3 False 0.875 1.0 INCART
I31
1-1-2 False 0.875 0.875 INCART
I35
1-2-2 True 0.5 0.5 INCART
I42
1-2-2 True 0.5 0.5 INCART
I43
1-2-2 True 0.5 0.5 INCART
I53
1-1-2 False 0.875 0.875 INCART
I59
1-1-3 False 0.9644 1.0 INCART
I59
1-1-3 False 0.9929 1.0 INCART
I68
1-3-3 True 0.5 1.0 INCART
I68
1-2-2 True 0.5 0.5 INCART
I74
1-1-2 False 0.875 0.875 INCART
I75
1-1-1 False 0.7793 1.0 INCART
I75
1-1-1 False 0.8674 1.0 INCART
I75
1-1-1 False 0.9307 1.0 INCART
I75
1-1-2 False 0.875 0.875
Table 4. List of flagged diagnostic results
Figure 2. Inconsistent results diagram for the Incart database Figure 2. is the graphical representation of the various results for the inconsistent samples in the Incart database.
On Table 4. the same dataset is displayed. The samples which are flagged as inconsistent are a subset of the ones flagged as borderline. These diagnostic results were identified as samples which require the attention of a medical expert. The importance of identifying potentially incorrectly diagnosed samples lies in the fact that the Minnesota rule system is a hierarchical system, thus the propagation of false assumptions further impacts the precision of the final diagnostic decision.
TestID RuleID ECG Property
Criteria Value
Measured Value INCART
17
1-1-2 Q Interval 0.04 0.039 INCART
25
1-1-3 R
Amplitude
0.3 0.294 INCART
31
1-1-2 Q Interval 0.04 0.039 INCART
31
1-1-3 Q Interval 0.04 0.039 INCART
53
1-1-2 Q Interval 0.04 0.039 INCART
59
1-1-3 R
Amplitude
0.3 0.296 INCART
59
1-1-3 R
Amplitude
0.3 0.298 INCART
74
1-1-2 Q Interval 0.04 0.039 INCART
75
1-1-1 Q/R Ratio 0.33 0.3 INCART
75
1-1-1 Q/R Ratio 0.33 0.305 INCART
75
1-1-1 Q/R Ratio 0.33 0.311 INCART
75
1-1-2 Q Interval 0.04 0.039
Table 5. List of conflicting results
– 123 –
ICCC 2013 • IEEE 9th International Conference on Computational Cybernetics • July 8-10, 2013 • Tihany, Hungary
If we filter the results shown in Table 4. for samples, which have a conflicting diagnostic results, meaning the diagnostic result of the classic system does not match the diagnostic result provided the fuzzy inference with the minimum operator we get a subset, which shows the advantages of a fuzzy logic based approach. Table 5.
shows the results of the sample filtering. The table includes the properties, for which the classic approach and the fuzzy logic based approach provided different results. The column named criteria value shows the value expected by the corresponding rule definition and the column measured value shows the actual value of the specific ECG property. As the results show, the difference between the expected and the actual results is insignificant, can be caused by various factors such as measurement errors, rounding errors, noise factors and so on. These minor differences are enough to trigger a different response by the diagnostic system, leading to either false positives or false negatives. By using fuzzy logic it is possible identifying problematic diagnostic entries. Another advantage of the fuzzy logic based approach is that the diagnostic system can be fine-tuned by modifying the tolerance factor of the membership function definitions. The results shown are based on a 10% tolerance factor. The fuzzy assisted Minnesota code provides additional safety against incorrect diagnostic conclusions by providing feedback to the medical professional that the inconsistent results should be verified. Dynamic adjustment of the tolerance factor and diagnostic processing based on multiple tolerance factors could provide additional information for predicting possible incorrect diagnostic samples. Further loosening of the tolerance factor would lead to additional inconsistencies and thus require more verification by the medical professionals.
V. CONCLUSION
Based on the results presented in this paper, fuzzy logic is a viable extension to the original Minnesota code, which further enhances the diagnostic precision of the
system. One of the most significant steps towards the improvement of providing automated diagnostic solutions is the accessibility to multiple outputs for each diagnostic rule. Future work includes additional fuzzy aggregation methods and in depth analysis of the inconsistent results.
The diagnostic results of the system will be compared to the expected results, with and without fuzzy based assistance. The result of the comparison can help identify possible risk factors, such as specific rule with different tolerance factor.
Examining the results of the whole Minnesota code system, not just a subset group would provide useful insight to possible improvements.
REFERENCES
[1] Goldberger AL, Amaral LAN, Glass L, Hausdorff JM, Ivanov PCh, Mark RG, Mietus JE, Moody GB, Peng C-K, Stanley HE.
PhysioBank, PhysioToolkit, and PhysioNet: Components of a New Research Resource for Complex Physiologic Signals.
Circulation 101(23):e215-e220 [Circulation Electronic Pages;
http://circ.ahajournals.org/cgi/content/full/101/23/e215]; 2000 (June 13).
[2] Sram, N., "Minnesota Code: Evaluation of fuzzy ontology based approach", Intelligent Engineering Systems (INES), 2012 IEEE 16th International Conference, pp. 477-481
[3] Sram, N., “An Ontology model-based ECG diagnostic solution”, Computational Intelligence and Informatics (CINTI), 2012 IEEE 13th International Symposium, pp. 191-194
[4] Fernando Bobillo, Umberto Straccia, “Fuzzy ontology representation using OWL 2”, International Journal of Approx imate Reasoning, 2011, pp. 1073-1094
[5] Sram, N. Takacs, M., “Fuzzy rule base construction for Minnesota Code”, IEEE 9th International Symposium on Applied Machine Intelligence and Informatics (SAMI), 2011, pp. 213 - 217.
[6] http://www.sph.umn.edu/pdf/epi/ecg/mncode.pdf
[7] Peter W. M, Shahid L., “Automated serial ECG comparison based on the Minnesota code”, Journal of Electrocardiology, Vol. 29, Sup. 1, pp 29-34, 1996.
[8] Balázs, K. Haraszti, Gy. Kozmann, “Increasing the Efficiency of the “Excluding Rules” of the Minnesota Coding System using the Fuzzy Logic,” Measurement Science Review, Vol. 5 Section 2, 2005
N. Sram and M. Takács • Analysis of Fuzzy Logic Assisted Evaluation of the Minnesota Code
– 124 –