Soft Computing Based Point Correspondence Matching for Automatic 3D Reconstruction
Annamária R. Várkonyi-Kóczy
1, 2, András Rövid
1, 21Dept. of Measurement and Information Systems,
2Integrated Intelligent Systems Japanese-Hungarian Laboratory Budapest University of Technology and Economics,
Magyar tudósok krt. 2, H-1521 Budapest, Hungary e-mails: rovid@mit.bme.hu, koczy@mit.bme.hu
Abstract: In computer vision image point correspondence matching plays an important role. With the help of the point correspondence matching algorithms for example some of methods concerning the field of stereo vision can be automatized. This paper presents a method for quickly and reliably selecting and matching of the most interesting image points (feature points).
Keywords: Feature points, image point correspondence, 3D modeling, noise cancellation, edge detection, corner detection, fuzzy reasoning
1 Introduction
Feature matching is a key component in many computer vision applications, for example in stereo vision, motion tracking, and identification. The most significant problem in stereo vision is how to find the corresponding points in two, let us call them left and right images, referred to as the correspondence problem. In the field of computer vision several applications require to match feature points of images taken form different camera positions. Stereo techniques can be distinguished by several attributes, e.g., whether they use area-based or feature-based techniques, are applied to static or dynamic scenes, use passive or active techniques, or produce sparse or dense depth maps. The extremely long computational time needed to match stereo images is still the main obstacle on the way to the practical application of stereo vision techniques. In applications such as robotics, where the environment being modeled is continuously changing, these operations must also be fast to allow a continuous update of the matching set, from which 3D information is extracted [1] [2]. The correspondence search in stereo images is commonly reduced to significant features as computing time is still an important criterion in stereo vision. There exist several stereo vision techniques, from which
the most popular are the Area-based and the Feature-based stereo techniques. The first kind of the mentioned techniques finds corresponding points based on the correlation between the corresponding areas in left and right images [3]. First, a point of interest is chosen in one of the images. A correlation measure is then applied to search for a corresponding point with a matching neighborhood in the other image. Area-based techniques have the disadvantage of being sensitive to photometric variations during the image acquisition process and are sensitive to distortions, which reason in the first place is the changing viewing position.
Feature-based stereo techniques, on the other hand, match features in the left image to those in the right image. Features are selected as the most prominent parts in the image, such as, for example, edge points or edge segments, corner points etc. Feature-based techniques have the advantage of being less sensitive to photometric variations and of being faster than the area-based stereo method, because there are fewer candidates for matching corresponding points [4]. If we combine the Area-based stereo techniques with the Feature-based stereo techniques we can get better results. In this paper a new approach of feature points correspondence matching is presented. The paper is organized as follows: In Section 2 the preprocessing phase of the input pictures is detailed, Section 3 shows how to find edge and corner points, while Section 4 presents the matching algorithm of these feature points. In Section 5 experimental results are summarized and Section 6 is devoted to the conclusions.
2 Preprocessing of the Images, Noise Elimination
A major task in the field of digital processing of measurement signals is to extract information from sensor data corrupted by noise [5] [6]. For this purpose we will use a special fuzzy system characterized by an IF-THEN-ELSE structure and a specific inference mechanism. Different noise statistics can be addressed by adopting different combinations of fuzzy sets and rules [5] [6]. Let x(r) be the pixel luminance at location r=[r1,r2] in the noisy image where r1 is the horizontal and r2 the vertical coordinate of the pixel. Let N be the set of eight neighboring pixels (see Fig. 1a). The input variables of the fuzzy filter are the amplitude differences defined by:
8 ,..., 1
0, =
−
=
∆xj xj x j (1)
where the xj, j=1,…,8 values are the neighboring pixels of the actually processed pixel x0 (see Fig. 1a).
x1 x2
x4 x5 x7 x8 x0
x3
x6
Figure 1a
The neighboring pixels of the actually processed pixel x0
N1 N2 N3 N4 N5
N6 N7 N8 N9 Figure 1b Pixel patterns N1,...,N9⊆N
0 a b L-1
mLP
1
- +L 1 a b
mLN
Figure 2
Membership function mLP. Parameters a and b are appropriate constant values Let y0 be the luminance of the pixel having the same position as x0 in the output signal. This value is determined by the following relationship:
y x
y0 = 0 +∆ (2)
where ∆y is calculated thereinafter (see eq. (5)). Let the rule-base deal with the pixel patterns N1,...,N9⊆N (see Fig. 1b).
The value y0 can be calculated, as follows [7]:
{ }
{
(∆ ): ∈ ; =1,...,9}
=MAX MIN mLP xj xj Ni i
λ (3)
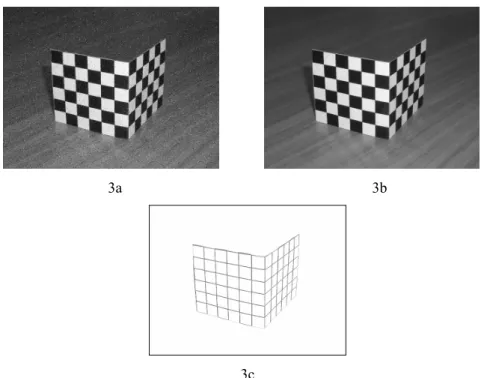
3a 3b
3c
Figure 3a represents the image corrupted by impulse noise, 3b shows the image after fuzzy filtering and in figure 3c the image after the fuzzy based edge detection can be followed
{ }
{
( ): ; 1,...,9}
* =MAX MIN mLN ∆xj xj∈Ni i=
λ (4)
y x y
L y
∆ +
=
∆
−
=
∆
0 0
) 1
( λ
(5)
where ∆λ=λ-λ*, mLP and mLN correspond to the membership functions of fuzzy sets large positive and large negative and mLP(u)=mLN(-u) (see Fig. 2). The filter is recursively applied to the input data. Using this fuzzy filter the impulse noise can effectively be eliminated. With the help of the parameters a, b the sensitivity of the noise elimination method can be modified, i.e., the shape of the membership functions mLN and mLP can be tuned. If after the noise cancellation noisy image points will remain in the image, they will also be detected as corner points in the next step (see Section 3) and therefore it is very advisable to eliminate them as effectively as possible. Otherwise, for example at one hand, at automatic 3D reconstruction of a scene these non eliminated noisy pixels will appear in the 3D space, as well and on the other hand, the efficiency of the point correspondence matching algorithms will brake down with the number of non-eliminated noisy pixels.
3 Detection of Feature Points
Edge detection in an image is a very important step for a complete image understanding system. In fact, edges correspond to object boundaries and are therefore useful inputs for 3D reconstruction algorithms. The proposed fuzzy based edge detection [7] can very advantageously be used for this purpose.
Let xi,j be the pixel luminance at location [i,j] in the input image. Let us consider the group of neighboring pixels which belong to a 3x3 window centered on xi,j (see Fig. 1a). The output of the edge detector is yielded by the following equation [7]:
{ }
j i j i
j i j i
LA LA
j i
x x y
x x y
y m y m MAX L
z
, 1 , 2
, , 1 1
2 1
, ( 1) ( ), ( )
−
=
∆
−
=
∆
∆
∆
−
=
−
− (6)
where zi,j is the pixel luminance in the output image and mLA is the used membership function (see Fig. 4). Pixels xi-1,j and xi,j-1 are the luminance values of the left and the upper neighbors of the pixel at location [i,j].
The fuzzy based technique compared to the classical methods provided better results with less (very small) processing time. Fig. 3 shows an example for the filtering and edge detection results. In Fig. 3a the original photo corrupted by noise can be seen, Fig. 3b presents the filtered image of Fig. 3a, while in Fig. 3c the result of the edge detection can be followed.
Corners are also local image features and are very useful at the 3D reconstruction of a scene. Using these feature points the processing time of the reconstruction of a scene can be reduced.
0 q
p
L-1 mLA
1
Figure 4
Membership function mLA. Parameters p and q are appropriate constant values with the help of which the membership function mLA can be shaped. Parameter q is for changing the curvature of the membership function and p is for setting the sensitivity of the proposed
edge detector
Any corner detection algorithm should satisfy the following requirements:
• All the true corners should be detected
• No false corners should be detected
• Corner points should be well localized
• Corner detector should be robust with respect to noise Förstner determines corners as local maxima of function H(x,y) [8]:
2 2
2 2 2
) , (
∂ + ∂
∂
∂
∂
∂
∂
− ∂
∂
∂
∂
∂
=
y I x
I
y I x I y
I x I y x
H
,
(7)where I(x,y) is the intensity function and x, y are the coordinates of the pixels in the image. Starting from the algorithm of Förstner a new, improved corner detection algorithm can be developed by combining it with fuzzy reasoning. This can be used for the characterization of the continuous transition between the localized and not localized corner points, as well. The algorithm consists of the following steps: First, the picture, in which we have to find the corners, is preprocessed. As a result of the preprocessing procedure the noise is eliminated.
For this purpose we apply the above described fuzzy filter [5] [6]. After noise- filtering, the first derivatives of the intensity function I(x, y) are calculated in each image point. This is solved by using the following convolution masks:
−
−
−
1 0 1
1 0 1
1 0 1
for the determination of x I
∂
∂ and
− − −
1 1 1
0 0 0
1 1 1
for determining y I
∂
∂ .
Table 1
Comparison some of corner detectors with fuzzy based one Correctly
detected corners [%]
Incorrectly detected points
[%]
Non detected points
[%]
Fuzzy based corner detector 84 3,2 16
SUSAN corner detector 52 4,7 48
Harris corner detector k=0.001 71 15,3 29
For increasing the effectiveness of the corner detection it is proposed to smooth the entries Ix2, Iy2, IxIy, in eq. (7), (Ix and Iystand for the first partial derivatives of the intensity function I(x,y), x,y denote the 2D coordinates of the pixels). This can be done by applying a Gaussian 6x6 convolution kernel with σ=1 [8]. As the following step, the values H(x,y) are calculated for each image point with the help of the previously determined smoothed Ix2, Iy2, and IxIy values. If the detected corners are neighbors, we should keep only the corner having the largest calculated value H(x,y). The others are to be ignored. In most of the cases we can not unambiguously determine whether the analyzed image point is a corner or not based only on a certain concrete threshold value, therefore we have introduced fuzzy techniques in the inference of the proposed corner detection algorithm. As a result, the rate of the corner detection has been improved (see Table 1). By the score of the membership function of fuzzy set “corners” (see Fig. 5) we can determine a weighting factor, which characterizes “the rate of being a corner”. The value of the membership function mc is 1 for those image points for which the calculated value H equals or is larger than the given threshold value. With the help of the parameters p and q (see Fig. 5) the shape of the membership function can be modified and so the sensitivity of the described detector can be changed. Finally, the output of the proposed corner detector is yielded by the following relation:
) ( ) 1
, (L m H
Cxy = − c , (8)
0 q
p
threshold mc
1
H Figure 5
Membership function of fuzzy set “corners” (mc). Axis H is the axis of the calculated H(x,y) values. Parameters p and q are appropriate constant values with the help of which we membership function mc can be shaped: parameter q is for changing the curvature of the
membership function and p is for setting the sensitivity of the proposed corner detector.
Figure 6
The image after fuzzy based corner detection. The circles indicate the detected corners.
where Cx,y represents the gray-level intensity values of the output image, x and y are the horizontal and vertical coordinates of the processed image point, L is the largest gray level intensity value, and H stands for the calculated H(x,y) values.
4 Matching the Corresponding Feature Points in Stereo Images
Feature matching is commonly referred to as the correspondence problem. The problem is how to automatically match corresponding features from two images, while at the same time not assigning matches incorrectly. The common approach for corners, is to take a small region of pixels around the detected corner (referred to as a correlation window) and compare this with a similar region around each of the candidate corners in the other image. Each comparison yields a score, a measure of similarity. The match is assigned to the corner with the highest matching score. The most popular measure of similarity is the cross-correlation.
Most matching algorithms include constraints to complement the similarity measure. These may take the form of constraints on which corners are selected as candidate matches: a maximum disparity, or corners which agree with some known relationship between the images (such as the epipolar geometry).
Constraints such as uniqueness or continuity may also be applied after candidate matches have been found. With the help of the epipolar constraint we can reduce the number of candidate image points. We have to search only along the epipolar line corresponding to the actually chosen image point in the source image. This epipolar line can be determined using the so called fundamental matrix [2]. The fundamental matrix defines a bilinear constraint between the coordinates of the corresponding image points. If for example m2 is the point in the second image
Figure 7
Illustration of the proposed point matching technique. In the left image a chosen corner is illustrated, while in the right image the candidate corner points can be seen.
m1
The environment of point m1
Epipolar line corresponding to point m1
m2
Point of interest (corner or edge point)
l
m1Searching window
The environment of point m2 X
Y
X
Y
Image1 Image2
corresponding to m1 (see Fig. 7), it must lie on the epipolar line lm1. The epipolar constraint can be written as:
=0
1 2Fm
mT (9)
Linear Solution for the Fundamental Matrix:
Each point match gives rise to one linear equation in the unknown entries of matrix F. The coefficients of this equation can easily be written in terms of the known coordinates of m1 and m2. Specifically, the equation corresponding to a pair of points m1 and m2 will be
33 0
32 31 23 22
21 13
12 11
=
′ +
′ + +
′ +
′ + +
′ +
′ +
f f y f x yf f y y
f x y xf f y x f x
x (10)
where the coordinates of m1 and m2 are (x, y, 1)t and (x',y',1)t, respectively.
Combining the equations obtained for each match gives a linear system that can be written as Aw = 0, where w is a vector containing the 9 coefficients of F (fij) and each row of A is built of the coordinates m1 and m2 of a single match. Since F is defined only up to an overall scale factor, we can restrict the solution for w to have norm 1. We usually have more than the minimum number (8) of points, but these are perturbed by noise so we will look for a least squares solution:
2
min1Aw
w= (11)
As Aw 2 =wTATAw
,
we have to find the eigenvector associated with the smallest eigenvalue of the 9x9 symmetric, positive semidefinite normal matrix ATA. However, this formulation does not enforce the rank constraint, so a second step must be added to the computation to project the solution F onto the rank 2 subspace. This can be done by taking the Singular Value Decomposition (SVD) of matrix F and setting the smallest singular value to zero. Basically, SVD decomposes any real valued matrix F in the form ofF = Q D R (12) where D is diagonal and Q and R are orthogonal matrices. Setting the smallest
diagonal element of D to 0 and reconstituting gives the desired result.
As we know, the images in which we have to find the corresponding feature points are taken from different camera positions. If the angle of the camera positions is relatively small, we have greater chance to match the mentioned feature points, because of the small deformation of image pixels between two views. In this case the corresponding points can be found with high reliability in each image. Feature point mentioned in this section can be either corners or edge points. Matches are found by evaluating the similarity between image regions and selecting the match of the pair of regions with the highest similarity (see Fig. 7). There are many
similarity measure definitions known in the literature [10]. In this paper, we introduce a new measure of similarity which is based on the combination of cross- correlation and a fuzzy measure:
∑ ∑ ∑
=
2 2) , ( ) , ( )
, ( ) , (
) , ( ) , ( ) , (
y x I y x F y x I y x F
y x I y x I y x M F
R m
L m
R L
m
s , (13)
where IL and IR are the intensity functions of the input images (left and right image) and Fm stands for the fuzzy measure corresponding to the pixel with coordinates x,y. Fm can be calculated, as follows:
)}
( ), ( { )
,
( x y MIN x y
F
m= µ
Aµ
B , (14)µA and µB are the membership functions in universes X and Y representing the closeness of the points in the environment to the analyzed corner point-candidate (see Fig. 8).
A point in the environment of the analyzed corner Analyzed corner
Membership functions
Figure 8
Fuzzy membership functions µA and µB of closeness used in eqs. 13, 14
5 Experimental Results
Fig. 9 represents two overlapped images, taken form two different camera positions. In the image the point correspondence is illustrated with the help of lines joining the corresponding image points. The end points of the lines represent the corresponding feature points of the overlapped images.
µ
Aµ
BFigure 9
The two images in overlapped form with the corresponding feature points
(a) (b)
Figure 10
The epipolar lines and an example of two corresponding feature points
Fig. 10a and Fig. 10b illustrate two images taken from different camera positions.
On each of them an epipolar line corresponding to the pointed image pixel can be followed. To the image point A corresponds the epipolar line LA and to the image point B correspond the epipolar line LB. The corresponding image point of A is the image point B and inversely the point which corresponds to B is the image point A.
Conclusions
This paper introduces a new fuzzy based method for the matching of corresponding feature points in images, which are taken of the same scene from different camera positions. The method uses fuzzy based noise elimination and feature detection algorithms, with the help of which we can eliminate the non interesting points from the images and detect those feature points, which are the most interesting from the 3D reconstruction point of view. The method combines the area based and the feature based stereo techniques and applies fuzzy reasoning for the determination of a similarity measure, with the help of which we can decide which feature points can be the best candidates of being the corresponding
B
LB LA
points. The method introduced in this paper can advantageously be used in many other fields, as well, e.g. in robot guiding, medicine, and 3D object reconstruction.
Acknowledgement
This work was sponsored by the Hungarian Fund for Scientific Research (OTKA T035190 and T049519) and the Hungarian-Portuguese Intergovernmental S&T Cooperation Programme (P-24/03).
References
[1] Zhang, Z., Deriche, R., Faugeras, O., Luong, Q.-T., “A Robust Technique for Matching Two Uncalibrated Images Through the Recovery of the Unknown Epipolar Geometry,” Artificial Intelligence, 1995, pp. 87-119
[2] Rövid, A., A. R. Várkonyi-Kóczy, Várlaki, P., “3D Model Estimation from Multiple Images,” IEEE International Conference on Fuzzy Systems, FUZZ- IEEE’2004, July 25-29, 2004, Budapest, Hungary, pp. 1661-1666
[3] Faugeras, O., Vieville, T., Theron, E., Vuillemin, J., Hotz, B., Zhang, Z., Moll, L., Bertin, P., Mathieu, H., Fua, P., Berry, G., Proy, C., “Real time correlation-based stereo: algorithm, implementations and applications,”
Research Report 2013, INRIA Sophia-Antipolis, France, August 1993, p. 45.
[4] Lee, C.-Y., Cooper, D. B., and Keren, D., “Computing Correspondence Based on Region and Invariants without Feature Extraction and Segmentation,” Proc. CVPR´93, New York, USA, 1993, pp. 655-656
[5] Russo, F., “Fuzzy Filtering of Noisy Sensor Data,” In Proc. of the IEEE Instrumentation and Measurement Technology Conference, Brussels, Belgium, 4-6 June 1996, pp. 1281-1285
[6] Russo, F., “Recent Advances in Fuzzy Techniques for Image Enhancement,”
IEEE Transactions on Instrumentation and Measurement, Vol. 47, No. 6, Dec. 1998, pp. 1428-1434
[7] Russo, F., “Edge Detection in Noisy Images Using Fuzzy Reasoning,” IEEE Transactions on Instrumentation and Measurement, Vol. 47, No. 5, Oct.
1998, pp. 1102-1105
[8] Förstner W., “A feature based correspondence algorithm for image matching,” Int. Arch. Photogramm. Remote Sensing, vol. 26, 1986, pp. 150- 166
[9] Catté, F., Lions, P.-L., Morel, J.-M., Coll, T., “Image selective smoothing and edge detection by nonlinear diffusion,” SIAM Journal on Numerical Analysis, 32:, 1992, pp. 1895-1909
[10] Bogdan, G., Meer, P., “Point Matching under Large Image Deformations and Illumination Changes,” IEEE Transactions on Pattern Analysis and Machine Intelligence, VOL. 26, NO. 6, JUNE 2004, pp. 674-688