Abstract
With its adverse effects on the health of consumers and the global economy, food adulteration is considered to be one of the pressing issues of our times. Beef Protein powders (BPP) are particularly among the most fraud-prone products mainly due to their ever-growing consumption. For the purpose of our study, FT-NIR spectroscopy was applied to quantify four commonly used adulterants: Melamine (M), Urea (U), Glycine (G) and Taurine (T) in BPP.
Analysis with chemometric tools proved the efficiency of the aforementioned technique as a rapid nondestructive analytical tool for the detection of Beef protein powder adulteration.
Keywords
Beef Protein Powder, FT-NIR spectroscopy, adulteration, Chemometrics
Introduction
Meeting the demands of a more health conscious public in terms of safe, nutritious, and wholesome food is of paramount importance in the 21st century.
This is partly due to the rise in fraudulent practices which are becoming more and more common with the advent of newer, more sophisticated ways of altering the quality and the composition of food matrices.
As a consequence of the high paced lifestyle of global population, the market of Protein-based supplements is set to reach unprecedented growth rates estimated at 45.27 billion U.S. dollars [1]. This ever-growing consumption makes these products among those targeted by food fraudsters. Over the course of years,
counterfeits of these high value foods have been made by using compounds that mask the protein content when measured by conventional methods [1-3].
Checking whether these products comply with their marketed protein content calls for swifter and more accurate methods that offer real-time detection, high sensitivity and analytical selectivity.
Our study aimed at assessing the efficiency of Fourier Transform Near-Infrared spectroscopy (FT- NIR) regarding the quantification of four adulterants:
Melamine (M), Urea (U), Glycine (G) and Taurine (T) in Beef protein powders (BPP) which have received little research attention regarding their adulteration.
Material and methods
Beef protein powder, taurine, glycine and melamine were acquired from a reputable protein powder production company. The nominal protein value of the beef protein powder was 80%. Urea was acquired from Elemental SRL (Bihor, Romania).
Experimental design
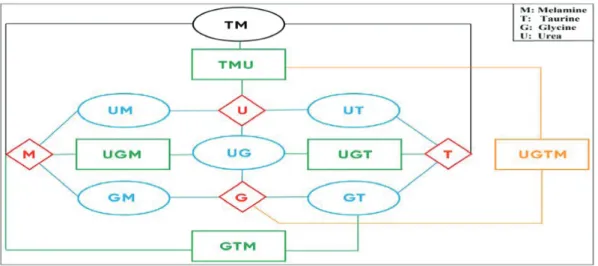
To simulate the different potential adulterations, the adulterants were added to the protein powder samples according to a matrix containing all possible combinations of (U), (G), (T) and (M) in different quantity (Figure.1). This combination pattern was developed to test the efficacy of FT-NIR spectroscopy in detecting multiple adulterants in beef protein powder.
For each combination, beef protein powder was artificially adulterated with gradients consisting of six different levels corresponding to the following concentrations 0.5, 1, 1.5, 2, 2.5 and 3%. Since
HUNGARIAN AGRICULTURAL ENGINEERING N° 36/2019 44-50
Published online: http://hae-journals.org/
HU ISSN 0864-7410 (Print) / HU ISSN 2415-9751(Online) DOI: 10.17676/HAE.2019.36-44
QUANTIFICATION OF MULTIPLE ADULTERANTS IN BEEF PROTEIN POWDER BY FT-NIR
Author(s):
B. Aouadi1, J.L. Z. Zaukuu1, Z. Gillay1, B. Gillay1, M. Fodor2, Z. Kovacs1 Affiliation:
1Department of Physics and Control,
2Department of Applied Chemistry,
Szent István University, Somlói út.14-16., Budapest, H-1118, Hungary Email address:
balkis.aouadi@gmail.com
PERIODICAL OF THE COMITTEE OF AGRICULTURAL AND BIOSYSTEM ENGINEERING OF
THE HUNGARIAN ACADEMY OF SCIENCES and
SZENT ISTVÁN UNIVERSITY Faculty of Mechanical Engineering Received: 2019.10. 20. - Accepted: 2019.12. 28.
melamine has the highest nitrogen content among the studied adulterants, the latter were added in melamine concentration equivalent to account for any differences.
The total number of mixtures corresponded to 90 samples (15 mixtures × 6 adulteration levels per
mixture). Each of these was prepared in triplicates including a control resulting in a total number of samples of 271.
Figure 1. Mixture matrix for 15 mixtures of beef protein powder adulteration Acquisition of NIR spectra
Prior to scanning, each mixture was poured into a 2 cm depth cuvette. The vials were then shaken for an approximate duration of 10 seconds and taped five times for a better homogenization. The samples were scanned in a random order and three consecutives were taken for each sample. The NIR spectra of pure and adulterated protein powder samples were measured over the range [800 to 2500] nm on a multipurpose analyser Fourier Transform Near Infrared Spectrometer (MPA, Bruker Optics, Ettlingen, Germany) using the OPUS software (v.7.2, Bruker Optics, Ettlingen, Germany). The data was collected by diffuse reflectance using the Integrating Sphere module (sphere macro sample) allowing the spectra of the materials to be collected through the bottom of the vials with a resolution of 8 cm-1. Each spectrum was the average of 32 scans. Background spectrum was acquired before each series of measurements.
Data analysis
The analysis of the generated spectra was performed with R-project software (v. 3.3.2, The R Foundation for Statistical Computing, Vienna, Austria) using aquap2 package. To extract the significant information contained in the spectral data, several pre-treatments were applied: Savitzky-Golay (SG) filter (second-order polynomial with 7, 11 or 21 points), second derivatives and Multiplicative Scatter Correction (MSC). (SG) parameters were optimized
and the optimal window length that offered the best signal-to-noise ratio of the original spectra was set to 21 points. To minimize the effect of overlapping peaks and baseline shifts, second derivatives of pure, adulterated beef protein powder spectra as well as pure adulterants were calculated based on Savitzky–
Golay derivation using 9 points. Last but not least, Multiplicative Scatter Correction was performed on smoothed spectra in order to reduce any possible baseline variations.
Multivariate data analysis
The data set was examined for its overall distribution using principal component analysis (PCA) and also, to detect outliers before building linear discriminant models (LDA). The latter were based on the type of adulteration and a three-fold cross validation was employed to ensure the inclusion of the samples at least once in the evaluation set resulting in three LDA models [1][4].
Partial Least squares Regression (PLSR) was used to develop chemometric models that could predict the concentration of the studied adulterants in adulterated beef protein powders.
The precision and accuracy of the developed PLSR models were evaluated by the coefficient of determination (R2) and root mean square error (RMSE) of both cross-validation and independent prediction. Latent variables (LV) were selected based on the lowest RMSECV (Root Mean Squared Error of Cross-validation) [5].
Results and discussion
Visual inspection of the NIR spectra
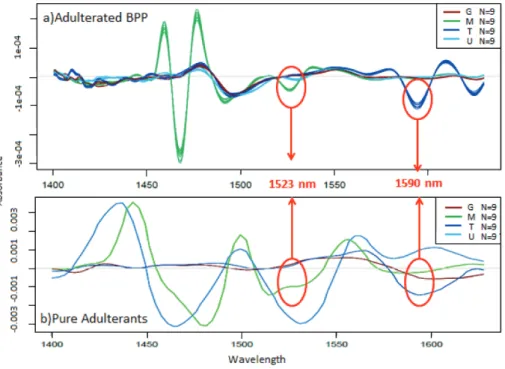
From figures (2.a and 2.b), the spectra of adulterated samples revealed some features similar to that of pure adulterants where distinctive peaks were observed at both of the spectra. When inspecting the typical absorbance of melamine, the first overtone region
with N-H stretches was the most distinctive, including the absorbance peaks at 1523 nm, which was visible in mixtures containing melamine (figure �2.a). This confirms other results obtained by Tang, Cai, Shi, &
Xu, 2016 [6] when quantifying melamine in different brands of milk powders using Near Infrared Spectroscopy.
Figure 2. The 2nd derivative (Savitzky-Golay filter using 2nd order polynomial and 9 points) of the adulterated Beef Protein powder (A) and adulterants spectra (B) acquired in the 1400–1630 nm region The most prominent absorbance peak for taurine
was centred at 1590 nm, which was also present in samples containing taurine (Figure 2.a). This is in accordance with studies conducted by Lukacs et al., (2018) regarding the absorbance of Taurine in NIR spectral range. Glycine, on the other hand, presented a broad band in the region 1590 nm-1630nm which contains the N-H stretches (first overtone). In the case of urea, the first overtone region with N-H stretches had the most distinctive peaks at 1475 and 1530 nm.
These findings are in agreement with the previous studies of [7]. The obtained results are quite informative regarding the typical peaks of adulterants and their effect on the original spectra of pure beef protein powder. However, for more conclusive results, the data was further evaluated by PCA.
Qualitative Data evaluation of the NIR spectroscopy results with PCA and LDA
Results of PCA analysis showed a pattern of separation of the different tested mixtures where the
samples containing individual adulterants (U, G, T, and M) were more distant from those containing a combination of the adulterants. Such pattern was also confirmed when each mixture was colored by adulteration level and the most notable separation was obtained for samples adulterated by UM mixture. The pattern is recognizable in the scores plot shown in Figure.3 where PC1 represent 56.76%, while PC2 40.81 % of the total variance and an increasing pattern of adulteration could be seen based on PC2. There is a clear separation between samples containing 3% (level 6) and 2.5% (level 5) of UM compared to the rest of adulteration levels.
However, what is most noteworthy is that NIRS was sensitive enough to separate even the lowest concentrations of 0.5% (level 1) and 1% (level 2) in PCA. This further confirms the efficiency of NIRS for the simultaneous detection of adulteration in protein-rich supplements. This is in agreement with what was reported by [8] .
However, the separation of the different adulteration levels by PCA was not as conclusive for
other studied mixtures where some overlapping of the different levels was observed. Further qualitative and quantitative modelling was thus performed to ensure
the adequacy of NIRS for the detection of Urea, Melamine, Taurine and Glycine.
Figure 3. PCA scores plot of UM adulterated beef protein powder on the MPA smoothed (Savitzky-Golay filter; 21 points) and MSC pretreated spectra in the wavelength range 1400-1630 nm
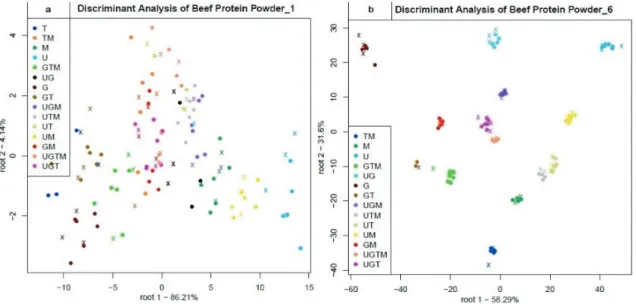
Figure 4. Results of LDA classification at level 1 (0.5%) (a) and level 6 (3%) (b) of Beef Protein Powder Results of LDA classification showed that, at the
lowest adulteration level corresponding to 0.5%, the model presented low accuracy and different mixtures were misclassified (Figure.4.a). The most distant points correspond to the samples adulterated with each of the individual adulterants. These are quite well separated as opposed to those containing a combination of adulterants. What is equally
noticeable is that samples containing amino acid adulterants such as Glycine (maroon) and Taurine (blue) or a combination like GT are close to each other while those containing adulterants of different nature like urea (light blue), melamine or a combination of these adulterants like UM (yellow) are far(Figure.4.b).
When the adulterated beef protein samples were subjected to LDA at the adulteration level 6 corresponding to 3% adulteration, the different mixtures were perfectly classified based on the root 1 and 2 presenting 89.89% of the between group
variance. The validation set (x) and training set (●) of each group of mixtures were perfectly fitted (figure.4.b). The different recognition and prediction performances at different levels are shown in Table 1.
Table 1. LDA recognition and prediction rates at different adulteration levels in 1400-1630nm range
It was observed that the accuracy of the applied method is dependent on the level of adulteration where a decrease of prediction rate from 100% to 70.87% when the adulteration level decreased is observable.
PLSR Prediction of beef protein powder adulteration:
The prediction accuracy depended on the tested adulterant and the best performances were obtained for the quantification of urea with coefficient of prediction (R²Pr) of 0.89 and Root mean squared error of prediction RMSEP of 0.39%. The
corresponding Y-Fit graph is illustrated in Figure.5 where test points are quite fitted to the training set points and concentrations as low as 1.5% were determined.
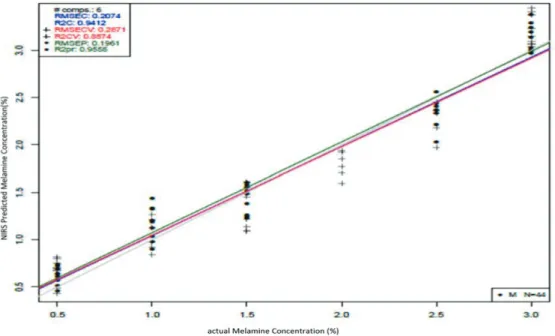
In case of melamine adulterated samples, the best predictive model was built using the raw spectra acquired in the region 1400-1630 nm by MPA. It was based on six latent variables and presented a coefficient of determination for the test set of 0.95 and an error of prediction (RMSEP) of 0.1961 %(
Figure.6) suggesting the efficiency of NIRS when it comes to determining the concentration of melamine in BPP.
Figure 5. Y-fit graph of the prediction of urea concentration in adulterated BPP samples In the case of adulterations with a combination of
adulterants, the prediction models were also good with coefficients of prediction ranging from 0.88 to 0.96 and errors of prediction from 0.22% to 0.84%.
What is notable is that the efficiency of predicting the
content of adulterants in mixtures containing adulterants of similar chemical structure such as Glycine and Taurine (GT) was lower than those containing adulterants of different nature such as Urea and Glycine (UG) or Glycine and Melamine (GM).
These findings further confirm the reported results of LDA where misclassification was more probable to occur when the adulterants were similar in nature which was also reflected in the between classes
distances. This also accentuates the importance of melamine and urea in conferring a certain recognizable pattern to adulterated samples when tested by PCA.
Figure 6. Y-fit graph of the prediction of melamine concentration in melamine adulterated samples Conclusions
The study confirmed the presence of an identifiable pattern among adulterated samples, mainly due to the presence of Melamine and Taurine. The results obtained by Principal Component Analysis (PCA) could separate adulterants with concentrations as low as 0.5%. These findings were confirmed by the qualitative analysis with Linear Discriminant Analysis (LDA) where different groups were identified with performances that depended both on the adulterants present (separately or in combination) and the level of adulteration. The samples with higher levels of adulteration (level 6) corresponding to higher concentration of adulterants (3%) were easily classified compared to those adulterated with relatively lower amounts (0.5%) with LDA prediction rates of 100% and 70.87% respectively. According to adulteration type, beef protein powder samples with similar chemical structure (amino-acidic structure in case of glycine and taurine) tended to belong to groups with minor between group variance leading to some misclassifications. Partial Least Squares Regression (PLSR) had prediction coefficients (R²Pr) ranging from 0.86 to 0.96 and errors of prediction from 0.2% to 1.01%. The results accentuate the efficiency of NIR spectroscopy as a rapid non- destructive analytical tool for the detection of Beef protein powder adulteration where levels
corresponding to a concentration of adulterant as low as 0.5% can be successfully identified, classified and quantified.
Acknowledgements
This paper was supported by the Doctoral School of Food Science, Szent István University. (Balkis Aouadi, John-Lewis Zinia Zaukuu) and by the Janos Bolyai Scholarship of the Hungarian Academy of Sciences and by the ÚNKP-19-3 (Zsanett Bodor) and ÚNKP-19-4 (Zoltán Kovacs) New National Excellence Program of the Ministry of Human Capacities. The Project is supported by the European Union and co-financed by the European Social Fund (grant agreement no. EFOP-3.6.3-VEKOP-16-2017- 00005.
References
[1] Abernethy, G., & Higgs, K. (2013). Rapid detection of economic adulterants in fresh milk by liquid chromatography–tandem mass spectrometry.
Journal of Chromatography A, 1288, 10–20.
https://doi.org/10.1016/j.chroma.2013.02.022.
[2] Finete, V. de L. M., Gouvêa, M. M., Marques, F. F. de C., & Netto, A. D. P.(2013). Is it possible to screen for milk or whey protein adulteration with melamine, urea and ammonium sulphate, combining
Kjeldahl and classical spectrophotometric methods?
Food Chemistry, 141(4), 3649–3655.
[3] Forchetti, D. A. P., & Poppi, R. J. (2017). Use of NIR hyperspectral imaging and multivariate curve resolution (MCR) for detection and quantification of adulterants in milk powder. LWT - Food Science and Technology, 76, 337–343.
https://doi.org/10.1016/J.LWT.2016.06.046
[4] Kalman, D.(2016). Understanding the Fitness vs Sports Nutrition Market, Corporate Conference WellNext (Champion Nutrition), Santa Cruz, CA, September 13, 2016. 10.13140/RG.2.2.30978.27848.
[5] Kovács, Z., Sipos, L., Szöllõsi, D., Kókai, Z., Székely, G., & Fekete, A. (2011). Electronic Tongue and Sensory Evaluation for Sensing Apple Juice Taste Attributes. Sensor Letters, 9(4), 1273–1281.
https://doi.org/10.1166/sl.2011.1687
[6] Tang, B.-C., Cai, C.-B., Shi, W., & Xu, L.
(2016). Rapid Quantification of Melamine in
Different Brands/Types of Milk Powders Using Standard Addition Net Analyte Signal and Near- Infrared Spectroscopy. Journal of Analytical Methods in Chemistry, 2016, 9256102.
https://doi.org/10.1155/2016/9256102
[7] Li, B., Martin, E., & Morris, J. (2017). Latent variable selection in partial least squares modelling.
IFAC Proceedings Volumes, 34(25), 463–468.
https://doi.org/10.1016/s1474-6670(17)33867-3 [8] Lukacs, M., Bazar, G., Pollner, B., Henn, R., Kirchler, C. G., Huck, C. W., & Kovacs, Z. (2018).
Near infrared spectroscopy as an alternative quick method for simultaneous detection of multiple adulterants in whey protein-based sports supplement.
Food Control, 94, 331–340.
https://doi.org/10.1016/j.foodcont.2018.07.004