Policy K Pritchard-Jones1, G Lewison2, S Camporesi3, G Vassal4, R Ladenstein5, Y Benoit6, JS Predojevic7, J Sterba8, J Stary8,
T Eckschlager8, H Schroeder9, F Doz10, U Creutzig11, T Klingebiel11, HV Kosmidis12, M Garami13, R Pieters14, A O’Meara15, G Dini16, R Riccardi17, J Rascon18, L Rageliene18, V Calvagna19, P Czauderna20, JR Kowalczyk21, MJ Gil-da-Costa22, L Norton23, F Pereira24, D Janic25, J Puskacova26, J Jazbec27, A Canete28, L Hjorth29, G Ljungman30, T Kutluk31, B Morland32, M Stevens33, D Walker34 and R Sullivan35
1University College London, UK, 2Evalumetrics UK and University College London, UK, 3Kings College London, UK, 4Institut Gustave-Roussy, Villejuif, France, 5St. Anna Children’s Hospital, Austria, 6Ghent University Hospital, Belgium, 7Children’s Hospital Banja Luka, Bosnia-Herzegovina, 8University Hospital Motol, Prague, Czech Republic, 9Aarhus University Hospital, Skejby, Denmark, 10Institut Curie, Paris, France, 11Society for Pediatric Oncology and Hematology (GPOH), Münster, Germany, 12Children’s Hospital ‘Aglaia Kyriajou’ Athens, Greece, 132nd Department of Paediatrics, Semmelweis University, Hungary, 14DCOG, The Netherlands, 15Lady’s Children Hospital, Crumlin, Ireland, 16Istituto G. Gaslini, Italy, 17Catholic University of the Sacred Heart, Rome, Italy, 18Vilnius University Children’s Hospital, Lithuania, 19Mater Dei Hospital, Msida, Malta, 20Medical University of Gdansk, Poland, 21Children’s University Hospital, Lublin, Poland, 22University Hospital S. João—Porto, Portugal, 23Instituto Português de Oncologia do Porto (IPO Porto), Portugal, 24Portuguese Institute of Oncology, Lisbon, Portugal, 25University of Belgrade, Serbia, 26Division of Pediatric Hemathology and Oncology, Slovakia, 27Children’s Hospital, University Medical Centre Ljubljana, Slovenia, 28H. U. La Fe Pediatric Oncology Unit, Spain, 29Paediatrics, Clinical Sciences Lund, Sweden, 30Paediatrics, Clinical Sciences Uppsala, Sweden, 31Hacettepe University, Turkey, 32Birmingham Children’s Hospital, UK, 33University of Bristol, UK, 34University of Nottingham, UK, 35Centre for Global OncoPolicy, Kings Health Partners Integrated Cancer Centre, London, UK
Correspondence to: R Sullivan, Centre for Global OncoPolicy, Kings Health Partners Integrated Cancer Centre, Section of Research Oncology, Bermondsey Wing, Guy’s Hospital, Great Maze Pond Road, London SE19RT, UK. Email: richard.sullivan@kcl.ac.uk
Abstract
Overcoming childhood cancers is critically dependent on the state of research. Understanding how, with whom and what the research community is doing with childhood cancers is essential for ensuring the evidence-based policies at national and European level to sup- port children, their families and researchers. As part of the European Union funded EUROCANCERCOMS project to study and integrate cancer communications across Europe, we have carried out new research into the state of research in childhood cancers. We are very grateful for all the support we have received from colleagues in the European paediatric oncology community, and in particular from Edel Fitzgerald and Samira Essiaf from the SIOP Europe office. This report and the evidence-based policies that arise from it come at a important junction for Europe and its Member States. They provide a timely reminder that research into childhood cancers is critical and needs sustainable long-term support.
Published: 09/02/2011 Received: 24/01/2011
ecancer 2011, 5:210 DOI: 10.3332/ecancer.2011.210
Copyright: © the authors; licensee ecancermedicalscience. This is an Open Access article distributed under the terms of the Creative Commons Attribution License (http://creativecommons.org/licenses/by/2.0), which permits unrestricted use, distribution, and reproduction in any medium, provided the original work is properly cited.
Policy
Executive summary and policy conclusions
1. Between the period 1997–2008, there were 31,144 research papers published by the global paediatric oncology community representing about 5% of all cancer research; the number rose rapidly during the Þ nal 3 years but was almost constant from 1997 to 2002. About one third are from the European Union (EU), one third from Canada and the USA, and one third from the Rest of the World (RoW). Paediatric oncology is a vibrant and growing research community which has delivered major advances across many childhood cancers in terms of survival and quality-of-life improvements.
2. Paediatric oncology papers are cited less (in a 5-year window) than the average for the journals in which they are published, although both actual and potential citation scores have been rising. The Netherlands’ papers are the most cited, followed by those of the USA, the UK and Sweden, and its papers are also the most likely to be in the top centiles of citation counts. The UK, the USA and Canada write the most reviews, a new measure of the esteem in which a country’s senior scientists are held.
Similar indicators were also determined for the leading research institutions in North America and Europe: the former’s were the most highly ranked, led by the Dana-Farber Cancer Institute in Boston and the US National Cancer Institute in Bethesda, MD.
The leading European centres were in the Netherlands (Amsterdam and Rotterdam), Germany (Munster), France (Inst. Gustave Roussy, Villejuif) and University College London.
3. Sweden and the Netherlands did the most basic paediatric oncology research (on average) but the differences between countries were not large. About 7% of the papers reported clinical trials; Switzerland did the most (almost 15% of its papers) and Spain and the USA, the least (among the countries selected for analysis). Advances in paediatric oncology depend on research activity and support across a wide spectrum of research domains from the most basic to applied. Constant assessment of this ‘balance’
and national and European levels is necessary to ensure no detrimental lacunae occur in the paediatric oncology research spectrum.
4. An analysis of countries’ and institutions’ willingness to collaborate internationally (expressed as a ratio of observed numbers of collaborative papers to those expected on the basis of countries’ percentage presence in the subject area) showed close collaboration, as expected, between Canada and the USA, but relatively little between North America and Europe. EU Member States were collaborating increasingly with each other, especially Germany and the Netherlands, and also Switzerland with France, Germany and Italy. Netherlands researchers are particularly sought after, perhaps because of their strong citation performance.
Researchers from the RoW are largely ignored by the Europeans, but less so by the USA and its leading institutions. There is a case to look further at how Europe and the USA can work together more effectively. Likewise the global burden in paediatric oncology is shifting towards ‘younger’ developing countries. There is an urgent need for greater research cooperation, that is not yet present, between developed and transitional countries.
5. The funding of paediatric oncology research in the 10 selected countries was determined by the examination of the Þ nancial acknowledgements on 2575 papers from 1997–2000 and 2005–8. Funders were classiÞ ed into Þ ve main sectors: national government and private-non-proÞ t (PNP), industrial, international and other (foreign). In most European countries except Spain, PNP sources out-numbered government ones, but almost half the papers bore no acknowledgement—a marker of fragile, short- term funding. The dominant role in the USA of the National Cancer Institute and other components of the National Institutes of Health was very apparent: they supported nearly half the US total. In Sweden, collecting charities and endowed foundations each funded over 40% of the research papers. Other nationally prominent funders were the Associazione Italiana per la Ricerca sul Cancro in Italy (25% of Italian papers), the Netherlands Cancer Society and Cancer Research UK (each just under 20% of national papers). The European Commission is playing an increasing role and funded about 7% of the papers from the seven selected EU Member States in 2005–8. The enhanced support of paediatric oncology research by the EU is a positive step forward, however, the perception is that this still remains inadequate for the scale of the problem. Furthermore, at national level funding is either too low or too fragile with signiÞ cant activity reliant on short-term ‘soft’ funding. National level funding needs to be more sustainable and coherent.
Policy 6. Estimates were made of the Þ nancial resources being applied to paediatric oncology research world-wide in 2008. Based on
estimates of the average cost of a paper and the number of publications, together with an analysis of the ‘hidden’ costs of the pharmaceutical industry not revealed in terms of published papers, it appears that the total was about $1.23 billion (US), of which an estimated 53% was from public/federal sources ($656 million), 27% from PNP sources ($328 million) and 20% ($245 million) from industry. The low level of funding in many countries coupled to the very small contribution by the private sector is a major concern. There is a strong case for a private global fund for paediatric oncology to be established, that could support transnational collaborative research efforts that are necessary in these rare diseases.
7. Information on childhood cancers varies considerably across Europe, factors that inß uence this aspect of care include:
•
involvement of parent organizations•
the use of digital media•
the adoption of a common standard for information provision.There is a need for new policy proposals to tackle this diversity of access to information which could include establishment of a European Common Information Portal in order to promote harmonization, enhanced control of information quality, standards of provision and linguis- tic access and the tackling of major deficiencies in countries with no patient organizations and/or native language information provision.
8. In the survey of key opinion leaders in paediatric oncology from across Europe a number of key policy areas were highlighted as MAJOR issues in ensuring the future of childhood cancer research and continuing improvements in survival. There was consensus on the need for
•
Adequate EU funding to support a Europe-wide clinical trials network to assist with testing and dissemination of novel therapies and techniques. ENCCA has been an important tool in delivering solutions in this area. However, this is short term and sustainable, long-term research networks must be created and funded.•
A reduction of EU trial bureaucracy/regulations to remove barriers to initiation and conduct of investigator-led clinical tri- als which could include a European Trials Bureau. Furthermore there needs to be a better understanding by regulatory policymakers of the level of risk for children with cancer participating in clinical trials (currently overestimated by insurers as well). It is essential that the EU Clinical Trials Directive (CTD) is modified if investigator-driven clinical trials are to have any future.•
The creation of a European Parent/Survivor organization to assist with enhancing quality of patient information for child- hood cancers.•
The creation of a European Childhood Cancer Epidemiological Registry (essential for outcomes research) and linked Biobank Facility to enhance awareness of childhood cancer incidence, support development of service provision and facilitate access to linked population data and tissue samples for research.•
EU support for enhanced harmonization of treatments through Pan-European Guidelines for treatment.1 Introduction
1.1 Origins of study
This report has been conducted under the auspices of the EUROCANCERCOMS project as a collaboration between SIOPE and Kings Health Partners Centre for Global OncoPolicy (ECRM Foundation).
Policy
1.2 Data to be presented
The original written specification called for the following tasks:
1. Development of a ‘Þ lter’ to identify papers in the Web of Science (WoS) database that are in both the subÞ elds of paediatrics and oncology.
2. Comparison of the outputs of Europe (with division by Member State), the USA and Canada, during the 11 years 1997–2007.
[This was subsequently amended to 2008 as data on this year became available.]
3. IdentiÞ cation of the leading research institutions in paediatric oncology in Europe, the USA and Canada.
4. Determination of the relative commitment of individual countries to paediatric oncology, compared with all oncology and with all biomedical research in the same years.
5. An analysis of the potential and actual citation impact (ACI) of the paediatric oncology papers (for different countries).
6. Comparison of papers describing phased clinical trials within the subject area to overall outputs in paediatric oncology.
7. Provision of a matrix showing the amount of collaboration between individual countries, and any changes over time.
8. Provision of a matrix showing the amount of collaboration between the leading research institutions with selected foreign countries.
9. Listing of the major funders of paediatric oncology research, with a breakdown by country and type (sector) of funding body, including industry.
10. Estimation of the relative amount of funding for paediatric oncology from public and private sources, the latter comprising both PNP and commercial.
1.3 Notes on the specification
This bibliometric study has been confined to documents classed as articles or reviews in the WoS, and to publication years 1997–2008.
The documents were to be identified within the intersection of two sets: oncology papers (for which there was already a filter, devised in consultation with Dr Lynne Davies of Cancer Research UK) and paediatric papers. The oncology subfield was defined as:
The study and treatment of cancer or tumours. This incorporates academic oncology and clinical oncology. Academic oncology is aimed at iden- tifying the causative agents or underlying genetic defects producing cancer and at developing these discoveries into effective drugs and other therapies. Clinical oncology is oriented towards the treatment, management and cure of cancer.
Papers in paediatrics, defined as:
Study of the causes, effects and treatments of disease or disability in infants and children were to be identified by means of a second filter, but this needed updating and extending to cover additional journals in the WoS but not in the Science Citation Index on CD-ROM for which the filter had originally been defined, and journals appearing later than 2005.
The geographical analysis has been conducted using both integer and fractional counts for countries in the addresses of the papers. [A paper with two UK addresses and one French one would count unity for each country on an integer count basis, but 0.67 and 0.33 respec- tively on a fractional count basis.] However, relative commitments for the individual countries have been determined using only integer counts as it was not practical to download all the world papers in oncology and biomedical research over 12 years in order to determine the values using fractional counts. For the analysis of research institutions, and of international collaboration, only fractional counts have been used, see section 2.6.
Policy Both potential and ACI have been determined as numbers of citations in a 5-year period beginning with the year of publication. Mean cita- tion scores for papers in the journals used (potential citation impact—PCI) were obtained from Thomson Reuters, the publishers of the WoS for every 2 years from 1996–2002; for 2004 they were obtained directly from the WoS1. Actual citation scores for individual papers were obtained from the WoS, but only up to 2004 publications (cited in 2004–8). An additional indicator of research quality was obtained from the numbers (and percentages) of papers from each country that were cited highly enough to be in the top centiles: this is called the
‘world-scale’ value. Finally, another indicator of merit was provided by the percentages of reviews for each country. This is a new indicator and aims to show the esteem in which senior researchers are held by journal editors who commission the reviews.
2 Methodology
2.1 Selection of papers
The papers were selected from the WoS that were in both subfields, paediatrics (PAEDI) and oncology (ONCOL). The filters used to define these two subfields are given in Annex A, where SO is the journal name and TI is a word in the title of the papers. The bibliographic details of the selected papers were downloaded to a series of individual files, each of which contained 500 papers. They were opened in succession by a macro written by Philip Roe and the papers’ parameters (authors, title, source, document type and addresses) were collected in an Excel file for analysis. This file contained data on a total of 31,144 papers.
For the comparison groups of papers in cancer research overall and in all biomedicine (BIOMED), the WoS was interrogated and the world totals and those for each of the ten selected countries (see Table 1) were determined, year by year. The biomedical papers were specified by means of an ‘address’ filter, based on cognitive words in the papers’ addresses [1,2]: this works well in distinguishing between biomedi- cal and non-biomedical papers in multidisciplinary journals such as Nature and Science. Details are given in Annex A.
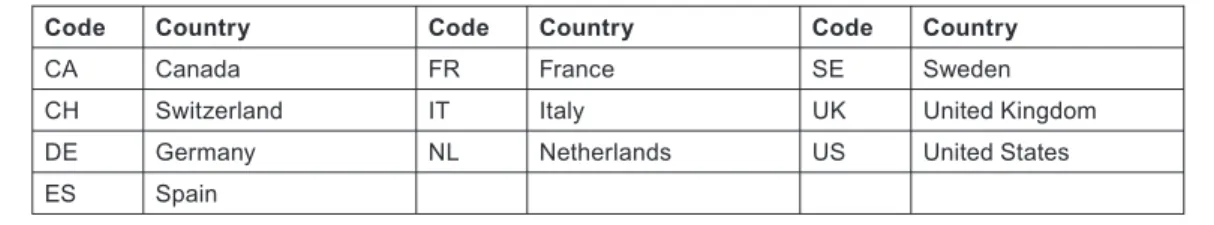
In this report, the countries are referred to by their ISO digraph codes, as shown in Table 1. In addition the output of the other 20 EU Member States as a group (EU20) was determined and used in the analysis as was that of the RoW.
2.2 Identification of the leading research institutions
The intention here was to find the institutions in each of the selected countries with the largest outputs over the 12-year period, based on fractional counts. This was made difficult because many institutions had alternative names, particularly universities and associated hos- pitals. For the USA, there were 188 different organizations listed on a special Website, for Canada, 16 on the same Website, and for the eight European countries, a total of 98 places with output >100 papers. These latter were selected as the outputs of cities unless it was
1 For 2004 papers, the values for each journal were obtained by division of the numbers of citations to articles and reviews only by the number of such papers; for earlier years the numerator also included a small number of citations to other document types. This discrepancy has led to some criticism in the literature.
Code Country Code Country Code Country
CA Canada FR France SE Sweden
CH Switzerland IT Italy UK United Kingdom
DE Germany NL Netherlands US United States
ES Spain
Table 1: Ten countries used for analysis in this study, with their ISO codes
Policy
clear that there were several separate institutions within the same city. The intention was not to determine the outputs of all these places, but rather of the top ones in the USA, in Canada and in Europe. Each of the 188 + 16 + 98 organizations or places were given an individual trigraph (three-letter) code, of which the first two letters were the abbreviation for the US state, Canadian province or European country.
Each one was sought among the addresses on each paper using search strings chosen to include the name variants of the organization or place; one string (the name of the city and state/province/country) was required together with one or more of any others that were speci- fied. For some European cities, ‘no’ strings were also specified in order to distinguish the outputs of two (or more) different institutions, e.g. in Amsterdam and Milan (two universities). Some examples of search strings are shown in Table 2 for the USA and Canada, and in Table 3 for European countries.
For the UK, the Institute of Cancer Research’s output could be specified with the presence of the town, ‘SUTTON’ and ‘ENGLAND’
(there is also one in Canada); for Queen Mary, University of London, which includes the Royal London Hospital and St Bartholomew’s Hospital, the search was for ‘LONDON’ and ‘ENGLAND’ and either BART or LONDON?HOSP (the ? indicates a single character) or QUEEN?MARY. For the output of University College London, eight possible strings were needed in addition to LONDON and ENGLAND.
Institution or city Code Main string Zip Search string 2
Baptist Children’s Hospital FLB MIAMI, FL 33176 BAPTIST
Miami Children’s Hospital FLM MIAMI, FL 33155 MIAMI-CHILD
Children’s Hospital Oakland CAO OAKLAND, CA 94609 CHILD
Stanford University Medical Ctr CAP PALO-ALTO, CA 95798 STANFORD
Alberta Children’s Hospital ABC CALGARY, AB T3B 6A8 CHILD
Kingston General Hospital ONK KINGSTON, ON K7L 2V7 GEN-HOSP
Saskatoon Cancer Center SKS SASKATOON, SK S7N 4H4 CANC
Table 2: Examples of research institutions (in USA and Canada) whose research outputs in paediatric oncology were sought by means of special search strings. For each institution, the main string (city and state/province) had to be present, plus either the zip or search string 2 (some institutions had additional search strings)
Country City Code Search string 2 Search string 3 ‘No’ strings
France LYON FRB BERARD
France PARIS FRC INST?CURIE
France PARIS FRD DEBRE
Germany DRESDEN DEA
Germany BERLIN DEB HUMBOLDT CHARITE
Italy BARI ITA
Italy BOLOGNA ITB RIZZOLI
Netherlands AMSTERDAM NLA ACAD?MED EMMA FREE, VRIJE, VU-
Netherlands AMSTERDAM NLV FREE VRIJE
UK SUTTON UKA
UK LONDON UKE LONDON?HOSP BART
Table 3: Examples of some leading cities in European countries whose paediatric oncology research outputs were sought. The city name (and country) had to be present, plus one or more of the extra search strings (if more than one institution in the city). For some institutions, the presence of a ‘no’ string would nullify the match
Policy
2.3 Determination of relative commitment to paediatric oncology
This parameter is the ratio of a country’s percentage presence in paediatric oncology to its percentage presence in all oncology, or in biomedical research. In order to keep the amount of data to a reasonable level, these ratios were calculated for three 4-year periods, 1997–2000, 2001–4 and 2005–8. For example, in 2005–8, the UK published 934 paediatric oncology papers out of a world total of 12,203 or 7.65%, whereas in cancer research as a whole it published 15,616 out of 214,053 or 7.29%. Therefore its relative commitment (RC) was 7.65/7.29 = 1.05.
2.4 Potential and ACI
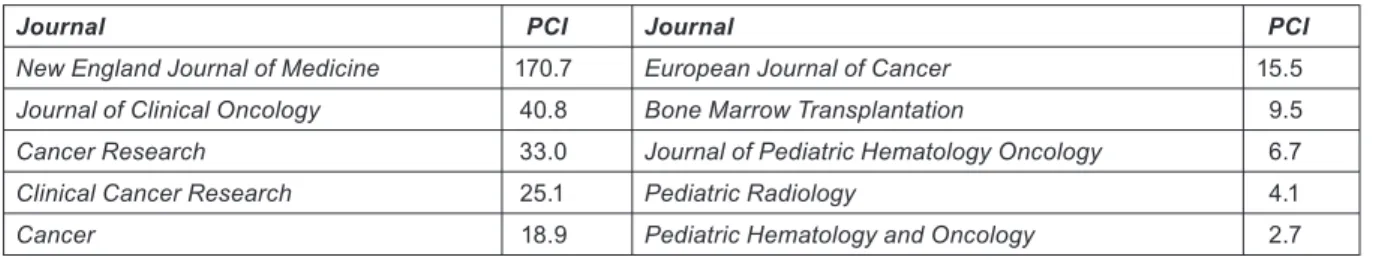
Journals can be characterized by the average number of citations to papers published in them in a given year and received in a given time window. Because the peak year for citations is usually the second or third year after publication, we have taken a 5-year window (i.e. the year of publication and four subsequent years). The PCI of a paper is then the expected number of citations that it would receive if it were an ‘average’ paper, i.e. the total number of citations divided by the number of papers (Table 4).
The ACI was determined directly from the WoS, with data for citations, year by year, being downloaded 500 at a time to separate files.
These were processed by another macro written by Philip Roe so as to provide a single spreadsheet, with re-creation of the bibliographic source (journal, year, volume, issue, pages) for each paper that could then be matched to the source in the main file of papers. The num- bers of citations in the 5-year window could then be copied across to the main file for each paper. However, for a few papers, the source was not unique (this applied particularly to the new all-electronic journals) and a match had to be made on the paper title. Because a 5-year window was used, the values of ACI were only available for papers published from 1997–2004 (8 years).
We also determined how many of a country’s papers were cited highly enough to put them in the top 5% of the world (31 cites in 5 years), top 10% (21 cites) or top 20% (12 cites). These three percentages, when compared with the world values2, multiplied by 100 and averaged, are called ‘world-scale’ values (by analogy with oil tanker charter rates) [3].
Another measure of merit, or esteem, is the percentage of reviews in a large set of papers. Since these are usually invited from distin- guished scientists, their presence does provide an additional measure of how well these are regarded by the editors of journals [4]. This measure needs to be normalized relative to the world mean value and this can be done with respect to both paediatric and to all cancer research. The ratios show how well senior paediatric oncology researchers from different countries were regarded and they can also be compared with the esteem of their oncology researchers overall.
2 These are usually slightly above the nominal values as the actual number of world papers with the given number of citations normally exceeds the required number.
Journal PCI Journal PCI
New England Journal of Medicine 170.7 European Journal of Cancer 15.5
Journal of Clinical Oncology 40.8 Bone Marrow Transplantation 9.5
Cancer Research 33.0 Journal of Pediatric Hematology Oncology 6.7
Clinical Cancer Research 25.1 Pediatric Radiology 4.1
Cancer 18.9 Pediatric Hematology and Oncology 2.7
Table 4: Examples of potential citation impact values (C0–4) for some journals commonly used for paediatric oncology papers, published in 2004 and cited 2004–8
Policy
2.5 Types of research: clinical or basic, and phased clinical trials
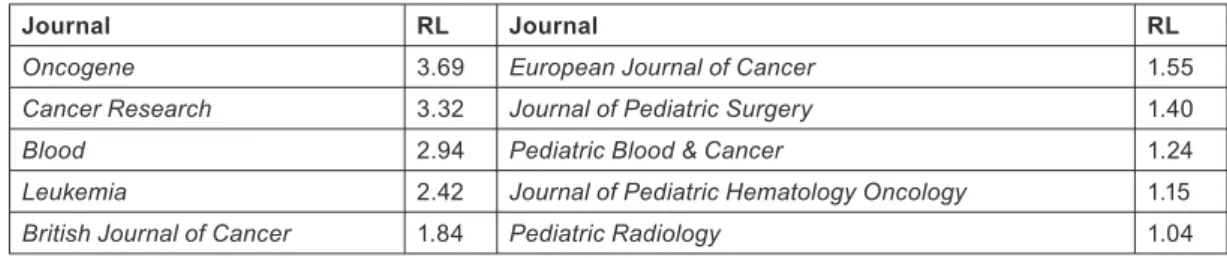
Biomedical research papers can be classified on a scale from 1 = clinical to 4 = basic, both in terms of the journal in which they are pub- lished (RLj), and (for a group of, say, 20 or more) in terms of their individual titles (RLp). The classification system described in reference 2 was used to characterize them (Table 5).
A special macro was used to classify all the paper titles in the file as containing either one or more ‘clinical’ words, or one or more ‘basic’
words, or both. For a group of papers, the mean RL was then calculated, with each paper with a clinical title word being counted only as 1.0, each paper with a basic title word only as 4.0, and each paper with both as 2.5. [However, about 14% of the papers could not be clas- sified in this way.] This showed whether papers from a given country were being published in relatively clinical or relatively basic journals, compared with their subject matter. It could also show if the papers were becoming more clinical or more basic with time.
In order to identify papers concerned with clinical trials, their titles were filtered to show which ones contained any of the words, ‘double blind’, ‘phase’, ‘study’ or ‘trial’3. The total was 2307, or 7.2% of the total. These papers were then analysed by country and by year, to show any time trends. Relatively few of these papers contained the word ‘phase’, which is associated with the clinical trials of new drugs.
2.6 International collaboration for countries and institutions
It is well known that the amount of international collaboration in research has been steadily increasing with time, and it is also more com- mon in basic research than in clinical work. Thus for the UK papers in paediatric oncology, 32% of those with RLj < 1.5 had foreign co- authors, but the percentage rose to 37% for RLj between 1.5 and 2.0, 46% for RLj between 2.0 and 3.0 and as much as 61% where RLj exceeded 3.0. Any comparisons of rates of international collaboration must therefore take account of both time and RL, as well as national factors such as possession of a common language or geographical proximity.
The standard method of presentation of collaboration data is with the Salton Index (SI), equal to the number of papers co-authored by the two entities divided by the square root of the product of the two individual totals. This is non-dimensional, and is usually expressed as a percent- age. However it is unsatisfactory because the index depends on the size of the geographical entities and can give misleading results if they are very different. Instead, we have determined the amount of collaboration by a different method, illustrated by means of an example.
From the point of view of a given country, say Canada, its papers have a foreign contribution divided up between other countries on a fractional count basis, with each country providing a certain percentage of the total. Thus the 1556 Canadian papers in paediatric oncol- ogy had a fractional Canadian contribution of 1086 papers and a foreign contribution of 470 papers. Of these, the USA contributed 305 and Germany 21 papers, both on a fractional count basis, i.e. 64.9% and 4.5% of the foreign total. But the USA’s fractional contribution to paediatric oncology was 31.0% and Germany’s was 7.4%, and if we correct these figures to exclude Canadian papers from the world
3 Care was taken to avoid titles with words such as “endometrial”, “atrial” and “terrestrial”.
Journal RL Journal RL
Oncogene 3.69 European Journal of Cancer 1.55
Cancer Research 3.32 Journal of Pediatric Surgery 1.40
Blood 2.94 Pediatric Blood & Cancer 1.24
Leukemia 2.42 Journal of Pediatric Hematology Oncology 1.15
British Journal of Cancer 1.84 Pediatric Radiology 1.04
Table 5: Examples of research levels (RLj; 1 = clinical, 4 = basic) for some journals commonly used for paediatric oncology papers published in 2000–5
Policy total, they increase slightly to 32.1% and 7.7%, So the USA was over-selected by Canadian researchers by a factor of 64.9/32.1 = 2.02 and Germany was under-selected as a partner by 4.5/7.7 = 0.58. On the basis of the two countries’ presence in world paediatric research minus that of Canada, we would have expected 151 US papers and 36 German ones. The difference for the US contribution is highly statistically significant; for the German contribution it is significant at p = 1%.
A rather similar approach was used for the calculation of the tendency of individual research institutions to collaborate with foreign coun- tries. Their presence was determined in each paper on a fractional count basis, and for the selected institutions (the ones with the largest output in the USA, Canada and Europe) we calculated the contribution made by other institutions in their own country, and by the other nine selected countries, EU20 and the RoW. These percentages could then be compared with their respective presences in paediatric oncology. An allowance was made for the contribution of the institution being considered even though such a correction was very small.
The calculations were made by a special macro, written by Philip Roe, which ran for over 9 minutes and analysed the 102,922 addresses on the 30,944 records with addresses.
2.7 The funding of paediatric oncology research
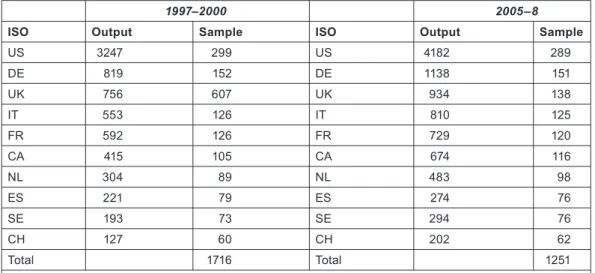
The purpose of this part of the study was two-fold: to show which organizations were funding the research, and to estimate the resources being devoted to the subject area. For the first task, samples of papers from each of the ten selected countries in each of the two 4-year periods, 1997–2000 and 2005–8, were looked up in the British Library and other London libraries, either online or by inspection of the printed documents. The sample sizes were proportional to the square root of the numbers of papers, with a minimum of 60, see Table 6, except for the UK in 1997–2000 for which funding data had previously been obtained as part of the Research Outputs Database [5], a project of The Wellcome Trust from 1993–2003. The sample sizes were designed to give a total of 1250 papers in each of the two quadrennia.
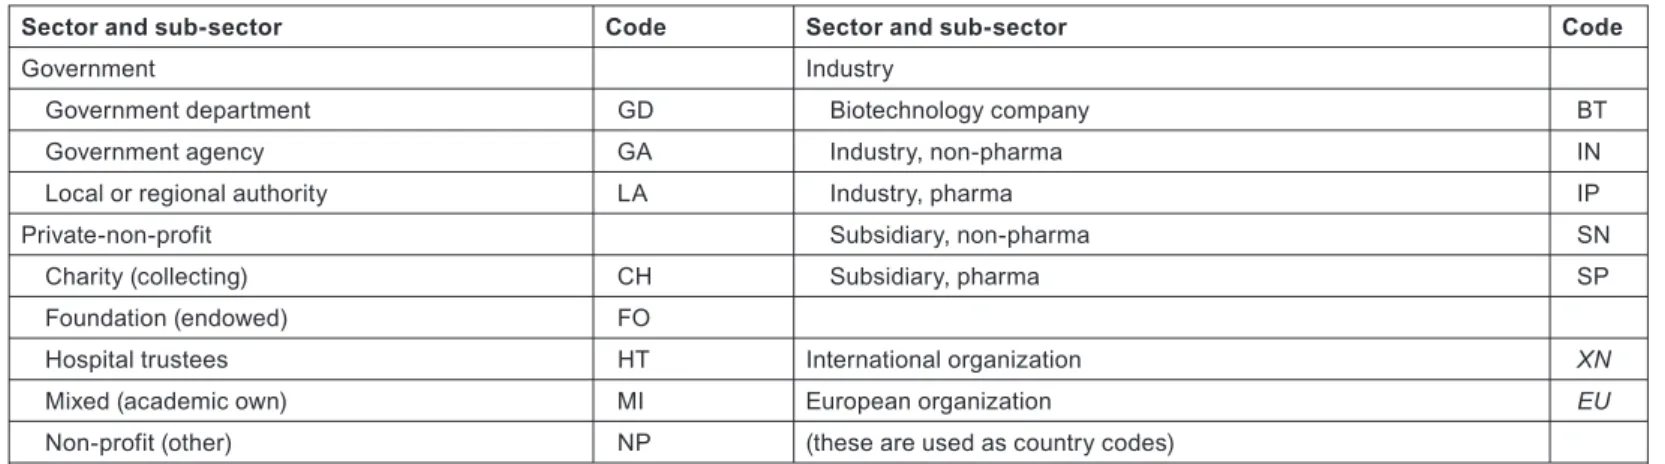
The funding bodies acknowledged, either explicitly or implicitly through the addresses on the papers, were recorded as three codes: one (a trigraph) for the individual funding body, e.g. MRC = Medical Research Council, NCI = (US) National Cancer Institute; the second, the ISO digraph country code; and the third, another digraph denoting the sector and sub-sector of the funding body, as shown in Table 7.
1997–2000 2005–8
ISO Output Sample ISO Output Sample
US 3247 299 US 4182 289
DE 819 152 DE 1138 151
UK 756 607 UK 934 138
IT 553 126 IT 810 125
FR 592 126 FR 729 120
CA 415 105 CA 674 116
NL 304 89 NL 483 98
ES 221 79 ES 274 76
SE 193 73 SE 294 76
CH 127 60 CH 202 62
Total 1716 Total 1251
Note: UK sample for 1997–2000 would have been only 142 but 607 papers had been looked up already.
CH sample would have been 58 but was increased to the minimum of 60.
Table 6: Sample sizes for the ten selected countries for the look-up of papers to determine funding acknowledgements in 1997–2000 and 2005–8
Policy
Implicit funding, derived from addresses, is assumed for government agencies, collecting charities and industry, but not usually for foun- dations, which often give their name to buildings but do not necessarily fund the research.
It is to be expected that a large minority of the papers will not have any funding acknowledgements, either explicit or implicit. Most such research will in practice have been supported, at least in Europe and in Canada, by state-funded universities and hospitals, but these are not specifically credited unless there is an explicit acknowledgement indicating that there was a formal decision to support the research.
We have developed a methodology [6,7] for the estimation of the global resources being applied to biomedical research in a given area, based on bibliometric data. This involves an estimate of the average cost of a paper, which is then multiplied by the number of papers published in a year. Corrections are needed for the additional (hidden) costs incurred by pharmaceutical companies in the support of confidential research that is not published, and some smaller adjustments may be needed to allow for the varying costs of research in
Sector and sub-sector Code Sector and sub-sector Code
Government Industry
Government department GD Biotechnology company BT
Government agency GA Industry, non-pharma IN
Local or regional authority LA Industry, pharma IP
Private-non-profit Subsidiary, non-pharma SN
Charity (collecting) CH Subsidiary, pharma SP
Foundation (endowed) FO
Hospital trustees HT International organization XN
Mixed (academic own) MI European organization EU
Non-profit (other) NP (these are used as country codes)
Note: Other non-profit funders are PNP bodies not primarily supporting research, e.g. professional associations, trade groupings. LA denotes US states, Canadian provinces, German Länder, etc.
Table 7: List of codes for sectors and sub-sectors for the funders of paediatric oncology research
Figure 1: Estimates of global expenditure on health research, 1992–2005, extrapolated to 2008 (constant 2008 USD). GOV = public sector; PNP
= private-non-profit; INDY = commercial 0 20 40 60 80 100 120
1990 1995 2000 2005 2010
Year
USD billion (constant 2008)
INDY GOV PNP
Policy different countries. Triangulation is possible with reference to the global total resources being applied to health research, as estimated by the Global Forum for Health Research; see Figure 1.
The estimated total expenditure for 2008 is about $110 billion from industry, $90 billion from the public sector (including international sources, which derive largely from governments), and just over $20 billion from the PNP sector, total about $220 billion. In that year, the WoS recorded close to 480,000 biomedical research papers (articles and reviews), making the mean cost per paper about $460,000. But much of the commercial expenditure would not have resulted in publications, and in practice only about 15% of the output was supported by industry, leaving about 410,000 papers supported by $110 billion of public and PNP funds, at a mean cost of $268,000. [This corre- sponds to $221,000 in 2001, close to4 the estimated cost of a cancer paper in that year, based on a survey of researchers, of $232,0006.]
For 2008, it is probably fair to assume an average cost for paediatric oncology papers of about $280,000. To this cost should be added the ‘hidden’ costs borne by pharmaceutical companies, discussed in more detail in section 3.10.
3 Results
3.1 Outputs of papers in paediatric oncology
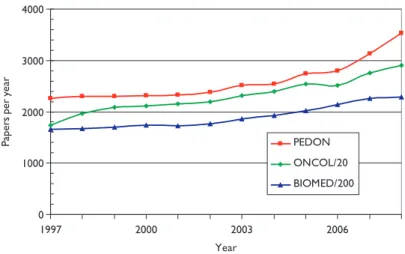
Figure 2 shows the numbers of papers in paediatric oncology (PEDON), year by year, over the 12-year period, with for comparison (scaled) values for oncology overall (ONCOL) and for biomedical and health research (BIOMED).
Paediatric oncology represents just over 5% of all oncology research papers, which themselves account for 12% of all biomedical and health research during the period, and although the output was rather constant in the late 1990s, it has grown quite rapidly in the last 2 years.
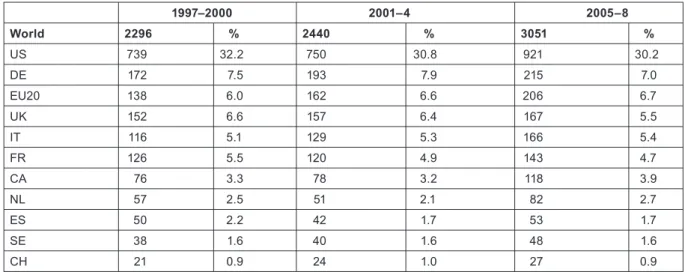
The outputs of individual countries are shown in Table 8 on a fractional count basis for the three 4-year periods. Although most countries have increased their absolute level of output, for most their percentage presence in the world total has decreased, because of the rapid rise in output from China and some other Far East countries. Overall, about one third of world output comes from the EU, one third from the USA and Canada, and one third from the RoW, see Figure 3.
4 The figure is lower because very little cancer research is carried out in low-income countries.
Figure 2: Outputs of papers (articles + reviews) in the Web of Science, 1997–2008 (publication years), for paediatric oncology (PEDON), oncol- ogy (/20) and biomedical and health research (/200).
0 1000 2000 3000 4000
1997 2000 2003 2006
Year
Papers per year
PEDON ONCOL/20 BIOMED/200
Policy
The relative commitment of the selected countries to paediatric oncology, compared with their presence in oncology research, is shown in chart form in Figure 4. Perhaps surprisingly, this is below unity for all the selected countries—this means that it must be above unity for countries in the RoW, mostly middle-income developing countries with a large youthful population. For example, Turkey had a RC of over 3, and both India and Brazil had RCs over 1.5, during the last 2 years. Within Europe, Switzerland has much the lowest RC, followed by Spain, whose RC has reduced sharply over the study period.
3.2 Leading research institutions in selected countries
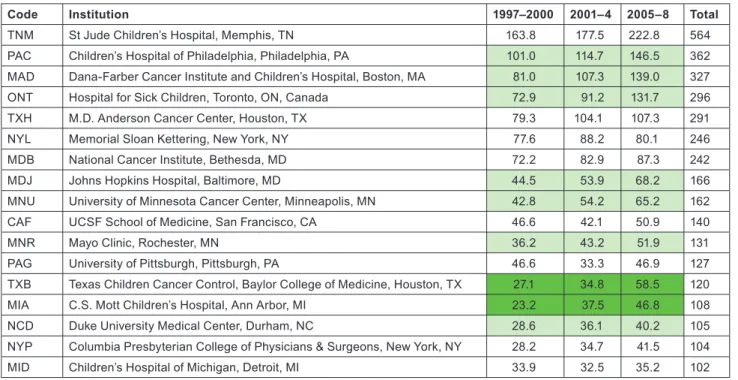
Application of the special macro (see section 2.2) to the set of addresses given, for each paper, the fractional count of each of the named institutions or (for Europe) the cities or universities selected for analysis. There were 16 US institutions with a fractional count of at least 100 papers over the 12-year period, and one Canadian one (the Hospital for Sick Children in Toronto); Table 9 lists them in descending order of output. In the eight selected European countries, there were 20 cities or universities that had at least 100 papers, and they are
1997–2000 2001–4 2005–8
World 2296 % 2440 % 3051 %
US 739 32.2 750 30.8 921 30.2
DE 172 7.5 193 7.9 215 7.0
EU20 138 6.0 162 6.6 206 6.7
UK 152 6.6 157 6.4 167 5.5
IT 116 5.1 129 5.3 166 5.4
FR 126 5.5 120 4.9 143 4.7
CA 76 3.3 78 3.2 118 3.9
NL 57 2.5 51 2.1 82 2.7
ES 50 2.2 42 1.7 53 1.7
SE 38 1.6 40 1.6 48 1.6
CH 21 0.9 24 1.0 27 0.9
Table 8: Annual outputs of paediatric oncology papers (articles and reviews, fractional counts) from selected countries and the other 20 EU Member States, 1997–2008
Figure 3: Outputs of paediatric oncology papers from three world regions, 3-year running means, fractional counts (frac ct) expressed as percentages of world total.
0 20 40 60 80 100
1998 1999 2000 2001 2002 2003 2004 2005 2006 2007
Percent of world papers (frac ct)
RoW
CA+US
EU27
Policy
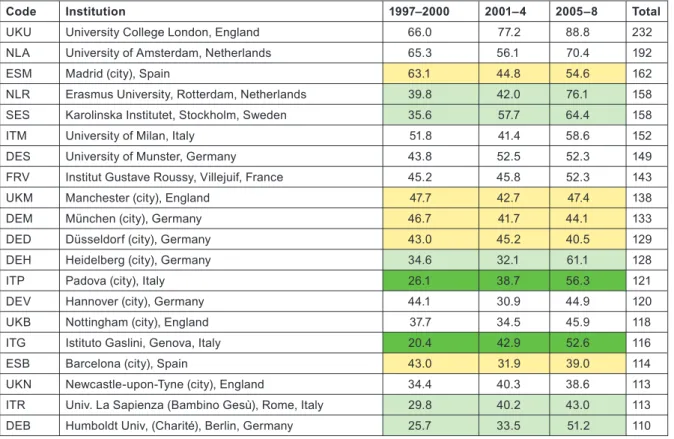
listed in Table 10. The two tables show by tinting those institutions or cities that more than doubled their output between 1997–2000 and 2005–8 (bright green), those that increased output by a factor of 1.41 (light green), and those whose output actually went down (yellow).
Although more European cities/universities/institutes met the 100 paper criterion for inclusion in the list than North American institu- tions, the leading European centre (University College London, which incorporates the Institute of Child Health and Great Ormond Street Hospital) would only rank eighth on the North American list, and the leading US institution, St Jude’s Children’s Hospital in Memphis, TN, has more than twice University College London’s output of paediatric oncology papers. Several European cities have actually reduced their output between 1997–2000 and 2005–8, including two each in Germany and Spain. The reduction in Spanish output from 1997–
2000 was seen in Table 8 and also in Figure 4.
0 0.2 0.4 0.6 0.8 1 1.2
CA US FR DE IT UK EU20 ES NL SE CH
Relative commitment
97–00 01–04 05–08
Figure 4: Relative commitment of 10 selected countries to paediatric oncology research within oncology, 1997–2008 (articles + reviews in the WoS).
Code Institution 1997–2000 2001–4 2005–8 Total
TNM St Jude Children’s Hospital, Memphis, TN 163.8 177.5 222.8 564
PAC Children’s Hospital of Philadelphia, Philadelphia, PA 101.0 114.7 146.5 362 MAD Dana-Farber Cancer Institute and Children’s Hospital, Boston, MA 81.0 107.3 139.0 327
ONT Hospital for Sick Children, Toronto, ON, Canada 72.9 91.2 131.7 296
TXH M.D. Anderson Cancer Center, Houston, TX 79.3 104.1 107.3 291
NYL Memorial Sloan Kettering, New York, NY 77.6 88.2 80.1 246
MDB National Cancer Institute, Bethesda, MD 72.2 82.9 87.3 242
MDJ Johns Hopkins Hospital, Baltimore, MD 44.5 53.9 68.2 166
MNU University of Minnesota Cancer Center, Minneapolis, MN 42.8 54.2 65.2 162
CAF UCSF School of Medicine, San Francisco, CA 46.6 42.1 50.9 140
MNR Mayo Clinic, Rochester, MN 36.2 43.2 51.9 131
PAG University of Pittsburgh, Pittsburgh, PA 46.6 33.3 46.9 127
TXB Texas Children Cancer Control, Baylor College of Medicine, Houston, TX 27.1 34.8 58.5 120
MIA C.S. Mott Children’s Hospital, Ann Arbor, MI 23.2 37.5 46.8 108
NCD Duke University Medical Center, Durham, NC 28.6 36.1 40.2 105
NYP Columbia Presbyterian College of Physicians & Surgeons, New York, NY 28.2 34.7 41.5 104
MID Children’s Hospital of Michigan, Detroit, MI 33.9 32.5 35.2 102
Table 9: North American institutions publishing at least 100 papers (fractional count) in paediatric oncology, 1997–2008
Policy
3.3 Potential and ACI
Over the 12-year period of the study, there has been a tendency for the mean citation scores of papers to increase. Figure 5 shows this effect for both PCI scores and those for ACI; it is also apparent that the latter are uniformly lower than the former, showing that paediatric oncology papers receive fewer citations than the average for the journals in which they are published. [This is not the case for cancer papers in general.] There are differences between countries in terms of the mean values of these indicators, see Figure 6, where mean ACI is shown for the selected nations on both an integer and a fractional count basis. The latter is always lower than the former, especially for small countries, many of whose papers will be internationally co-authored. All the selected countries except for Spain perform better than the world average, which is reduced by the low citation scores achieved by papers from the RoW.
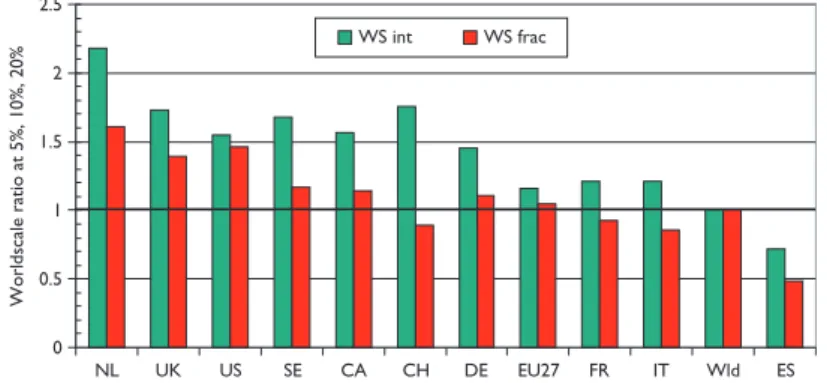
Figure 7, which shows mean world-scale values, tells a rather similar story to that of Figure 6, with the Netherlands again scoring best, followed by the UK and the USA, and Spain again scoring the least.
Another measure of esteem is the percentage of reviews that countries write. In Figure 8 the percentages relative to the world mean have been shown both for paediatric oncology and for all cancer in the same years. The world mean percentage for paediatric oncology was 5% up to 2002, and then rose almost linearly to 8% in 2007–8; this was somewhat lower than the corresponding figures for all cancer research, Figure 9.
Code Institution 1997–2000 2001–4 2005–8 Total
UKU University College London, England 66.0 77.2 88.8 232
NLA University of Amsterdam, Netherlands 65.3 56.1 70.4 192
ESM Madrid (city), Spain 63.1 44.8 54.6 162
NLR Erasmus University, Rotterdam, Netherlands 39.8 42.0 76.1 158
SES Karolinska Institutet, Stockholm, Sweden 35.6 57.7 64.4 158
ITM University of Milan, Italy 51.8 41.4 58.6 152
DES University of Munster, Germany 43.8 52.5 52.3 149
FRV Institut Gustave Roussy, Villejuif, France 45.2 45.8 52.3 143
UKM Manchester (city), England 47.7 42.7 47.4 138
DEM München (city), Germany 46.7 41.7 44.1 133
DED Düsseldorf (city), Germany 43.0 45.2 40.5 129
DEH Heidelberg (city), Germany 34.6 32.1 61.1 128
ITP Padova (city), Italy 26.1 38.7 56.3 121
DEV Hannover (city), Germany 44.1 30.9 44.9 120
UKB Nottingham (city), England 37.7 34.5 45.9 118
ITG Istituto Gaslini, Genova, Italy 20.4 42.9 52.6 116
ESB Barcelona (city), Spain 43.0 31.9 39.0 114
UKN Newcastle-upon-Tyne (city), England 34.4 40.3 38.6 113
ITR Univ. La Sapienza (Bambino Gesù), Rome, Italy 29.8 40.2 43.0 113
DEB Humboldt Univ, (Charité), Berlin, Germany 25.7 33.5 51.2 110
Table 10: European cities, universities and institutes publishing at least 100 papers (fractional count) in paediatric oncology, 1997–2008
Policy
0 5 10 15
1998 1999 2000 2001 2002 2003 2004
Mean 5-years cite score
ACI mean PCI mean
Figure 5: Mean potential citation impact (PCI) and actual citation impact (ACI) scores for paediatric oncology papers, 1997–2005 (3-year run- ning means); citation window 5 years.
0 2 4 6 8 10 12 14 16
NL US UK SE CA DE FR EU27 IT CH Wld ES RoW
Cites per paper (5 years)
ACI int ACI fr
Figure 6: Mean value of actual citation impact (ACI) for paediatric oncology papers from selected nations, 1997–2004, on an integer count basis (green bars) and fractional count basis (red bars).
0 0.5 1 1.5 2 2.5
NL UK US SE CA CH DE EU27 FR IT Wld ES
Worldscale ratio at 5%, 10%, 20%
WS int WS frac
Figure 7: Mean world-scale values for papers in the top-cited 5% (with 31 cites in 5 years), 10% (21 cites) and 20% (12 cites) of paediatric oncol- ogy papers, 1997–2004, from selected countries.
Policy
0 0.5 1 1.5 2
UK US CA NL FR IT Wld DE ES CH EU20 SE
Ratio of % reviews to world average PEDON ONCOL
Figure 8: Percentages of reviews for selected countries, 1997–2008, relative to the world mean, in paediatric oncology papers (PEDON) and in all cancer research (ONCOL).
0 2 4 6 8 10 12
1998 2000 2002 2004 2006
Percentage of reviews
ONCOL PEDON
Figure 9: World mean percentage of reviews (of total of articles and reviews) in paediatric oncology papers (PEDON) and all cancer research (ONCOL), 1997–2008, 3-year running means.
3.4 Citation scores and percentage of reviews for institutions
For each of the institutions with more than 100 papers (on a fractional count basis) listed in Tables 9 and 10, three measures of impact or esteem were determined and the institutions are listed in descending order of mean ‘quality’ of output, shown as ratios to the world mean in Tables 11 (for North America) and 12 (for Europe). The cells are tinted to show those with values > 2.0 (bright green), > 1.41 (pale green),
< 0.71 (pale yellow) and < 0.5 (pink) (Table 11).
Six of the US institutions, and one European university, have actual citation scores more than twice the world average. All the US institu- tions wrote more reviews than the world average, but 11 of the 20 European cities/universities wrote fewer, possibly because of language bias. However the relatively poor showing of the Karolinska Institutet on this measure is rather surprising, particularly as it scores well on the two citation measures (Table 12).
3.5 Research level and participation in clinical trials
Figure 10 shows the variation in research level (RL) with time based on both the actual titles of the paediatric oncology papers and the journals in which they were published. It is immediately apparent that the papers are much more clinical than the journals in which they appear, so that the researchers are clearly aiming at a more general readership, and also to publish in higher impact journals than their titles would suggest, perhaps because more basic journals normally receive more citations than do clinical ones. This is consistent with
Policy
Code Institution % rev/W PCI/W ACI/W
MAD Dana-Farber Cancer Institute and Children Hospital, Boston 1.88 2.02 2.76
MDB National Cancer Institute, Bethesda 1.71 1.94 2.45
NYP Columbia Presbyterian College of Physicians & Surgeons, New York 1.97 1.48 2.53
MNU University of Minnesota Cancer Center, Minneapolis 1.64 1.80 2.23
CAF UCSF School of Medicine, San Francisco 1.67 1.67 2.18
MNR Mayo Clinic, Rochester 1.31 1.66 2.27
TXH M.D. Anderson Cancer Control, Houston 1.57 1.59 1.96
MDJ Johns Hopkins Hospital, Baltimore 1.66 1.58 1.80
PAC Children’s Hospital, Philadelphia 1.46 1.60 1.91
TNM St Jude Children’s Hospital, Memphis 1.26 1.68 1.94
NYL Memorial Sloan Kettering, New York 1.18 1.75 1.94
ONT Hospital for Sick Children, Toronto 1.93 1.16 1.16
MID Children’s Hospital of Michigan, Detroit 1.10 1.30 1.84
MIA C.S. Mott Children’s Hospital, Ann Arbor 1.02 1.48 1.67
TXB Texas Children Cancer Control, Baylor College of Medicine, Houston 1.06 1.44 1.59
PAG University of Pittsburgh, Pittsburgh 1.38 1.30 1.32
NCD Duke University Medical Center, Durham 1.21 1.36 1.43
Table 11: Leading North American research institutions in paediatric oncology, 1997–2008, with three measures of ‘quality’—mean percent- age of reviews, potential citation impact (PCI) and actual citation impact (ACI) (1997–2004 papers, 5-year citation window); all relative to world mean values of 6.17%, 11.04 cites and 8.62 cites. For colour coding, see text above
Figure 5, in which it appeared that the paediatric oncology papers were less cited, on average, than the papers in the journals in which they were published. There is a slow decline in the mean value of RLj (i.e. the journals used for paediatric oncology papers are becoming a little more clinical), but not in that of RLp.
There are some differences in the level of research carried out in the selected countries. This is shown in chart form in Figure 11. Sweden and the Netherlands do the most basic research, and Canada and France the most clinical, but the differences are not great.
There were 2239 papers reporting clinical trials, according to the definition described in section 2.5; the percentage rose from about 6.5%
to 7.5% over the period but somewhat irregularly, with a temporary peak in 2001 and a small trough in 2005. There was, however, a much bigger variation between countries, see Figure 12, with Switzerland performing relatively the most—almost twice the world average of 7%—and the RoW rather few.
3.6 International collaboration for countries
The matrix of inter-country collaboration is not symmetrical when the contributions are determined on a fractional count basis. For exam- ple, the Canadian contribution to US papers is equal to the US contribution to Canadian papers on a simple integer count basis (514 papers), but the two are not equal on a fractional count basis: they are respectively 166 and 305 papers. Table 13 shows the numbers of foreign contributions from the ‘guests’ listed in the columns to the papers by the ‘hosts’ in the rows.
These contributions were then compared with the numbers expected on the basis of each country’s (or the EU20’s or RoW’s) percent- age presence in world paediatric oncology research (less that of the country in the row) to give a ratio of observed to expected numbers
Policy
Code Institution % rev/W PCI/W ACI/W
NLA University of Amsterdam, Netherlands 2.42 1.37 1.74
NLR Erasmus University, Rotterdam, Netherlands 1.21 1.85 2.18
DES University of Munster, Germany 2.13 1.17 1.71
FRV Institut Gustave Roussy, Villejuif, France 1.78 1.37 1.51
UKU University College London, England 1.39 1.35 1.81
UKN Newcastle-upon-Tyne (city), England 1.29 1.67 1.57
UKM Manchester (city), England 1.14 1.46 1.58
DEH Heidelberg (city), Germany 0.89 1.39 1.69
DEB Humboldt Univ. (Charité), Berlin, Germany 0.57 1.56 1.71
UKB Nottingham (city), England 0.97 1.53 1.32
DEV Hannover (city), Germany 0.45 1.49 1.86
ITG Istituto Gaslini, Genova, Italy 0.91 1.30 1.55
SES Karolinska Institute, Stockholm, Sweden 0.51 1.52 1.69
ITM University of Milan, Italy 1.20 1.24 1.26
ITR Univ. La Sapienza (Bambino Gesù), Rome, Italy 0.89 1.34 1.32
DED Düsseldorf (city), Germany 1.10 1.03 1.26
ITP Padova (city), Italy 0.51 1.36 1.29
ESB Barcelona (city), Spain 0.78 1.14 1.13
DEM München (city), Germany 0.55 1.04 1.29
ESM Madrid (city), Spain 0.72 0.92 0.70
Table 12: Leading European cities and universities in paediatric oncology, 1997–2008, with three measures of ‘quality’—mean percentage of reviews, potential citation impact (PCI) and actual citation impact (ACI) (1997–2004 papers, 5-year citation window); all relative to world mean values of 6.17%, 11.04 cites and 8.62 cites. For colour coding, see text above Table 11
1.2 1.4 1.6 1.8
1998 2000 2002 2004 2006
Year
Mean RL
Journal Paper
Figure 10: Mean research level (1 = clinical, 4 = basic) for paediatric oncology papers, 1997–2008, 3-year running means, based on paper titles (Paper) and the journals in which they appeared (Journal)
Policy
of papers, shown in Table 14. In this table, cells are coloured green if the ratio > 2.0; pale green if it >1.41; yellow if it <0.71 and pink if it <0.5.
This table reveals some collaboration patterns that are well known and easily explicable on the basis of geographical proximity, or histori- cal, linguistic or cultural factors. Thus Canada and the USA collaborate well in both directions. Within Europe, the US scientists favour Switzerland and Sweden in relation to their output, but Canada favours Switzerland and the UK. The UK favours the Netherlands and Sweden, followed by France, Switzerland and the EU20 Member States, but, perhaps surprisingly, not the USA. The Netherlands has close links both with Germany and the EU20, but Germany strongly favours Switzerland, as do France and Italy, probably because of linguistic ties. The table reveals a strong intra-European linkage, stimulated by EU activities in research, with a comparative neglect of the USA and Canada, apart from above-average Canadian contribution to UK papers.
But not all the high (or low) ratios are statistically significant as some of the numbers are quite small. Table 15 shows which are significant at the 5% and 1% level: differences that are statistically significant with p < 1% are shown shaded in bright green (if greater than expected) or in pink (if less); if p < 5%, differences are shown shaded in light green (if higher) and in light yellow (if lower).
0 5 10 15
CH SE CA FR NL EU20 UK IT DE US ES Wld RoW
Percent of clinical trials
Figure 12: Percentage of selected countries’ paediatric oncology papers that are clinical trials, 1997–2008; integer counts.
Figure 11: Mean journal-based and paper-based research levels for selected countries in paediatric oncology, 1997–2008; integer counts.
1 1.2 1.4 1.6 1.8 2
SE NL DE ES UK EU27 IT CH US CA FR Wld
Mean research level
Journal-based Paper-based
Policy
It is clear that paediatric oncology researchers from the RoW are not collaborating with the selected countries as much as their overall presence in the subject would appear to justify. This may be due to ignorance of their work, particularly if they are from the Far East. The USA is also relatively neglected, except by Italy and Spain; this is rather more surprising. Canada, on the other hand, is not significantly neglected. This table reinforces the view that the Europeans are working well together.
3.7 Changes in collaboration pattern with time
The above exercise was repeated for each of the 4-year periods, 1997–2000, 2001–4 and 2005–8. For many of the pairs of countries the numbers of co-publications were too small to make determination of time trends reliable, but the table below shows where the numbers
H\G US DE EU20 UK IT FR CA NL ES SE CH RoW
US 135 137 95 82 58 166 55 17 40 24 358
DE 130 111 58 41 35 16 60 6 16 33 65
EU20 146 155 71 46 70 17 60 9 48 15 60
UK 127 51 71 53 57 29 35 11 21 10 103
IT 89 30 43 46 32 9 15 10 10 9 41
FR 65 32 42 43 39 12 18 10 17 13 57
CA 305 21 14 30 10 16 6 2 4 5 57
NL 64 56 59 41 20 24 6 5 10 5 30
ES 24 8 15 12 13 12 2 9 3 2 13
SE 41 18 51 19 12 10 6 14 3 1 46
CH 36 59 21 14 12 29 5 5 1 1 18
Table 13: Foreign contributions to paediatric oncology papers from selected countries, EU20 and the Rest of the World (RoW), 1997–2008, fractional counts of articles + reviews
Ratio US DE EU20 UK IT FR CA NL ES SE CH RoW
US 1.07 1.25 0.92 0.92 0.69 2.81 1.34 0.54 1.47 1.56 0.75
DE 0.68 2.77 1.54 1.26 1.14 0.74 4.00 0.52 1.61 5.87 0.37
EU20 0.63 2.79 1.56 1.17 1.88 0.65 3.31 0.65 4.00 2.21 0.28
UK 0.68 1.13 1.81 1.66 1.89 1.37 2.38 0.98 2.16 1.81 0.60
IT 0.82 1.14 1.88 2.14 1.82 0.73 1.75 1.52 1.76 2.80 0.41
FR 0.57 1.17 1.77 1.92 2.02 0.94 2.02 1.47 2.89 3.89 0.55
CA 2.02 0.58 0.44 1.01 0.39 0.66 0.51 0.22 0.51 1.13 0.41
NL 0.63 2.29 2.77 2.05 1.16 1.47 0.52 0.82 1.90 1.67 0.32
ES 0.67 0.93 2.01 1.71 2.14 2.09 0.50 3.21 1.62 1.90 0.40
SE 0.59 1.08 3.50 1.38 1.01 0.89 0.76 2.56 0.72 0.49 0.72
CH 0.57 3.91 1.59 1.13 1.12 2.86 0.71 1.01 0.26 0.31 0.31
Table 14: Ratio of observed to expected foreign contributions to each of the selected countries’ (listed in column 1) paediatric oncology research papers; fractional count basis, 1997–2008. For colour coding, see text on previous page
Policy
are likely to be significant. Not all of the triplets of ratios of observed to expected numbers of papers (cf. Table 14) show a uniform increase or decrease, however, and the colour coding of the cells in Table 16 is intended to show the main features of the changes.
Since the countries are arranged in descending order of outputs (except for the RoW), it is not surprising that the coloured cells are mainly in the upper left quadrant. For the USA, there is an increased preference for working with German and Swedish researchers, but a decreased preference for Canadians and those from the EU20—mainly the new accession Member States. There is clearly a mutually increasing trend for British and German researchers to collaborate, and for British researchers to contribute more to Dutch papers (but not vice versa). The EU20 Member State researchers seem to be less popular in many countries, but on the other hand, they are increas- ingly receptive of Swedish collaborators. The other notable trend, and it is the biggest in terms of ratio change (from x2.7 to x5.1) is the increasing German contribution to Swiss paediatric oncology.
Significant US DE EU20 UK IT FR CA NL ES SE CH RoW
US n.s. 0.69 n.s. n.s. 0.32 0.00 2.67 1.10 1.16 2.00 0.00
DE 0.00 0.00 0.07 n.s. n.s. n.s. 0.00 n.s. n.s. 0.00 0.00
EU20 0.00 0.00 0.01 n.s. 0.00 n.s. 0.00 n.s. 0.00 0.23 0.00
UK 0.00 n.s. 0.00 0.01 0.00 n.s. 0.00 n.s. 0.04 n.s. 0.00
IT 2.02 n.s. 0.00 0.00 0.06 n.s. 4.35 n.s. n.s. 0.04 0.00
FR 0.00 n.s. 0.01 0.00 0.00 n.s. 0.23 n.s. 0.00 0.00 0.00
CA 0.00 0.94 0.09 n.s. 0.12 n.s. n.s. 1.90 n.s. n.s. 0.00
NL 0.00 0.00 0.00 0.00 n.s. 4.11 n.s. n.s. 2.49 n.s. 0.00
ES 1.58 n.s. 0.17 n.s. 0.32 1.21 n.s. 0.04 n.s. n.s. 0.00
SE 0.00 n.s. 0.00 n.s. n.s. n.s. n.s. 0.00 n.s. n.s. 0.77
CH 0.99 0.00 2.24 n.s. n.s. 0.00 n.s. n.s. n.s. n.s. 0.00
Table 15: Statistical significance (percent) between observed and expected numbers of papers from a given foreign country (column) within the papers published by one of the selected countries (row). For shading codes see previous page; n.s. = not significant at 5% level
Table 16: Matrix of increases or decreases in the amount of inter-country collaboration in paediatric oncology research, from 1997–2000 to 2005–8. Colour coding: bright green, a definite increase; light green, a probable increase; light yellow, a probable decrease; pink, a definite decrease
Host/guest US DE EU20 UK IT FR CA NL ES SE CH RoW
US
DE
EU20
UK
IT
FR
CA
NL
ES
SE
CH
Policy
3.8 International collaboration for leading institutions
For each of the institutions (or cities/universities for Europe) listed in Tables 9 and 10, we determined their relative propensity to collaborate with researchers from the other nine selected countries, the EU20 Member States and the RoW. The methodology is explained in the last paragraph of section 2.6. The results, in the form of observed to expected ratios, are shown in Tables 17 (for North America) and 18 (for Europe).
All of the leading US institutions preferentially collaborate with Canada, as might be expected from Table 14 where the ratio for the whole country is x2.81. Most also collaborate highly with Switzerland (except notably the University of Minnesota, MNU), and with the Netherlands. However Spanish researchers are hardly used, except by Memorial Sloan Kettering in New York (NYL) and the University of Pittsburgh, Pennsylvania (PAG). Collaboration with other countries appears to be on an individual basis with no clear pattern.
The collaborative patterns of the European cities and universities are rather more consistent than for the North American institutions.
The Netherlands, in keeping with its superior citation performance (see Figure 6) is universally popular as a collaborator, as is the UK (except for the Humboldt University/Charité Hospital in Berlin, DEB) and as are the EU20 Member States. Switzerland is popular with the German, French and Italian cities and universities (cf. Table 14), despite an average citation performance; its extensive collaboration with places in these countries is stimulated by its strong showing in clinical trials. Thus of the Swiss domestic papers (n = 199), only 7 involve clinical trials whereas 64 of its 295 international papers do (22%), and the percentages of papers co-authored with Germans, Italians and French authors that involve clinical trials are 26%, 29% and 30%, respectively. On the other hand, US researchers are relatively little used by almost everyone, and Canadians are also relatively neglected except in the UK, Istituto Gaslini in Genova (ITG), Munster (DES) and Hannover (DEV) in Germany. Also, researchers in the RoW are resolutely ignored as potential partners, much more than by the
CA CH DE ES FR IT NL SE UK US EU20 RoW
ONT 0.74 0.33 0.29 0.18 0.16 0.51 0.64 1.28 2.22 0.34 0.43
CAF 4.93 4.84 1.09 0.88 3.68 0.88 1.24 0.58 1.43 1.52 0.79
MAD 3.87 2.33 0.68 0.26 0.75 1.56 2.44 6.99 1.47 3.29 0.64
MDB 2.59 0.93 2.15 0.06 0.78 1.29 1.82 2.47 1.21 1.74 1.25
MDJ 3.86 3.20 1.40 0.16 1.25 0.69 7.07 4.32 0.81 1.11 0.92
MIA 3.04 9.73 2.40 0.00 1.51 1.04 2.10 0.48 1.38 2.11 0.74
MID 7.61 5.97 1.17 0.00 0.09 0.08 4.88 1.64 0.76 0.25 1.32
MNR 4.50 3.74 0.61 0.20 1.04 0.62 0.73 3.76 3.63 1.34 1.00
MNU 9.35 0.00 2.26 0.53 2.13 0.66 0.84 0.65 2.13 0.27 0.59
NCD 9.59 9.30 1.42 0.89 0.51 0.38 2.33 0.00 0.25 0.31 1.12
NYL 6.04 1.23 0.80 5.50 0.98 0.21 1.15 1.45 0.99 1.29 1.25
NYP 3.42 0.00 0.00 0.33 1.31 2.25 1.58 3.39 1.48 1.14 1.52
PAC 8.49 6.06 0.87 0.54 0.13 1.07 0.67 1.64 1.30 1.51 0.98
PAG 7.13 0.57 1.58 3.64 1.95 0.35 0.21 0.00 0.61 2.95 0.72
TNM 5.46 1.67 2.00 0.03 0.99 0.71 1.86 0.50 1.88 0.33 1.24
TXB 13.28 8.82 0.24 0.00 1.06 0.83 2.00 0.00 0.29 1.57 0.59
TXH 3.75 2.33 2.78 0.75 0.80 0.90 1.86 0.33 0.77 1.59 1.16
Table 17: Propensity for researchers in the leading US and Canadian paediatric oncology institutions (for codes, see Table 9) to collaborate with researchers from the nine selected foreign countries, the EU20 and the Rest of the World (RoW), 1997–2008. For colour coding, see text after Table 13