ARTICLE
doi:10.1038/nature11327Subgroup-specific structural variation across 1,000 medulloblastoma genomes
A list of authors and their affiliations appears at the end of the paper
Medulloblastoma, the most common malignant paediatric brain tumour, is currently treated with nonspecific cytotoxic therapies including surgery, whole-brain radiation, and aggressive chemotherapy. As medulloblastoma exhibits marked intertumoural heterogeneity, with at least four distinct molecular variants, previous attempts to identify targets for therapy have been underpowered because of small samples sizes. Here we report somatic copy number aberrations (SCNAs) in 1,087 unique medulloblastomas. SCNAs are common in medulloblastoma, and are predominantly subgroup-enriched. The most common region of focal copy number gain is a tandem duplication of SNCAIP , a gene associated with Parkinson’s disease, which is exquisitely restricted to Group 4a. Recurrent translocations of PVT1, including PVT1-MYC and PVT1-NDRG1, that arise through chromothripsis are restricted to Group 3. Numerous targetable SCNAs, including recurrent events targeting TGF-b signalling in Group 3, and NF-kB signalling in Group 4, suggest future avenues for rational, targeted therapy.
Brain tumours are the most common cause of childhood oncological death, and medulloblastoma is the most common malignant paediatric brain tumour. Current medulloblastoma therapy including surgical resection, whole-brain and spinal cord radiation, and aggressive chemotherapy supplemented by bone marrow transplant yields five- year survival rates of 60–70%
1. Survivors are often left with significant neurological, intellectual and physical disabilities secondary to the effects of these nonspecific cytotoxic therapies on the developing brain
2. Recent evidence suggests that medulloblastoma actually comprises multiple molecularly distinct entities whose clinical and genetic dif- ferences may require separate therapeutic strategies
3–6. Four principal subgroups of medulloblastoma have been identified: WNT, SHH, Group 3 and Group 4 (ref. 7), and there is preliminary evidence for clinically significant subdivisions of the subgroups
3,7,8. Rational, targeted therapies based on genetics are not currently in use for medulloblastoma, although inhibitors of the Sonic Hedgehog pathway protein Smoothened have shown early promise
9. Actionable targets for WNT, Group 3 and Group 4 tumours have not been identified
4,10. Sanger sequencing of 22 medulloblastoma exomes revealed on average only 8 single nucleotide variants (SNVs) per tumour
11. Some SNVs were subgroup-restricted (PTCH1, CTNNB1), whereas others occurred across subgroups (TP53, MLL2). We pro- posed that the observed intertumoural heterogeneity might have underpowered prior attempts to discover targets for rational therapy.
The Medulloblastoma Advanced Genomics International Consortium (MAGIC) consisting of scientists and physicians from 46 cities across the globe gathered more than 1,200 medulloblastomas which were studied by SNP arrays (n 5 1,239; Fig. 1a, Supplementary Fig. 1 and Supplementary Tables 1–3). Medulloblastoma subgroup affiliation of 827 cases was determined using a custom nanoString- based RNA assay (Supplementary Fig. 2)
12. Disparate patterns of broad cytogenetic gain and loss were observed across the subgroups (Fig. 1b and Supplementary Figs 3, 7, 8, 10 and 11). Analysis of the entire cohort using GISTIC2 (ref. 13) to discover significant ‘driver’
events delineated 62 regions of recurrent SCNA (Fig. 1c, Supplementary Fig. 4 and Supplementary Tables 4 and 5); analysis by subgroup increased sensitivity such that 110 candidate ‘driver’
SCNAs were identified, most of which are subgroup-enriched (Fig. 1c–e and Supplementary Table 6).
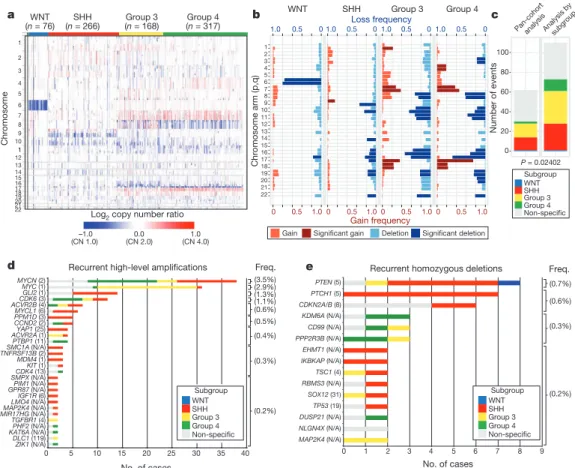
Twenty-eight regions of recurrent high-level amplification (copy number $ 5) were identified (Fig. 1d and Supplementary Table 7).
The most prevalent amplifications affected members of the MYC family with MYCN predominantly amplified in SHH and Group 4, MYC in Group 3, and MYCL1 in SHH medulloblastomas. Multiple genes/regions were exclusively amplified in SHH, including GLI2, MYCL1, PPM1D, YAP1 and MDM4 (Fig. 1d). Recurrent homozygous deletions were exceedingly rare, with only 15 detected across 1,087 tumours (Fig. 1e). Homozygous deletions targeting known tumour suppressors PTEN, PTCH1 and CDKN2A/B were the most common, all enriched in SHH cases (Fig. 1e and Supplementary Table 7). Novel homozygous deletions included KDM6A, a histone-lysine demethylase deleted in Group 4. A custom nanoString CodeSet was used to verify 24 significant regions of gain across 192 MAGIC cases, resulting in a verification rate of 90.9% (Supplementary Fig. 5). We conclude that SCNAs in medulloblastoma are common, and are predominantly subgroup-enriched.
Subgroup-specific SCNAs in medulloblastoma
WNT medulloblastoma genomes are impoverished of recurrent focal regions of SCNA, exhibiting no significant regions of deletion and only a small subset of focal gains found at comparable frequencies in non-WNT tumours (Supplementary Figs 4, 6 and Supplementary Table 8). CTNNB1 mutational screening confirmed canonical exon 3 mutations in 63 out of 71 (88.7%) WNT tumours, whereas monosomy 6 was detected in 58 out of 76 (76.3%) (Supplementary Fig. 6;
Supplementary Table 9). Four WNT tumours (4/71; 5.6%) had neither CTNNB1 mutation nor monosomy 6, but maintained typical WNT expression signatures. Given the size of our cohort and the resolution of the platform, we conclude that there are no frequent, targetable SCNAs for WNT medulloblastoma.
SHH tumours exhibit multiple significant focal SCNAs (Fig. 2a, Supplementary Figs 12, 15, 16 and Supplementary Tables 10 and 11).
SHH enriched/restricted SCNAs included amplification of GLI2 and
deletion of PTCH1 (Fig. 2a, e, f)
10. MYCN and CCND2 were among
the most frequently amplified genes in SHH (Supplementary
Table 6), but were also altered in non-SHH cases. Genes upregulated
in SHH tumours (that is, SHH signature genes) are significantly over-
represented among the genes focally amplified in SHH tumours
5q35.3[105]
ELF2 [3]
4p16.3[126]
–3 –2 –1 0 1 2 3
Time in months
OS probability
0.0 0.2 0.4 0.6 0.8 1.0
OS probability
0.0 0.2 0.4 0.6 0.8 1.0
OS probability
0.0 0.2 0.4 0.6 0.8 1.0
P = 0.0022
0 12 24 36 48 60
Time in months
0 12 24 36 48 60
Time in months
0 12 24 36 48 60
pb
P = 1.5 × 10⁻⁵
|
P = 0.22 MDM4
Chr17 Chr1
201.0–202.0
55.0–57.0
Mb Mb
PPM1D PIK3C2B/MDM4
PPM1D PIK3C2B/MDM4
a b c
d
f
10–2010–50 g
10–210–510–10 10–1010–610–410–2 0.25
FDR Q value
Coverage: 23% Exclusivity: 79%
Copy number state
e
TP53 CCND2PTCH1ELF2 MYCN
MYCN amplification
MYCN GLI2 PTCH1
Non-PTCH1 Non-GLI2
Non-MYCN
GLI2 amplification PTCH1 focal deletion
GLI2 1q21.3[11]
2p23.3[28]
7q11.23[83]
8p12[3]
9p23[3]
CDKN2A/B [18]
PTCH1 [5]
KLF4 [10]
PTEN [5]
15q15.1[24]
TP53 [4]
17p11.2[26]
SHH MYCL1 [6]LMO4 [9]
MDM4 [14]
MYCN [2]
GLI2 [1]
ACVR2B [18]
3q25.1[8]
PPP2R2B [1]
6p21.2[2]
8q22.1[2]
YAP1 [1]
12p13.33[35]
12q15[1]
IRS2 [3]
IGF1R [6]
16p13.2[223]
17p11.2[69]
PPM1D [3]
21q22.11[2]
CCND2 [2]
CDK6 [7]
6q24.3[1]
KIT [2]
12p12.1[4]
7p22.3[82]
10p14[4]
10p11.23[4]
20p13[109]
MB-7MB-1040MB-875MB-698MB-486MB-643MB-198MB-391MB-1129MB-1249MB-1236MB-1133MB-488MB-749MB-1276 MB-413MB-216 MB-1233MB-539MB-184MB-749 MB-862MB-1106MB-1037MB-903 MB-698MB-347MB-14MB-1094 MB-103MB-1267MB-434MB-488MB-1311MB-875
Deleted
% of cases
>3.0 0 >3.0 PTCH1
CDKN2A/B GLI1 MYCN
MDM1 TP53
CDKN2A/B PTEN1
TSC1 MDM4
KLF4 PPM1D
miR-17/92
PPP2R2B PDGFRA IGF1R
IRS2
AKT3 YAP1
PIK3C2G KIT
GLI2
CCND2 5.4% (7.7%)
8.3% (18%) 5.3% (14%)
3.4% (3.8%) 1.5% (8.3%)
3.0% (26%) 1.5% (7.5%) 0.4% (1.5%)
0.8% (0.8%)
1.1% (7.5%)
1.5% (8.3%)
0.8% (0.8%)
2.3% (6.0%) 1.1% (36%)
1.5% (4.9%) 1.9% (4.1%) 1.1% (4.9%)
1.9% (7.5%)
1.1% (1.5%) PIK3C2B 1.5% (7.5%) 1.5% (3.4%)
1.5% (8.3%)
0.8% (6.8%)
1.1% (36%)
SHH signalling: 18.0% (P = 0.0009) RTK/PI3K signalling: 10.0% (P = 0.0139)
TP53 signalling: 9.4% (P = 0.0012)
Amplified
Figure 2
|
Genomic alterations affect core signalling pathways in SHH medulloblastoma. a, GISTIC2 significance plot of amplifications (red) anddeletions (blue) observed in SHH. The number of genes mapping to each significant region are included in brackets and regions enriched in SHH are shaded red.
b,c, Recurrent amplifications ofPPM1D(b) and
PIK3C2B/MDM4(c) are restricted to SHH.
d, Fluorescencein situhybridization (FISH) validation of
MDM4amplification.
e, SHH signalling, TP53 signalling andRTK/PI3K signalling represent the core pathways genomically targeted in SHH.
Pvalues indicate the prevalence with which the respective pathway is targeted in SHH versus non-SHH cases (Fisher’s exact test). Frequencies of focal and broad (parentheses) SCNAs are listed.
f, Mutual exclusivity analysis offocal SCNAs in SHH.
g, Clinical implications of SCNAs affectingMYCN,GLI2or
PTCH1in SHH (log-rank tests).
Chromosome arm (p,q)
1 2 3 4 5 6 7 8 9 10 11 12 13 14 15 16 17 18 19 20 21 22
WNT SHH Group 3 Group 4
Gain frequency Loss frequency
1.0 0.5 0
1.0 0.5 0
1.0 0.5 0
1.0 0.5 0
1.0 0.5
0 0 0.5 1.00 0.5 1.00 0.5 1.0
Gain Significant gain Deletion Significant deletion (n = 76)WNT SHH
(n = 266) Group 3
(n = 168) Group 4 (n = 317)
–1.0
(CN 1.0) 0.0
(CN 2.0) 1.0
(CN 4.0) Log2 copy number ratio 1
2 3 4 5 6 7 8 9 10 1 1 12 13 14 15 1617 1819 2021 22
Chromosome
a b c
Number of events
0 20 40 60 80 100
Pan-cohortanalysis
P = 0.02402 Analysis bysubgroup
Recurrent high-level amplifications
No. of cases
0 5 10 15 20 25 30 35 40
ZIK1 (N/A) DLC1 (119) KAT6ATGFBR1 (4)PHF2 (N/A)(N/A) MIR17HG (N/A)MAP2K4 (N/A)GPR87 (N/A)LMO4 (N/A)SMPX (N/A)PIM1 (N/A)CDK4 MDM4 IGF1R (6)KIT (13)(1)(1) TNFRSF13B SMC1A ACVR2A (1)ACVR2B (4)PTBP1 CCND2 (2)PPM1D (3)MYCL1 (6)YAP1 (25)MYCN CDK6 (3)MYC (1)GLI2 (1)(N/A)(11)(2)(2)
Subgroup WNT SHH Group 3 Group 4 Non-specific
(0.2%) (0.3%) (0.4%) (0.5%) (0.6%) (1.1%) (1.3%) (2.9%) (3.5%)
Freq. Recurrent homozygous deletions
0 1 2 3 4 5 6 7 8 9
MAP2K4 (N/A) NLGN4X (N/A) DUSP21 (N/A) TP53 (19) SOX12 (31) RBMS3 (N/A) TSC1 (4) IKBKAP (N/A) EHMT1 (N/A) PPP2R3B (N/A) CD99 (N/A) KDM6A (N/A) CDKN2A/B (8) PTCH1 (5) PTEN (5)
Freq.
(0.2%) (0.3%) (0.6%) (0.7%)
d e
Subgroup WNT SHH Group 3 Group 4 Non-specific
Subgroup WNT SHH Group 3 Group 4 Non-specific
No. of cases
Figure 1
|
Genomic heterogeneity of medulloblastoma subgroups. a, Themedulloblastoma genome classified by subgroup.
b, Frequency and significance(Q value
#0.1) of broad cytogenetic events across medulloblastoma subgroups.
c, Significant regions of focal SCNA identified by GISTIC2 in either pan-cohort
or subgroup-specific analyses.
d,e, Recurrent high-level amplifications(d, segmented copy number (CN)
$5) and homozygous deletions
(e, segmented CN
#0.7) in medulloblastoma. The number of genes mapping to
the GISTIC2 peak region (where applicable) is listed in brackets after the
suspected driver gene, as is the frequency of each event.
(P 5 0.001–0.02, permutation tests; Supplementary Fig. 9). Recurrent amplification of SHH signature genes has clinical implications, as amplification of downstream transcriptional targets could mediate resistance to upstream SHH pathway inhibitors
14.
Novel, SHH-enriched SCNAs included components of TP53 sig- nalling, including amplifications of MDM4 and PPM1D, and focal deletions of TP53 (Fig. 2a–e). Targetable events, including amplifica- tions of IGF signalling genes IGF1R and IRS2, PI3K genes PIK3C2G and PIK3C2B, and deletion of PTEN were restricted to SHH tumours (Fig. 2a, c, e). Importantly, focal events affecting genes in the SHH pathway were largely mutually exclusive and prognostically signifi- cant (Fig. 2f, g). Many of the recurrent, targetable SCNAs identified in SHH medulloblastoma (IGF1R, KIT, MDM4, PDGFRA, PIK3C2G, PIK2C2B and PTEN) have already been targeted with small molecules for treatment of other malignancies, which might allow rapid trans- lation for targeted therapy of subsets of SHH patients (Supplementary Table 16). Novel SHH targets identified here are excellent candidates for combinatorial therapy with Smoothened inhibitors, to avoid the resistance encountered in both humans and mice
9,14,15.
Group 3 and Group 4 medulloblastomas have generic names as comparatively little is known about their genetic basis, and no targets for rational therapy have been identified
7. MYC amplicons are largely restricted to Group 3, whereas MYCN amplicons are seen in Group 4 and SHH tumours (Fig. 1d)
3,4. Indeed, MYC and MYCN loci comprise the most significant regions of amplification observed in Group 3 and Group 4, respectively (Fig. 3a, b, Supplementary Figs 13, 14, 17–20 and Supplementary Tables 12–15). Group 3 MYC amplicons were mutually exclusive from those affecting the known medulloblastoma oncogene OTX2 (ref. 16) and were highly prognostic (Supplementary Fig. 21)
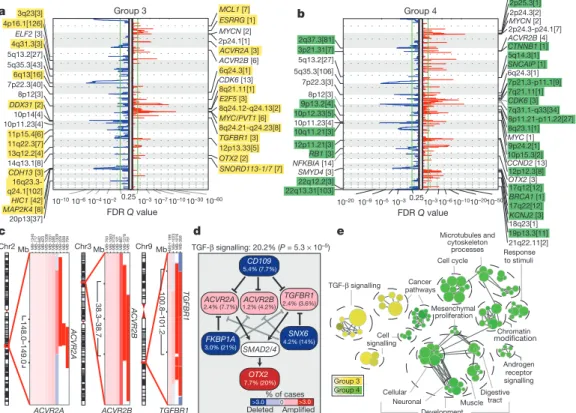
3,16. Type II activin receptors, ACVR2A and ACVR2B and family member TGFBR1 are highly amplified in Group 3 tumours, indicating deregulation of TGF-b signalling as a driver event in Group 3 (Fig. 3c–e and Supplementary Fig. 22). The Group 3-enriched
medulloblastoma oncogene OTX2 is a prominent target of TGF-b signalling in the developing nervous system
17and TGF-b pathway inhibitors CD109 (ref. 18), FKBP1A (refs 19 and 20) and SNX6 (ref.
20) are recurrently deleted in Group 3 (Fig. 3a, d). SCNAs in TGF-b pathway genes were heavily enriched in Group 3 (P 55.37 3 10
25, Fisher’s exact test) and found in at least 20.2% of cases, indicating that TGF-b signalling represents the first rational target for this poor prognosis subgroup (Fig. 3d). Similarly, novel deletions affecting regulators of the NF-kB pathway, including NFKBIA (ref. 21) and USP4 (ref. 22) were identified in Group 4 (Supplementary Fig. 23), proposing that NF-kB signalling may represent a rational Group 4 therapeutic target.
Network analysis of Group 3 and Group 4 SCNAs illustrates the different pathways over-represented in each subgroup. Only TGF-b signalling is unique to Group 3 (Fig. 3e). In contrast, cell-cycle control, chromatin modification and neuronal development are all Group 4-enriched. Cumulatively, the dismal prognosis of Group 3 patients, the lack of published targets for rational therapy, and the prior targeting of TGF-b signalling in other diseases suggest that TGF-b may represent an appealing target for Group 3 rational therapies (Supplementary Table 16).
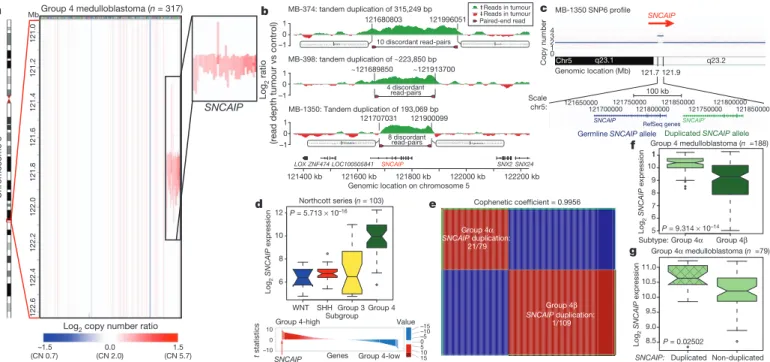
SNCAIP tandem duplication is common in Group 4 Although Group 4 is the most prevalent medulloblastoma subgroup, its pathogenesis remains poorly understood. The most frequent SCNA observed in Group 4 (33/317; 10.4%) is a recurrent region of single copy gain on chr5q23.2 targeting a single gene, SNCAIP (synuclein, alpha interacting protein) (Fig. 4a and Supplementary Fig. 24). SNCAIP, encodes synphilin-1, which binds to a-synuclein to promote the formation of Lewy bodies in the brains of patients with Parkinson’s disease
23,24. Additionally, rare germline mutations of SNCAIP have been described in Parkinson’s families
25. Large insert, mate-pair, whole-genome sequencing (WGS) demonstrates that
ACVR2A ACVR2B TGFBR1
ACVR2A ACVR2B TGFBR1
c
Chr2 Mb
148.0–149.0 38.3–38.7 100.8–101.2
Chr3 Mb Chr9 Mb
MB-1340 MB-717 MB-582 MB-423 MB-1036 MB-1351 MB-586 MB-1309 MB-329 MB-359 MB-794 MB-763MB-1063 MB-
1124
MB-101 MB-887MB-1278MB-761 MB-1199
MB-1023 MB-1016 MB-359
Group 3 Group 4
TGF-β signalling Cancer pathways
Cell cycle
Response to stimuli
Cell signalling
Neuronal Muscle
Microtubules and cytoskeleton
processes
Development Mesenchymal
proliferation
Chromatin modification
Digestive tract Cellular
Androgen receptor signalling
e d
CD109
FKBP1A SNX6
ACVR2A
OTX2 SMAD2/4
Deleted
% of cases
>3.0 0 >3.0 7.7% (20%)
4.2% (14%) 3.0% (21%)
5.4% (7.7%)
2.4% (7.7%) ACVR2B 1.2% (4.2%)
TGFBR1 2.4% (3.6%) TGF-β signalling: 20.2% (P = 5.3 × 10⁻⁵)
Amplified
a
FDR Q value
0.2510–310–710–1010–3010–60 10–2
10–4 10–6 10–10 14q13.1[8]
10p11.23[4]
10p14[4]
8p12[3]
7p22.3[40]
5q35.3[43]
5q13.2[27]
ELF2 [3]
ACVR2B [6]
MYCN [2]
16q23.3- q24.1[102]
DDX31 [2]
4p16.1[126]
8q24.12-q24.13[2]
MCL1 [7]
ESRRG [1]
ACVR2A [3]
6q24.3[1]
8q21.11[1]
12p13.33[5]
OTX2 [2]
SNORD113-1/7 [7]
Group 3
2p24.1[1]
CDK6 [13]
E2F5 [3]
MYC/PVT1 [6]
8q24.21-q24.23[8]
TGFBR1 [3]
3q23[3]
4q31.3[3]
6q13[16]
11p15.4[6]
11q22.3[7]
13q12.2[4]
CDH13 [3]
MAP2K4 [8] HIC1 [42]
20p13[37]
b
NFKBIA [14]
10p12.33[5]
BRCA1 [1]
9p24.2[1]
7p21.3-p11.1[9]
6q24.3[1]
Group 4
1q41[1]
2p25.3[1]
2p24.3[2]
MYCN [2]
2p24.3-p24.1[7]
ACVR2B [4]
CTNNB1 [1]
5q14.3[1]
SNCAIP [1]
7q21.11[1]
CDK6 [3]
7q31.1-q33[34]
8p11.21-p11.22[27]
8q23.1[1]
MYC [1]
10p15.3[2]
21q22.11[2]
OTX2 [3]
19p13.3[11]
18q23[1]
KCNJ2 [3]
CCND2 [13]
12p12.3[8]
[ ] 17q12[12]
17q22[12]
2q37.3[81]
3p21.31[7]
5q13.2[27]
5q35.3[106]
7p22.3[3]
8p12[3]
9p13.2[4]
10p11.23[4]
10q11.21[3]
12p11.21[3]
RB1 [3]
SMYD4 [3]
22q12.2[3]
22q13.31[103]
10–2010–50 10–310–610–10 10–2010–910–510–30.25
FDR Q value
Figure 3
|
The genomic landscape of Group 3 and Group 4medulloblastoma. a,b, GISTIC2 plots depicting significant SCNAs in Group 3
(a) and Group 4 (b) with subgroup-enriched regions shaded in yellow and green, respectively.
c, Recurrent amplifications targeting type II (ACVR2Aand
ACVR2B) and type I (TGFBR1) activin receptors in Group 3.d, Recurrent
SCNAs affecting the TGF-b pathway in Group 3 (P
55.73
310
25, Fisher’s exact test). Frequencies of focal and broad (parentheses) SCNAs are listed.
e, Enrichment map of gene sets affected by SCNAs in Group 3 versus Group 4.
SNCAIP copy number gains arise from tandem duplication of a truncated SNCAIP (lacking non-coding exon 1), inserted telomeric to the germline SNCAIP allele (Fig. 4b, c and Supplementary Fig. 25).
Affymetrix SNP6 array profiling of patient-matched germline material confirmed that SNCAIP duplications are somatic (Supplementary Fig.
26), and subsequent whole-transcriptome sequencing (RNA-Seq) of select Group 4 cases (n 55) verified that SNCAIP is the only gene expressed in the duplicated region (Supplementary Fig. 27). Analysis of published copy number profiles for 3,131 primary tumours
26and 947 cancer cell lines
27(total of 4,078 cases) revealed only four cases with apparent duplication of SNCAIP, all of which were inferred as Group 4 medulloblastomas (data not shown). We conclude that SNCAIP duplica- tion is a somatic event highly specific to Group 4 medulloblastoma.
Re-analysis of 499 published medulloblastoma expression profiles confirmed that SNCAIP is one of the most highly upregulated Group 4 signature genes (Fig. 4d and Supplementary Fig. 28). Profiling of 188 Group 4 tumours on expression microarrays followed by consensus non-negative matrix factorization (NMF) clustering delineates two subtypes of Group 4 (4a and 4b; Fig. 4e and Supplementary Fig. 29).
Strikingly, 21 out of 22 SNCAIP duplicated cases belonged to Group 4a (P 5 3.12 310
28, Fisher’s exact test). SNCAIP is more highly expressed in Group 4a than 4b (Fig. 4f), and 4a samples with tandem duplication showed approximately 1.5-fold increased expression, con- sistent with gene dosage (Fig. 4g and Supplementary Figs 35 and 36).
Group 4a exhibits a relatively balanced genome compared to 4b (Supplementary Figs 30–32), and several 4a cases harbour SNCAIP duplication in conjunction with i17q and no other SCNAs (Sup- plementary Fig. 33). Importantly, SNCAIP duplications are mutually exclusive from other prominent SCNAs in Group 4, including MYCN and CDK6 amplifications (Supplementary Fig. 34).
PVT1 fusions arise via chromothripsis in Group 3 Although recurrent gene fusions have recently been discovered in solid tumours, none have been reported in medulloblastoma. RNA-Seq of
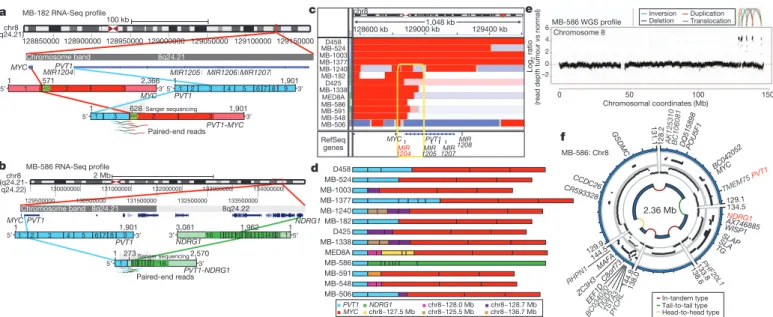
Group 3 tumours (n 5 13) identified two independent gene fusions in two different tumours (MB-182 and MB-586), both involving the 59 end of PVT1, a non-coding gene frequently co-amplified with MYC in Group 3 (Fig. 5a, b, Supplementary Fig. 37 and Supplementary Tables 17 and 18). Sanger sequencing confirmed a fusion transcript consisting of exons 1 and 3 of PVT1 fused to the coding sequence of MYC (exons 2 and 3) in MB-182, and a fusion involving PVT1 exon 1 fused to the 39 end of NDRG1 in MB-586 (Fig. 5a, b).
Group 3 copy number data at the MYC/PVT1 locus indicated that additional samples might harbour PVT1 gene fusions (Fig. 5c). PCR with reverse transcription (RT–PCR) profiling of select Group 3 cases confirmed PVT1-MYC fusions in at least 60% (12/20) of MYC- amplified cases (Fig. 5d and Supplementary Table 19). Fusion transcripts included many other portions of chr8q, with up to four different genomic loci mapping to a single transcript, a pattern remin- iscent of chromothripsis
28,29(Fig. 5d). WGS performed on four MYC- amplified Group 3 tumours harbouring PVT1 fusion transcripts identified a series of complex genomic rearrangements on chr8q (Fig. 5e, f, Supplementary Fig. 38 and Supplementary Tables 20 and 21). Chromosome 8 copy number profile for MB-586 (PVT1- NDRG1) derived from WGS showed that PVT1 and NDRG1 are structurally linked, as predicted by RNA-Seq, and several adjacent regions of 8q24 were extensively rearranged (Fig. 5e, f and Sup- plementary Table 21). Monte Carlo simulation suggests that this fragmented 8q amplicon arose through chromothripsis, a process of erroneous DNA repair following a single catastrophic event in which a chromosome is shattered into many pieces (Supplementary Fig. 39).
Further examination of our copy number data set revealed rare examples of chromothripsis across subgroups (Supplementary Fig. 40), with only chr8 in Group 3 demonstrating statistically significant, region- specific chromothripsis (Q 5 0.0004, false discovery rate (FDR)- corrected Fisher’s exact test). Among Group 3 tumours, the occurrence of chr8q chromothripsis is correlated with deletion of chr17p (location of TP53; data not shown), in keeping with the association of loss of
Group 4 medulloblastoma (n = 317) Mb
121.0121.2121.4121.6121.8122.0122.2122.4122.6
SNCAIP
–1.5 (CN 0.7)
0.0 (CN 2.0)
1.5 (CN 5.7) Log2 copy number ratio
Chromosome 5
a MB-1350 SNP6 profile
Chr5 q23.1 q23.2
01 23 4
Copy number
121.7
Scale chr5:
121.9 Genomic location (Mb)
100 kb 121650000
121700000 121750000
121800000 121850000
121750000 121800000
121850000 RefSeq genes
SNCAIP SNCAIP′
Germline SNCAIP allele Duplicated SNCAIP allele SNCAIP
c
Group 4α SNCAIP duplication:
21/79
Group 4β SNCAIP duplication:
1/109 Cophenetic coefficient = 0.9956 Northcott series (n = 103)
WNT SHH Group 3 Group 4 Subgroup P = 5.713 × 10⁻¹⁶
Log2 SNCAIP expression 6 8 10 12
Genes
t statistics
Value Group 4-high
Group 4-low SNCAIP
10
–10 0
–15 –10
1015 05 –5
d e
Group 4α Group 4β Subtype:
P = 9.314 × 10⁻¹⁴ Group 4 medulloblastoma (n =188)
5 6 7 8 9 10 1 1
Log2 SNCAIP expression
f
MB-374: tandem duplication of 315,249 bp
MB-398: tandem duplication of ~223,850 bp
MB-1350: Tandem duplication of 193,069 bp
Genomic location on chromosome 5 121680803 121996051
~121913700
~121689850
121707031
121400 kb 121600 kb 121800 kb 122000 kb 122200 kb 121900099
10 discordant read-pairs
4 discordant
8 discordant
b
1 –1 0
1 –1 0
1 –1 0
read-pairs
read-pairs
Reads in tumour Reads in tumour Paired-end read
(read depth tumour vs control)Log2 ratio
Duplicated Non-duplicated Group 4α medulloblastoma (n =79)
P = 0.02502 8.5 9.0 9.5 10.0 10.5 11.0
Log2 SNCAIP expression
g
SNCAIP:
LOXZNF474LOC100505841 SNCAIP SNX2 SNX24
Figure 4
|
Tandem duplication ofSNCAIP defines a novel subtype of Group 4. a, Highly recurrent, focal, single-copy gain ofSNCAIPin Group 4.
b, Paired-end mapping verifies recurrent tandem duplication of
SNCAIPin Group 4.
c, Schematic representation ofSNCAIP
tandem duplication.
d,SNCAIPis a Group 4 signature gene. Upper panel,
SNCAIPexpression across subgroups in a published series of 103 primary medulloblastomas. Error bars depict the minimum and maximum values, excluding outliers. Lower panel,
SNCAIPranks among the top 1% (rank, 39th out of 16,758) of highly expressed genes in
Group 4.
e, NMF consensus clustering of 188 expression-profiled Group 4tumours supports two transcriptionally distinct subtypes designated 4a and 4b (cophenetic coefficient5 0.9956). 21 out of 22
SNCAIPduplicated cases belong to Group 4a (P
53.123 10
28, Fisher’s exact test).
f,SNCAIPexpression is significantly elevated in Group 4a versus 4b (P5 9.31
310
214, Mann–
Whitney test).
g, Group 4acases harbouring
SNCAIPduplication exhibit a
,1.5-fold increase inSNCAIPexpression.
f,g, Error bars depict the minimumand maximum values, excluding outliers.
TP53 and chromothripsis recently described in medulloblastoma (P 5 0.0199, Fisher’s exact test)
28. Whereas the PVT1 locus has been suggested to be a genomically fragile site, we observe that the majority of MYC-amplified Group 3 tumours harbour PVT1 fusions that arise through a process consistent with chromothripsis.
PVT1 is a non-coding host gene for four microRNAs, miR-1204–
miR-1207. Previous studies have implicated miR-1204 as a candidate oncogene that enhances oncogenesis in combination with MYC
30,31. PVT1 fusions identified in this study involve only PVT1 exon 1 and miR-1204. Importantly, miR-1204, but not the adjacent miR-1205 and miR-1206, is expressed at a higher level in PVT1-MYC fusion (1) Group 3 tumours compared to fusion (2) cases (P 5 0.0008, Mann–
Whitney test; Fig. 6a). To evaluate whether aberrant expression of miR-1204 contributes to the malignant phenotype, we inhibited miR- 1204 in MED8A cells, a Group 3 medulloblastoma cell line with a confirmed PVT1-MYC fusion (Fig. 5d). Antagomir-mediated RNA
interference of miR-1204 had a pronounced effect on MED8A growth (Fig. 6b). A comparable reduction in proliferative capacity was achieved with knockdown of MYC. Conversely, the medulloblastoma cell line ONS76 exhibits neither MYC amplification nor a detectable PVT1-MYC fusion gene, and knockdown of miR-1204 had no effect in this line (Fig. 6c).
PVT1 has been reported previously in fusion transcripts with a number of partners
30,32,33. The most prevalent form of the PVT1- MYC fusion in Group 3 tumours lacks the first, non-coding exon of MYC, similar to forms of MYC that have been described in Burkitt’s lymphoma
34(Fig. 5a, d). The PVT1 promoter contains two non- canonical E-boxes and can be activated by MYC
31. This indicates a positive feedback model where MYC can reinforce its own expression from the PVT1 promoter in PVT1-MYC fusion (1) tumours. Indeed, knockdown of MYC alone in MED8A cells resulted in diminished expression of both MYC and miR-1204, suggestingMYC may positively regulate PVT1 (that is, miR-1204) expression in medulloblastoma cells (Supplementary Fig. 41).
Discussion
Medulloblastomas have few SNVs compared to many adult epithelial malignancies
11, whereas SCNAs seem to be quite common.
Medulloblastoma is a heterogeneous disease
7, thereby requiring large cohorts to detect subgroup-specific events. Through the accumula- tion of .1,200 medulloblastomas in MAGIC, we have identified novel and significant SCNAs. Many of the significant SCNAs are subgroup-restricted, highly supporting their role as driver events in their respective subgroups.
Expression of synphilin-1 in neuronal cells results in decreased cell doubling time
35, decreased caspase-3 activation
36, decreased TP53 transcriptional activity and messenger RNA levels, and decreased apoptosis
37. Synphilin-1 is ubiquitinated by parkin, which is encoded by the hereditary Parkinson’s disease gene PARK2 (ref. 24), a candidate tumour suppressor gene
38. Whereas patients with Parkinson’s disease have an overall decreased risk of cancer, they may have an increased incidence of brain tumours
39,40. As tandem duplications of SNCAIP are highly recurrent, stereotypical, subgroup-restricted, affect only a single gene, and as SNCAIP-duplicated tumours have few if any other SCNAs, SNCAIP is a probable driver gene, and merits investigation
16
PVT1-NDRG1 Paired-end reads
129500000 130500000 131500000 132500000 133500000 1
MB-182 RNA-Seq profile
MB-586 RNA-Seq profile 3 2
ATG
Paired-end reads
ATG
a
b
Sample Status
D458 chr8
128600 kb 129000 kb1,048 kb
129400 kb MB-524
MB-1003 MB-1377 MB-1240
MB-1338 MED8A MB-586 MB-591 MB-548 MB-506 MB-182 D425
c
MB-1338 D425 MB-182 MB-1240
MB-506 MED8A MB-1377
MB-548 MB-586 MB-1003
MB-591 MB-524 D458
PVT1MYC NDRG1 chr8~127.5 Mb
chr8~128.0 Mb chr8~125.5 Mb
chr8~128.7 Mb chr8~136.7 Mb
d
2.36 Mb 128.2
129.1
133.8 134.5
138.0
138 .6 144.5
144.
8 129.9
131.1
DQ515898
AX746885 BC0420
52
CR593328CCDC26
POU5F1
NDRG1 GSDMC
C8or f73
EEF1D ZC3H3
WISP1
MAFA
AK125 310 BC1060
81
SLAP TMEM75
PVT1
PHF20L1 MYC
RHPN1
SLA
BC03402 0
PYCRL TSTA
3 TIGD
5
TG MB-586: Chr8
In-tandem type Tail-to-tail type Head-to-head type
f e
Chromosome 8
Chromosomal coordinates (Mb)
0 50 100 150
(read depth tumour vs normal)
MB-586 WGS profile
–2 0 2 4 6
Deletion Duplication Inversion
Translocation
Log2 ratio chr8
128850000 128900000 128950000 129000000 129050000 129100000 129150000
MYC
MYC PVT1 NDRG1
MYC PVT1
PVT1-MYC 3′
571 2,366 MIR1205 MIR1206MIR1207 1,901
1
1
MIR1204PVT1 Chromosome band
Chromosome band
8q24.21
8q24.21 (q24.21)
chr8 (q24.21-
100 kb
2 Mb 5′
5′
5′
3′
5′1
5′
3′ 3′
3′
3′
5′
1 628 1,901
3,081 NDRG1
1,962 1
1,901 PVT1 1
1 10 16
273 1
1 3 2 3
2 3 4 5 6 7 8 9
1 2 3 4 5 6 7 8 9
Sanger sequencing
RefSeq genes
MYC 1204MIR 1205MIR
1207MIR 1208MIR PVT1
132000000 133000000 134000000 130000000 131000000
10 8 5 4 2 1 2,570
8q24.22 q24.22)
Sanger sequencing
Figure 5
|
Identification of frequentPVT1-MYC fusion genes in Group 3.a,b, RNA-Seq identifies multiple fusion transcripts driven byPVT1
in Group 3.
Schematics depict the structures of verified
PVT1-MYC(a) and
PVT1-NDRG1(b) fusion genes.
c, Heat map of theMYC/PVT1locus showing a subset of 13
MYC-amplified Group 3 cases subsequently verified to exhibitPVT1gene
fusions (shown in
d). Yellow box highlights the common breakpoint affectingthe first exon/intron of
PVT1, includingmiR-1204.d, Summary ofPVT1fusion transcripts identified in Group 3.
e,f, WGS confirms complex patterns ofrearrangement on chr8q24 in
PVT1fusion (1) Group 3.
a
Relative expression
0 2 4 6 8 10 12 14
P = 0.4389
P = 0.1640
P = 0.0008
0 0.2 0.4 0.6 0.8 1.0
0 24 48 72
Absorbance (490 nm)
Time (h)
Absorbance (490 nm)
Time (h) 0
0.2 0.4 0.6 0.8
0 24 48 72
b
c
MYC-balanced/
fusion (–) MYC-amplified/
fusion (–) MYC-amplified/
fusion (+)
1204 1205 1207 miR
1204 1205 1207 miR
1204 1205 1207 miR
CTL MYC-siRNA miR-1204-antagonist
MED8A
ONS76 CTL MYC-siRNA miR-1204-antagonist
Figure 6
|
Functional synergy betweenmiR-1204 and MYC secondary to PVT1-MYC fusion. a, Quantitative RT–PCR ofPVT1-encoded microRNAsconfirms upregulation of
miR-1204in
PVT1-MYCfusion (1) Group 3 tumours.
MYC-balanced/fusion (2),n5
4;
MYC-amplified/fusion (2),n56;
MYC-amplified/fusion (1),
n58. Error bars represent standard error of the mean
(s.e.m.) and reflect variability among samples.
b,c, Knockdown ofmiR-1204attenuates the proliferative capacity of
PVT1-MYCfusion (1) MED8A
medulloblastoma cells (b) but has no effect on fusion (2) ONS76 cells (c). Error
bars represent the standard deviation (s.d.) of triplicate experiments. CTL, control.
as a target for therapy of Group 4a. Similarly, PVT1 fusion genes are highly recurrent, restricted to Group 3, arise through a chromothripsis- like process, and are the first recurrent translocation reported in medulloblastoma.
We identify a number of highly targetable, recurrent, subgroup- specific SCNAs that could form the basis for future clinical trials (that is, PI3K signalling in SHH, TGF-b signalling in Group 3, and NF-kB signalling in Group 4). Activation of these pathways through alterna- tive, currently unknown genetic and epigenetic events could increase the percentage of patients amenable to targeted therapy. We also identify a number of highly ‘druggable’ events that occur in a minority of cases. The cooperative, global approach of the MAGIC consortium has allowed us to overcome the barrier of intertumoural heterogeneity in an uncommon paediatric tumour, and to identify the relevant and targetable SCNAs for the affected children.
METHODS SUMMARY
All patient samples were obtained with consent as outlined by individual institutional review boards. Genomic DNA was prepared, processed and hybridized to Affymetrix SNP6 arrays according to manufacturer’s instructions.
Raw copy number estimates were obtained in dChip, followed by CBS segmenta- tion in R. SCNAs were identified using GISTIC2 (ref. 13). Driver genes within SCNAs were inferred by integrating matched expressions, literature evidence and other data sets. Pathway enrichment of SCNAs was analysed with g:Profiler and visualized in Cytoscape using Enrichment Map. Fluorescencein situhybridiza- tion (FISH) was performed as described previously8,10. Medulloblastoma subgroup was assigned using a custom nanoString CodeSet as described previ- ously12. Tandem duplication ofSNCAIPwas confirmed by paired-end mapping as previously reported28. RNA was extracted, processed and hybridized to Affymetrix Gene 1.1 ST Arrays as recommended by the manufacturer.
Consensus NMF clustering was performed in GenePattern. Gene fusions were identified from RNA-Seq data using Trans-ABySS. Medulloblastoma cell lines were maintained as described10. Proliferation assays were performed with the Promega CellTiter 96 Assay. Additional methods are detailed in full in Supplementary Methods.
Received 29 February; accepted 14 June 2012.
Published online 25 July 2012.
1. Gajjar, A.et al.Risk-adapted craniospinal radiotherapy followed by high-dose chemotherapy and stem-cell rescue in children with newly diagnosed medulloblastoma (St Jude Medulloblastoma-96): long-term results from a prospective, multicentre trial.Lancet Oncol.7,813–820 (2006).
2. Mabbott, D. J.et al.Serial evaluation of academic and behavioral outcome after treatment with cranial radiation in childhood.J. Clin. Oncol.23,2256–2263 (2005).
3. Cho, Y. J.et al.Integrative genomic analysis of medulloblastoma identifies a molecular subgroup that drives poor clinical outcome.J. Clin. Oncol.29, 1424–1430 (2011).
4. Northcott, P. A.et al.Medulloblastoma comprises four distinct molecular variants.
J. Clin. Oncol.29,1408–1414 (2011).
5. Remke, M.et al. FSTL5is a marker of poor prognosis in non-WNT/non-SHH medulloblastoma.J. Clin. Oncol.29,3852–3861 (2011).
6. Northcott, P. A., Korshunov, A., Pfister, S. M. & Taylor, M. D. The clinical implications of medulloblastoma subgroups.Nature Rev. Neurol.8,340–351 (2012).
7. Taylor, M. D.et al.Molecular subgroups of medulloblastoma: the current consensus.Acta Neuropathol.123,465–472 (2011).
8. Northcott, P. A.et al.Pediatric and adult sonic hedgehog medulloblastomas are clinically and molecularly distinct.Acta Neuropathol.122,231–240 (2011).
9. Rudin, C. M.et al.Treatment of medulloblastoma with hedgehog pathway inhibitor GDC-0449.N. Engl. J. Med.361,1173–1178 (2009).
10. Northcott, P. A.et al.Multiple recurrent genetic events converge on control of histone lysine methylation in medulloblastoma.Nature Genet.41,465–472 (2009).
11. Parsons, D. W.et al.The genetic landscape of the childhood cancer medulloblastoma.Science331,435–439 (2011).
12. Northcott, P. A.et al.Rapid, reliable, and reproducible molecular sub-grouping of clinical medulloblastoma samples.Acta Neuropathol.123,615–626 (2012).
13. Mermel, C. H.et al.GISTIC2.0 facilitates sensitive and confident localization of the targets of focal somatic copy-number alteration in human cancers.Genome Biol.
12,R41 (2011).
14. Buonamici, S.et al.Interfering with resistance to smoothened antagonists by inhibition of the PI3K pathway in medulloblastoma.Sci. Transl. Med.2,51ra70 (2010).
15. Yauch, R. L.et al.Smoothened mutation confers resistance to a hedgehog pathway inhibitor in medulloblastoma.Science326,572–574 (2009).
16. Adamson, D. C.et al.OTX2 is critical for the maintenance and progression of Shh- independent medulloblastomas.Cancer Res.70,181–191 (2010).
17. Jia, S., Wu, D., Xing, C. & Meng, A. Smad2/3 activities are required for induction and patterning of the neuroectoderm in zebrafish.Dev. Biol.333,273–284 (2009).
18. Bizet, A. A.et al.The TGF-bco-receptor, CD109, promotes internalization and degradation of TGF-breceptors.Biochim. Biophys. Acta1813,742–753 (2011).
19. Wang, T., Donahoe, P. K. & Zervos, A. S. Specific interaction of type I receptors of the TGF-beta family with the immunophilin FKBP-12.Science265,674–676 (1994).
20. Parks, W. T.et al.Sorting nexin 6, a novel SNX, interacts with the transforming growth factor-bfamily of receptor serine-threonine kinases.J. Biol. Chem.276, 19332–19339 (2001).
21. Bredel, M.et al. NFKBIAdeletion in glioblastomas.N. Engl. J. Med.364,627–637 (2011).
22. Xiao, N.et al.Ubiquitin-specific protease 4 (USP4) targets TRAF2 and TRAF6 for deubiquitination and inhibits TNFa-induced cancer cell migration.Biochem. J.
441,979–986 (2012).
23. Engelender, S.et al.Synphilin-1 associates witha-synuclein and promotes the formation of cytosolic inclusions.Nature Genet.22,110–114 (1999).
24. Chung, K. K.et al.Parkin ubiquitinates thea-synuclein-interacting protein, synphilin-1: implications for Lewy-body formation in Parkinson disease.Nature Med.7,1144–1150 (2001).
25. Marx, F. P.et al.Identification and functional characterization of a novel R621C mutation in the synphilin-1 gene in Parkinson’s disease.Hum. Mol. Genet.12, 1223–1231 (2003).
26. Beroukhim, R.et al.The landscape of somatic copy-number alteration across human cancers.Nature463,899–905 (2010).
27. Barretina, J.et al.The Cancer Cell Line Encyclopedia enables predictive modelling of anticancer drug sensitivity.Nature483,603–607 (2012).
28. Rausch, T.et al.Genome sequencing of pediatric medulloblastoma links catastrophic DNA rearrangements withTP53mutations.Cell148,59–71 (2012).
29. Stephens, P. J.et al.Massive genomic rearrangement acquired in a single catastrophic event during cancer development.Cell144,27–40 (2011).
30. Shtivelman, E. & Bishop, J. M. ThePVTgene frequently amplifies withMYCin tumor cells.Mol. Cell. Biol.9,1148–1154 (1989).
31. Carramusa, L.et al.The PVT-1 oncogene is a Myc protein target that is overexpressed in transformed cells.J. Cell. Physiol.213,511–518 (2007).
32. Shtivelman, E. & Bishop, J. M. Effects of translocations on transcription fromPVT.
Mol. Cell. Biol.10,1835–1839 (1990).
33. Pleasance, E. D.et al.A small-cell lung cancer genome with complex signatures of tobacco exposure.Nature463,184–190 (2010).
34. Hann, S. R., King, M. W., Bentley, D. L., Anderson, C. W. & Eisenman, R. N. A non-AUG translational initiation in c-mycexon 1 generates an N-terminally distinct protein whose synthesis is disrupted in Burkitt’s lymphomas.Cell52,185–195 (1988).
35. Li, X.et al.Synphilin-1 exhibits trophic and protective effects against Rotenone toxicity.Neuroscience165,455–462 (2010).
36. Smith, W. W.et al.Synphilin-1 attenuates neuronal degeneration in the A53T alpha-synuclein transgenic mouse model.Hum. Mol. Genet.19,2087–2098 (2010).
37. Giaime, E.et al.Caspase-3-derived C-terminal product of synphilin-1 displays antiapoptotic function via modulation of the p53-dependent cell death pathway.
J. Biol. Chem.281,11515–11522 (2006).
38. Veeriah, S.et al.Somatic mutations of the Parkinson’s disease-associated gene PARK2in glioblastoma and other human malignancies.Nature Genet.42,77–82 (2010).
39. Olsen, J. H.et al.Atypical cancer pattern in patients with Parkinson’s disease.Br. J.
Cancer92,201–205 (2005).
40. Moller, H., Mellemkjaer, L., McLaughlin, J. K. & Olsen, J. H. Occurrence of different cancers in patients with Parkinson’s disease.Br. Med. J.310,1500–1501 (1995).
Supplementary Informationis linked to the online version of the paper at www.nature.com/nature.
AcknowledgementsM.D.T. is the recipient of a CIHR Clinician-Scientist Phase II award, and was formerly a Sontag Distinguished Scholar with funds from the Sontag Foundation. Funding is acknowledged from the Pediatric Brain Tumour Foundation (M.D.T. and J.T.R.), and the National Institutes of Health (CA159859 to M.D.T., R.W.R.
and B.W.), The Canadian Cancer Society, Genome Canada, Genome BC, Terry Fox Research Institute, Ontario Institute for Cancer Research, Pediatric Oncology Group Ontario, Funds from ‘The Family of Kathleen Lorette’ and the Clark H. Smith Brain Tumour Centre, Montreal Children’s Hospital Foundation, Hospital for Sick Children:
Sonia and Arthur Labatt Brain Tumour Research Centre, Chief of Research Fund, Cancer Genetics Program, Garron Family Cancer Centre, B.R.A.I.N. Child, CIHR (grant no. ATE-110814); the University of Toronto McLaughlin Centre, CIHR Institute of Cancer Research (grant no. AT1 – 112286) and C17 through the Advancing Technology Innovation through Discovery competition (Project Title: The Canadian Pediatric Cancer Genome Consortium: Translating next-generation sequencing technologies into improved therapies for high-risk childhood cancer). Canada’s Michael Smith Genome Sciences Centre is supported by the BC Cancer Foundation.
J.R. is supported by The Children’s Discovery Institute. P.A.N. was supported by a Restracomp Fellowship (Hospital for Sick Children) and is currently a Roman-Herzog Postdoctoral Fellow (Hertie Foundation). Salary support for L.G. was provided by the Ontario Institute for Cancer Research through funding provided by the Government of Ontario. E.V.G.M. is supported by NIH grants CA86335, CA116804, CA138292, NCI contracts 28XS100 and 29XS193, the Southeastern Brain Tumour Foundation, and the Brain Tumour Foundation for Children. This study includes samples provided by the UK Children’s Cancer and Leukaemia Group (CCLG) as part of CCLG-approved biological study BS-2007-04. J.K. and S.P. were supported by a grant from the German