Common variants in glyoxalase I do not increase chronic pancreatitis risk
Tom Kaune1☯‡, Marcus Hollenbach2☯‡, Bettina Keil1, Jian-Min ChenID3,4, Emmanuelle Masson3,4, Carla Becker1, Marko Damm1, Claudia Ruffert1, Robert Gru¨ tzmann5, Albrecht Hoffmeister2, Rene H. M. te Morsche6, Giulia
Martina Cavestro7, Raffaella Alessia Zuppardo7, Adrian Saftoiu8, Ewa Malecka-Panas9, Stanislaw GłuszekID10, Peter Bugert11, Markus M. LerchID12, Frank Ulrich Weiss12, Wen- Bin Zou13, Zhuan Liao13, Peter Hegyi14,15, Joost PH Drenth6, Jan Riedel1, Claude Fe´rec3,4, Markus ScholzID16,17, Holger KirstenID16,17, Andrea To´ th18, Maren Ewers18, Heiko Witt18, Heidi Griesmann1, Patrick Michl1, Jonas RosendahlID1*
1 Department of Internal Medicine I, Martin Luther University, Halle, Germany, 2 Medical Department II–
Gastroenterology, Hepatology, Infectious Diseases, Pulmonology, University of Leipzig Medical Center, Leipzig, Germany, 3 Institut National de la Sante´ et de la Recherche Me´dicale (INSERM), U1078, Etablissement Franc¸ais du Sang (EFS)–Bretagne, Faculte´ de Me´ decine et des Sciences de la Sante´, Universite´ de Bretagne Occidentale, Brest, France, 4 Laboratoire de Ge´ne´tique Mole´culaire et
d’Histocompatibilite´ , Centre Hospitalier Re´gional Universitaire (CHRU) Brest, Hoˆpital Morvan, Brest, France, 5 Universita¨ tsklinikum Erlangen, Friedrich-Alexander-Universita¨t Erlangen-Nu¨rnberg, Chirurgische Klinik, Erlangen, Germany, 6 Department of Gastroenterology and Hepatology, Radboud umc, Nijmegen, The Netherlands, 7 Gastroenterology and Gastrointestinal Endoscopy Unit, Division of Experimental Oncology, Vita-Salute San Raffaele University, IRCCS Ospedale San Raffaele Scientific Institute, Milan, Italy, 8 Department of Internal Medicine and Gastroenterology, University of Medicine and Pharmacy, Craiova, Romania, 9 Department of Digestive Tract Diseases, Medical University of Ło´dź, Ło´dź, Poland, 10 Faculty of Medicine and Health Sciences, Jan Kochanowski University, Kielce, Poland, 11 Institute of Transfusion Medicine and Immunology, Medical Faculty Mannheim, Heidelberg University, German Red Cross Blood Service of Baden-Wu¨ rttemberg, Mannheim, Germany, 12 Department of Medicine A, University Medicine Greifswald, Greifswald, Germany, 13 Department of Gastroenterology, Changhai Hospital, Second Military Medical University, Shanghai Institute of Pancreatic Diseases, Shanghai, China, 14 Institute for Translational Medicine and First Department of Internal Medicine, Medical School, University of Pe´cs, Pe´cs, Hungary, 15 HAS-SZTE, Momentum Gastroenterology Multidisciplinary Research Group, Szeged, Hungary, 16 Institute for Medical Informatics, Statistics and Epidemiology, University of Leipzig, Leipzig, Germany, 17 LIFE- Leipzig Research Center for Civilization Diseases, University of Leipzig, Leipzig, Germany, 18 Else Kro¨ner-Fresenius-Zentrum fu¨r Erna¨ hrungsmedizin (EKFZ), Paediatric Nutritional Medicine, Technische Universita¨ t Mu¨nchen (TUM), Freising, Germany
☯These authors contributed equally to this work.
‡ These authors are joint first authors on this work.
*jonas.rosendahl@uk-halle.de
Abstract
Introduction
Chronic pancreatitis (CP) may be caused by oxidative stress. An important source of reac- tive oxygen species (ROS) is the methylglyoxal-derived formation of advanced glycation endproducts (AGE). Methylglyoxal is detoxified by Glyoxalase I (GLO1). A reduction in GLO1 activity results in increased ROS. Single nucleotide polymorphisms (SNPs) of GLO1 have been linked to various inflammatory diseases. Here, we analyzed whether common GLO1 variants are associated with alcoholic (ACP) and non-alcoholic CP (NACP).
a1111111111 a1111111111 a1111111111 a1111111111 a1111111111
OPEN ACCESS
Citation: Kaune T, Hollenbach M, Keil B, Chen J-M, Masson E, Becker C, et al. (2019) Common variants in glyoxalase I do not increase chronic pancreatitis risk. PLoS ONE 14(10): e0222927.
https://doi.org/10.1371/journal.pone.0222927 Editor: Pavel Strnad, Medizinische Fakultat der RWTH Aachen, GERMANY
Received: June 10, 2019 Accepted: September 10, 2019 Published: October 29, 2019
Copyright:©2019 Kaune et al. This is an open access article distributed under the terms of the Creative Commons Attribution License, which permits unrestricted use, distribution, and reproduction in any medium, provided the original author and source are credited.
Data Availability Statement: All relevant data are within the manuscript and its Supporting Information files.
Funding: The authors thank all study participants for providing clinical data and blood samples. This work was supported by the Deutsche
Forschungsgemeinschaft (DFG) grants RO 3929/1- 1, RO 3929/2-1 & RO3929/5-1 (to J.Ro.), Wi 2036/
2-2 & Wi 2036/2-3 (to H.W.), and by a grant of the Colora Stiftung gGmbH (to J.Ro.), the Else Kro¨ner- Fresenius-Foundation (EKFS) (to H.W.), by grants of the European Regional Development Fund
Methods
Using melting curve analysis, we genotyped a screening cohort of 223 ACP, 218 NACP patients, and 328 controls for 11 tagging SNPs defined by the SNPinfo LD TAG SNP Selec- tion tool and the functionally relevant variant rs4746. For selected variants the cohorts were extended to up to 1,441 patient samples.
Results
In the ACP cohort, comparison of genotypes for rs1937780 between patients and controls displayed an ambiguous result in the screening cohort (p = 0.08). However, in the extended cohort of 1,441 patients no statistically significant association was found for the comparison of genotypes (p = 0.11), nor in logistic regression analysis (p = 0.214, OR 1.072, 95% CI 0.961–1.196). In the NACP screening cohort SNPs rs937662, rs1699012, and rs4746 dis- played an ambiguous result when patients were compared to controls in the recessive or dominant model (p = 0.08, 0.08, and 0.07, respectively). Again, these associations were not confirmed in the extended cohorts (rs937662, dominant model: p = 0.07, logistic regression:
p = 0.07, OR 1.207, 95% CI 0.985–1.480) or in the replication cohorts for rs4746 (Germany, p = 0.42, OR 1.080, 95% CI 0.673–1.124; France, p = 0.19, OR 0.90, 95% CI 0.76–1.06;
China, p = 0.24, OR 1.18, 95% CI 0.90–1.54) and rs1699012 (Germany, Munich; p = 0.279, OR 0.903, 95% CI 0.750–1.087).
Conclusions
Common GLO1 variants do not increase chronic pancreatitis risk.
Introduction
Chronic pancreatitis (CP) is a recurring inflammation of the pancreas with progressive fibrosis by tissue destruction that in some patients results in exocrine and endocrine pancreatic insuffi- ciency [1]. Several studies have identified that the underlying pathomechanisms can range from premature intrapancreatic activation of proteases to local and systemic inflammatory processes, which are relevant for the initiation and progression of the disease [2]. Recently, it was demonstrated that oxidative stress (ROS) is involved in these inflammatory and fibrotic processes [3–5]. As advanced-glycation-end products (AGE) impact on ROS, they may con- tribute to CP development [6] as it was shown in acute pancreatitis [7].
“Dicarbonyl stress” indicates a cellular condition whereα-oxoaldehyde metabolites accu- mulate, leading to an increased modification of protein and DNA which contribute to cellular dysfunction in ageing and disease. “Dicarbonyl stress” is mainly caused by methylglyoxal (MGO) that is formed as a by-product in glycolysis [8], ketone body metabolism and threonine catabolism [9–11]. MGO is highly reactive with nucleotides, phospholipids and proteins [12,13] with the result of a rapid formation of AGE. In addition, reducing sugars like glucose react with amino groups and trigger MGO formation and AGE generation in a non-enzymatic protein glycation within the Maillard reaction [6]. AGE themselves induce several detrimental processes on a cellular level and furthermore activate different signaling pathways via the RAGE receptor. Moreover, they induce ROS and have been associated with various disease entities [14].
(ERDF) V-630-F-150-2012/133 and V630-S-150- 2012/132 (to F.U.W), LIFE is funded by means of the European Union, by the European Regional Development Fund (ERDF) and by funds of the Free State of Saxony within the framework of the excellence initiative (project numbers 713-241202, 14505/2470, 14575/2470) to M.S. and H.K. We acknowledge the support from the German Research Foundation (DFG) and University of Leipzig (to M.H.) within the program of Open Access Publishing. The study was also supported by the Economic Development and Innovation Operative Programme Grant GINOP 2.3.2-15- 2016-00048 (to P.H.). The funders had no role in study design, data collection and analysis, decision to publish, or preparation of the manuscript.
Competing interests: The authors have declared that no competing interests exist.
Abbreviations: ACP, alcoholic chronic pancreatitis;
CI, confidence interval; CP, chronic pancreatitis;
GLO1, Glyoxalase-; HWE, Hardy-Weinberg- disequilibrium; NACP, non-alcoholic chronic pancreatitis; OR, odds ratio; PCR, polymerase chain reaction; ROS, reactive oxygen species; SNP, single nucleotide polymorphism.
For protection on the cellular level MGO is detoxified by the Glyoxalase system. Glyoxalase I (GLO1) catalyzes the conversion ofα-oxo-aldehydes such as MGO and L-glutathione (GSH) to form the corresponding hemithioacethal S-D-lactoylglutathione [15]. In the next step, hydroxyacyl glutathione hydrolase (GLO2) converts S-D-Lactoylglutathione to D-lactate and GSH. Herein, GLO1 is the rate-limiting enzyme in this series of reactions [16].
Thus far,GLO1single nucleotide polymorphisms (SNPs) were associated with distinct inflammatory diseases. Thers4746(p.Ala111Glu) variant displayed a decrease of GLO1 enzy- matic activity for theA-allele in lymphoblastoid cells of the brain [17,18]. In addition,rs4746 has been linked to diabetes [19], atherosclerosis [20], chronic renal failure [21], vascular dis- eases [22,23], neuropsychiatric disorders [24,25], and different cancer types [26–29]. More- over,rs1130534(c.372A>T, p.Gly124 = ) andrs1049346were correlated with lower enzyme activity, but did not associate with vascular complications in diabetes mellitus [30].
In conclusion,GLO1variants with a diminished GLO1 activity cause increased MGO levels and consecutive ROS generation. Therefore, we reasoned thatGLO1SNPs contribute to the development of CP and investigated whether genetic variants inGLO1are associated with alcoholic CP (ACP) or non-alcoholic CP (NACP).
Material and methods Patients and controls
The study was approved by the medical ethical review committee of the Martin-Luther-Uni- versity of Halle-Wittenberg (Medical ethical committee, University Halle-Wittenberg, Medical Faculty, Bearbeitungsnummer 2015–106, date: 22.01.2016, title: “Erforschung molekulargen- etischer Ursachen von Pankreaserkrankungen”). All patients gave written informed consent.
The diagnosis of CP was based on two or more of the following findings: history of recurrent acute pancreatitis or recurrent or persisting abdominal pain typical for CP, pancreatic calcifi- cations and/or pancreatic ductal irregularities indicated by computed tomography imaging, magnetic resonance imaging, endoscopic retrograde pancreaticography or (endo)sonography of the pancreas and/or the diagnosis of exocrine pancreatic insufficiency [31].
ACP was diagnosed in patients with a history of chronic alcohol intake (>80 g per day for males or>60 g per day for females) for more than 2 years. NACP was diagnosed in the absence of known precipitating factors as alcohol consumption and/or smoking. Patients with a posi- tive family history were included in the NACP group. The data on past ethanol consumption and the clinical presentation were based on research records and/or physician’s history and/or completion of a detailed questionnaire by the patient.
Patients and Controls were recruited throughout Germany and in the European centres in The Netherlands, Romania, Poland, Italy, and Hungary. Controls were blood donors and healthy volunteers as described in our former publications [32].
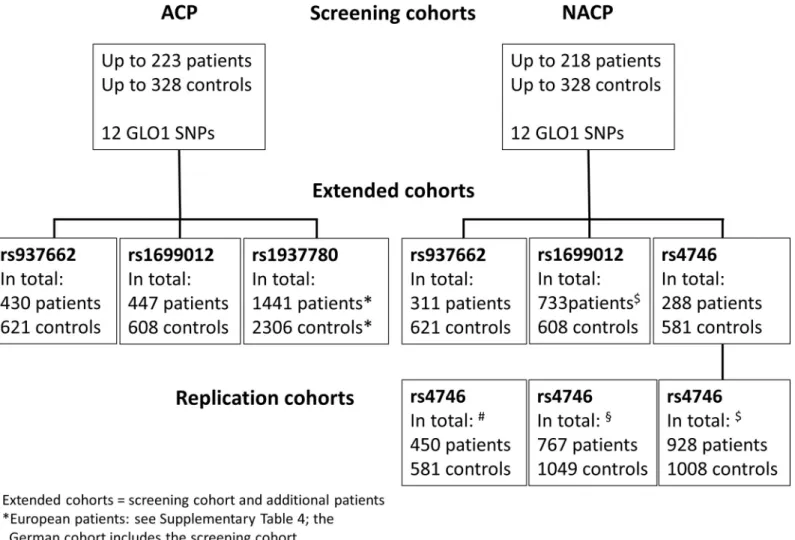
In the screening cohort we investigated 223 ACP, 218 NACP patients, and 328 controls for 12 commonGLO1SNPs with a minor allele frequency of a least 5%. Variants with nominal significance according to uncorrected p-values (rs1699012,rs937662,rs4746, andrs1937780) were analyzed in further subjects (extended cohorts). In addition, we screened European ACP cohorts forrs1937780and an additional German, French, and Chinese NACP cohort for rs4746and an independent German NACP cohort forrs1699012(see flow chart inFig 1). For a detailed description of the screening cohort and the extended cohorts seeTable 1.
Selection of tagging SNPs in theGLO1locus
We selected 11 tagging SNPs in theGLO1locus using the SNPinfo LD TAG SNP Selection tool (LD map Figure A inS1 File). For this purpose we used an LD threshold of 0.8, a
minimum of one SNP tagged, a minimum of 5 valid genotypes to calculate LD in populations with European ancestry (CEU) and extended the region of interest by 10.000 bp in the 5’- region and the 3’-region. In addition, we analyzed SNPrs4746that was described to be func- tionally relevant [17,18]. The other functionally relevant SNPsrs1049346andrs1130534were tagged byrs1621788andrs13212218, respectively. Details on the selected SNPs are summa- rized in Table A inS1 File.
DNA extraction and SNP genotyping
DNA was isolated from EDTA blood using a commercial system (QIAamp Blood DNA Mini Kit; Qiagen, Hilden, Germany). Polymerase chain reaction (PCR) was conducted using One- Taq12X Master Mix (NEB) with 200μM dNTPs, 1.8 mM MgCl2and 0.1μM forward primer as well as 0.1μM reverse primer (0.4μM forward primer forrs3778443andrs17544798;
0.2μM reverse primer forrs4746) in a total volume of 25μl. Cycle conditions were an initial denaturation at 95˚C for 5 minutes followed by 45 cycles of 20 seconds denaturation at 95˚C,
Fig 1. Flowchart of patients analyzed in this study. Note that the extended cohorts comprise the screening cohort and novel patients for all German patients (SNPs rs937662,rs1937780, andrs4746). Forrs1699012the numbers summarize the extended with the replication cohort from Munich. The European cohorts (rs1937780) and the German, French, and Chinese replication cohorts forrs4746are additional patients.
https://doi.org/10.1371/journal.pone.0222927.g001
40 seconds annealing (Table B inS1 File), 90 seconds primer extension at 72˚C followed by final extension for 5 minutes at 72˚C in an automated thermal cycler. Primers and probes (Table B inS1 File) were synthesized by TIB Molbiol (Berlin, Germany). Genotyping was per- formed using the LightCycler4801system (Roche Diagnostics).
Probe oligomers were diluted in H2O to a concentration of 200 nM. For genotyping we used the PCR products from standard PCR (see above) with 50 nM (final) of probe oligomers followed by melting curve analysis with the following protocol: 95˚C for 60 seconds, 40˚C for 60 seconds, continuous increase to 70˚C with various ramp rates (0.29˚C/srs12198212and rs1621788, 0.14˚C/srs17544798,rs132212218andrs937662, 0.19˚C/s for the other seven SNPs). Call rates for all SNPs were>95%. For quality control 2.6% of all samples were geno- typed in duplicates blinded to the investigator. Resulting concordance rate was 99.7%.
Statistical analysis
Quality of SNP genotypes was assessed by study-wise call rate and exact test for Hardy-Wein- berg disequilibrium (HWE) in patients and controls. We compared the results for genotype
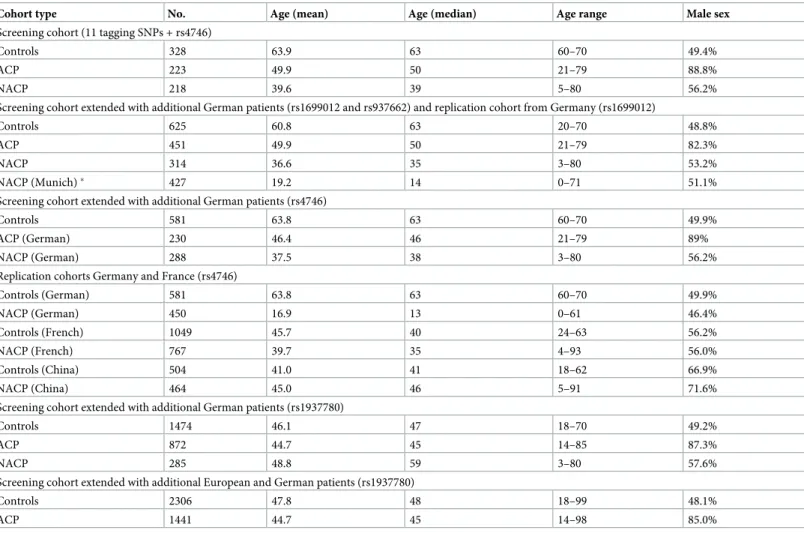
Table 1. Description of the cohorts included in the analysis.
Cohort type No. Age (mean) Age (median) Age range Male sex
Screening cohort (11 tagging SNPs + rs4746)
Controls 328 63.9 63 60–70 49.4%
ACP 223 49.9 50 21–79 88.8%
NACP 218 39.6 39 5–80 56.2%
Screening cohort extended with additional German patients (rs1699012 and rs937662) and replication cohort from Germany (rs1699012)
Controls 625 60.8 63 20–70 48.8%
ACP 451 49.9 50 21–79 82.3%
NACP 314 36.6 35 3–80 53.2%
NACP (Munich)� 427 19.2 14 0–71 51.1%
Screening cohort extended with additional German patients (rs4746)
Controls 581 63.8 63 60–70 49.9%
ACP (German) 230 46.4 46 21–79 89%
NACP (German) 288 37.5 38 3–80 56.2%
Replication cohorts Germany and France (rs4746)
Controls (German) 581 63.8 63 60–70 49.9%
NACP (German) 450 16.9 13 0–61 46.4%
Controls (French) 1049 45.7 40 24–63 56.2%
NACP (French) 767 39.7 35 4–93 56.0%
Controls (China) 504 41.0 41 18–62 66.9%
NACP (China) 464 45.0 46 5–91 71.6%
Screening cohort extended with additional German patients (rs1937780)
Controls 1474 46.1 47 18–70 49.2%
ACP 872 44.7 45 14–85 87.3%
NACP 285 48.8 59 3–80 57.6%
Screening cohort extended with additional European and German patients (rs1937780)
Controls 2306 47.8 48 18–99 48.1%
ACP 1441 44.7 45 14–98 85.0%
Note: The extended cohorts comprise the initial screening cohort and additional patients.
�Independent German replication cohort from Munich forrs1699012. Abbreviations: No., number of individuals; ACP, alcoholic chronic pancreatitis; NACP, non- alcoholic chronic pancreatitis.
https://doi.org/10.1371/journal.pone.0222927.t001
frequencies of the different polymorphisms between patient cohorts and control populations with the Chi-square test and logistic binary regression. All other models (dominant, recessive, allele frequencies) were computed by using two-tailed Fisher’s Exact test. P-values were calcu- lated using IBM SPSS Statistics 25 and GraphPad Prism 5. A p-value of less than 0.05 was con- sidered to be significant. When a significant or nominal significant association was found, at least an extended or one replication cohort was screened.
Results
No study-wide significant association of GLO1 SNPs with ACP
We identified no significant association in logistic regression analysis and no significant differ- ence in the genotype distribution in the ACP screening cohort compared to controls (Table 2 and Table C inS1 File). As forrs937662the HWE was nominal significant in our controls (p = 0.047) and for bothrs937662andrs1699012nominal significant results were observed in the NACP screening cohort in the dominant or recessive model (p = 0.08, respectively) we extended our analysis in the ACP cohort to 430 and 447 patients. Here, we found no associa- tion for both SNPs and no deviation from HWE forrs937662in the controls (p = 0.38; con- trols) (Table 3). Furthermore, genotype data ofrs1937780displayed a borderline significance in the screening cohort (p = 0.08). Again, we extended our investigated groups and analysed rs1937780in a further German ACP cohort and additional European ACP patients from The Netherlands, Hungary, Italy, Romania and Poland. In the German cohort (n = 872) compared to controls (n = 1,474) the association was statistically significant (p = 0.003) as the genotype distribution between ACP patients and controls differed (GG: 40.0% vs. 33.1%; GA 45.9% vs.
51.6%; AA 14.1% vs. 15.3%) (Table D inS1 File). Of note, there was a deviation from HWE in the controls of the extended German cohort (p = 0.01). However, we did not find a significant association in logistic regression analysis (p = 0.134, odds ratio (OR) OR 1.117, 95% confi- dence interval (95% CI) 0.966–1.290) for this cohort. Otherwise, in the overall cohort of Euro- pean ACP patients and controls we found no significant association in logistic regression analysis either (p = 0.214, OR 1.075, 95% CI 0.961–1.196) (Table E inS1 File). This result was
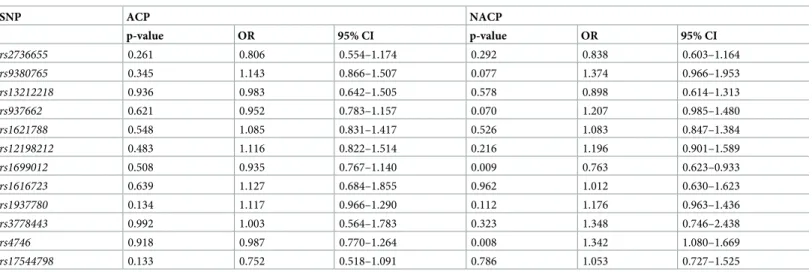
Table 2. Binary logistic regression results of theGLO1single nucleotide polymorphisms in patients with alcoholic and non-alcoholic chronic pancreatitis with covariate sex.
SNP ACP NACP
p-value OR 95% CI p-value OR 95% CI
rs2736655 0.261 0.806 0.554–1.174 0.292 0.838 0.603–1.164
rs9380765 0.345 1.143 0.866–1.507 0.077 1.374 0.966–1.953
rs13212218 0.936 0.983 0.642–1.505 0.578 0.898 0.614–1.313
rs937662 0.621 0.952 0.783–1.157 0.070 1.207 0.985–1.480
rs1621788 0.548 1.085 0.831–1.417 0.526 1.083 0.847–1.384
rs12198212 0.483 1.116 0.822–1.514 0.216 1.196 0.901–1.589
rs1699012 0.508 0.935 0.767–1.140 0.009 0.763 0.623–0.933
rs1616723 0.639 1.127 0.684–1.855 0.962 1.012 0.630–1.623
rs1937780 0.134 1.117 0.966–1.290 0.112 1.176 0.963–1.436
rs3778443 0.992 1.003 0.564–1.783 0.323 1.348 0.746–2.438
rs4746 0.918 0.987 0.770–1.264 0.008 1.342 1.080–1.669
rs17544798 0.133 0.752 0.518–1.091 0.786 1.053 0.727–1.525
Abbreviations: SNP, single-nucleotide polymorphism; OR, Odds ratio; CI, confidence interval; ACP, alcoholic chronic pancreatitis; NACP, non-alcoholic chronic pancreatitis.
https://doi.org/10.1371/journal.pone.0222927.t002
confirmed for the corresponding genotype data and none of the five replication cohorts dem- onstrated a statistically significant association in the different genetic models used for compu- tations (Table 4and Tables D and E inS1 File). Except for the named SNPs and SNP rs2736655(ACP patients p = 0.026), all SNPs corresponded to the HWE.
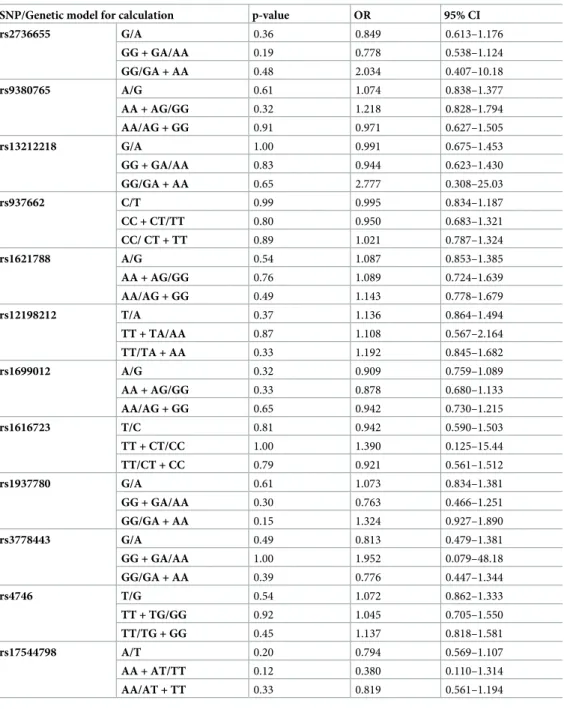
Table 3. Data of the analysedGLO1SNPs in patients with alcoholic chronic pancreatitis (ACP) and controls. For the calculations different genetic models were used.
SNP/Genetic model for calculation p-value OR 95% CI
rs2736655 G/A 0.36 0.849 0.613–1.176
GG + GA/AA 0.19 0.778 0.538–1.124
GG/GA + AA 0.48 2.034 0.407–10.18
rs9380765 A/G 0.61 1.074 0.838–1.377
AA + AG/GG 0.32 1.218 0.828–1.794
AA/AG + GG 0.91 0.971 0.627–1.505
rs13212218 G/A 1.00 0.991 0.675–1.453
GG + GA/AA 0.83 0.944 0.623–1.430
GG/GA + AA 0.65 2.777 0.308–25.03
rs937662 C/T 0.99 0.995 0.834–1.187
CC + CT/TT 0.80 0.950 0.683–1.321
CC/ CT + TT 0.89 1.021 0.787–1.324
rs1621788 A/G 0.54 1.087 0.853–1.385
AA + AG/GG 0.76 1.089 0.724–1.639
AA/AG + GG 0.49 1.143 0.778–1.679
rs12198212 T/A 0.37 1.136 0.864–1.494
TT + TA/AA 0.87 1.108 0.567–2.164
TT/TA + AA 0.33 1.192 0.845–1.682
rs1699012 A/G 0.32 0.909 0.759–1.089
AA + AG/GG 0.33 0.878 0.680–1.133
AA/AG + GG 0.65 0.942 0.730–1.215
rs1616723 T/C 0.81 0.942 0.590–1.503
TT + CT/CC 1.00 1.390 0.125–15.44
TT/CT + CC 0.79 0.921 0.561–1.512
rs1937780 G/A 0.61 1.073 0.834–1.381
GG + GA/AA 0.30 0.763 0.466–1.251
GG/GA + AA 0.15 1.324 0.927–1.890
rs3778443 G/A 0.49 0.813 0.479–1.381
GG + GA/AA 1.00 1.952 0.079–48.18
GG/GA + AA 0.39 0.776 0.447–1.344
rs4746 T/G 0.54 1.072 0.862–1.333
TT + TG/GG 0.92 1.045 0.705–1.550
TT/TG + GG 0.45 1.137 0.818–1.581
rs17544798 A/T 0.20 0.794 0.569–1.107
AA + AT/TT 0.12 0.380 0.110–1.314
AA/AT + TT 0.33 0.819 0.561–1.194
The different models comprise (order from top to bottom), allele frequencies, the dominant and the recessive model for computations. The number of patients and the genotype distribution of each variant are summarized in Table C inS1 File. Note: Forrs937662andrs1699012the extended German cohorts have been used for computations.
Calculations were performed using the Fisher’s exact test. Abbreviations: OR = odds ratio, 95% CI = 95% confidence interval.
https://doi.org/10.1371/journal.pone.0222927.t003
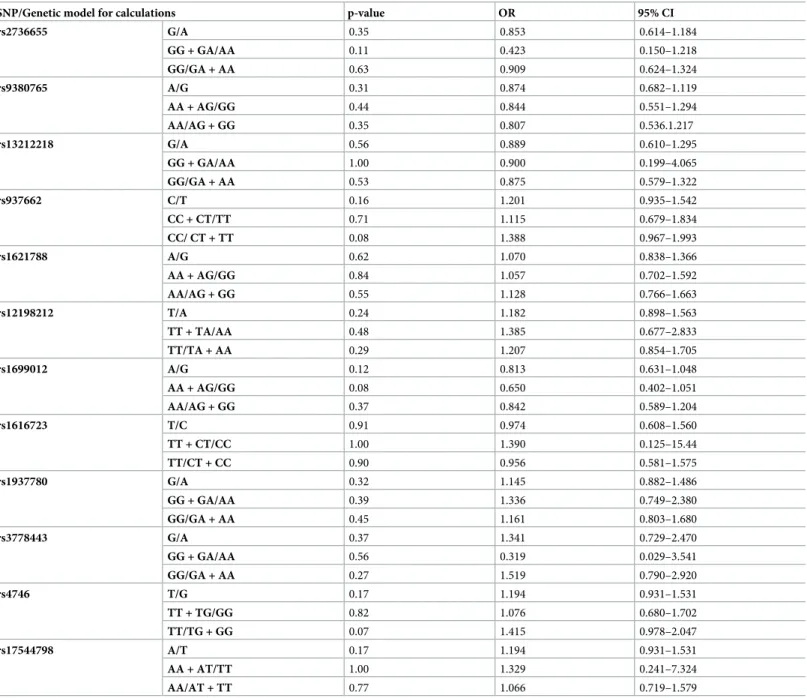
No study-wide significant association of GLO1 SNPs with NACP
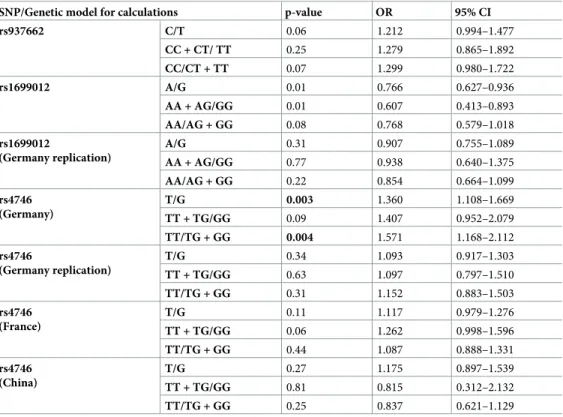
In the screening cohort the SNPsrs937662,rs1699012, andrs4746displayed a nominal signifi- cant difference in the recessive or dominant model (p = 0.08, 0.08, and 0.07, respectively) (Table 5). Otherwise, no differences in the genotype distributions were observed (Table F in S1 File). Furthermore, we detected a significant association for SNPrs1699012(p = 0.009, OR 0.763, 95% CI 0.623–0.933) andrs4746(p = 0.008, OR 1.342, 95% CI 1.080–1.669) in logistic regression analysis (Table 2). To elucidate a potential association, we extended the German NACP cohort and found no statistically significant association of the genotype distribution for rs937662(p = 0.15), whereasrs1699012andrs4746still displayed a significant association com- pared to controls (p = 0.02 and p = 0.008, respectively) (Table G inS1 File). Therefore, we investigatedrs4746in an independent German (n = 450, patients; n = 581, controls), French (n = 767, patients; n = 1,049, controls), and Chinese (n = 928, patients; n = 1,008, controls) NACP cohort. Here, no association was found in all three replication cohorts (Table 6; for genotype distribution see Table G inS1 File). Finally, for SNPrs1699012we observed no sig- nificant association (p = 0.279, OR 0.903, 95% CI 0.750–1.087) in an independent German NACP cohort of 427 patients in logistic regression analysis (for different genetic models see Table 6). For the rare SNPrs3778443we observed a significant HWE (p = 0.002).
Discussion
There is a biological plausibility that GLO1 is relevant in inflammatory processes and as such for the development of CP, although conflicting results have been reported in other diseases
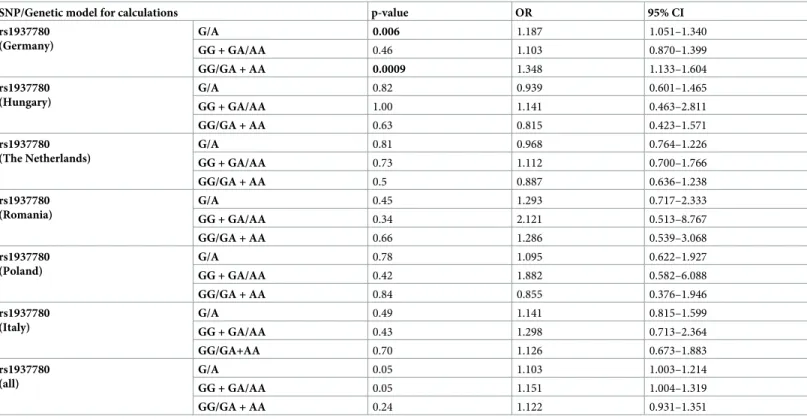
Table 4. Data of the European alcoholic chronic pancreatitis (ACP) replication cohorts for rs1937780 in comparison to controls. Calculations were performed with different genetic models.
SNP/Genetic model for calculations p-value OR 95% CI
rs1937780 (Germany)
G/A 0.006 1.187 1.051–1.340
GG + GA/AA 0.46 1.103 0.870–1.399
GG/GA + AA 0.0009 1.348 1.133–1.604
rs1937780 (Hungary)
G/A 0.82 0.939 0.601–1.465
GG + GA/AA 1.00 1.141 0.463–2.811
GG/GA + AA 0.63 0.815 0.423–1.571
rs1937780 (The Netherlands)
G/A 0.81 0.968 0.764–1.226
GG + GA/AA 0.73 1.112 0.700–1.766
GG/GA + AA 0.5 0.887 0.636–1.238
rs1937780 (Romania)
G/A 0.45 1.293 0.717–2.333
GG + GA/AA 0.34 2.121 0.513–8.767
GG/GA + AA 0.66 1.286 0.539–3.068
rs1937780 (Poland)
G/A 0.78 1.095 0.622–1.927
GG + GA/AA 0.42 1.882 0.582–6.088
GG/GA + AA 0.84 0.855 0.376–1.946
rs1937780 (Italy)
G/A 0.49 1.141 0.815–1.599
GG + GA/AA 0.43 1.298 0.713–2.364
GG/GA+AA 0.70 1.126 0.673–1.883
rs1937780 (all)
G/A 0.05 1.103 1.003–1.214
GG + GA/AA 0.05 1.151 1.004–1.319
GG/GA + AA 0.24 1.122 0.931–1.351
The different models comprise (order from top to bottom), allele frequencies, the dominant and the recessive model for computations. The number of patients and the genotype distribution of each variant are summarized in Table D inS1 File. Note, the German cohort used here comprises the screening cohort and further samples.
Calculations were performed using the Fisher’s exact test. Abbreviations: OR = odds ratio, 95% CI = 95% confidence interval.
thus far. In this work, we investigated a potential genetic association ofGLO1variants with ACP and NACP. We failed to identify an association between CP and one functionally relevant variant and 11 tagging SNPs covering theGLO1locus.
In our German ACP patients (total cohort)rs1937780genotypes differed significantly between patients and controls (p = 0.003) and significance was also observed in the dominant model. Contrary, we found neither an association nor a comparable trend in the distinct
Table 5. Data of the analysedGLO1SNPs in patients with non-alcoholic chronic pancreatitis (NACP) and controls. For the calculations different genetic models were used.
SNP/Genetic model for calculations p-value OR 95% CI
rs2736655 G/A 0.35 0.853 0.614–1.184
GG + GA/AA 0.11 0.423 0.150–1.218
GG/GA + AA 0.63 0.909 0.624–1.324
rs9380765 A/G 0.31 0.874 0.682–1.119
AA + AG/GG 0.44 0.844 0.551–1.294
AA/AG + GG 0.35 0.807 0.536.1.217
rs13212218 G/A 0.56 0.889 0.610–1.295
GG + GA/AA 1.00 0.900 0.199–4.065
GG/GA + AA 0.53 0.875 0.579–1.322
rs937662 C/T 0.16 1.201 0.935–1.542
CC + CT/TT 0.71 1.115 0.679–1.834
CC/ CT + TT 0.08 1.388 0.967–1.993
rs1621788 A/G 0.62 1.070 0.838–1.366
AA + AG/GG 0.84 1.057 0.702–1.592
AA/AG + GG 0.55 1.128 0.766–1.663
rs12198212 T/A 0.24 1.182 0.898–1.563
TT + TA/AA 0.48 1.385 0.677–2.833
TT/TA + AA 0.29 1.207 0.854–1.705
rs1699012 A/G 0.12 0.813 0.631–1.048
AA + AG/GG 0.08 0.650 0.402–1.051
AA/AG + GG 0.37 0.842 0.589–1.204
rs1616723 T/C 0.91 0.974 0.608–1.560
TT + CT/CC 1.00 1.390 0.125–15.44
TT/CT + CC 0.90 0.956 0.581–1.575
rs1937780 G/A 0.32 1.145 0.882–1.486
GG + GA/AA 0.39 1.336 0.749–2.380
GG/GA + AA 0.45 1.161 0.803–1.680
rs3778443 G/A 0.37 1.341 0.729–2.470
GG + GA/AA 0.56 0.319 0.029–3.541
GG/GA + AA 0.27 1.519 0.790–2.920
rs4746 T/G 0.17 1.194 0.931–1.531
TT + TG/GG 0.82 1.076 0.680–1.702
TT/TG + GG 0.07 1.415 0.978–2.047
rs17544798 A/T 0.17 1.194 0.931–1.531
AA + AT/TT 1.00 1.329 0.241–7.324
AA/AT + TT 0.77 1.066 0.719–1.579
The different models comprise (order from top to bottom), allele frequencies, the dominant and the recessive model for computations. The number of patients and the genotype distribution of each variant are summarized in Table F inS1 File. Calculations were performed using the Fisher’s exact test. Abbreviations: OR = odds ratio, 95% CI = 95% confidence interval.
https://doi.org/10.1371/journal.pone.0222927.t005
European cohorts. The same variant has recently been investigated in pancreatic cancer patients and an association was absent [33]. As functional consequences of this variant are unknown and overall genetic data are statistically not significant, it is unlikely thatrs1937780 plays a prominent role in CP development.
In the NACP cohort the three variantsrs937662,rs1699012, andrs4746showed borderline significant results in distinct analysis models that, however, were not confirmed in the
extended or replication cohorts. For the variantsrs937662andrs1699012no prior clinical rele- vance has been reported and therefore an association with CP is again unlikely. Contrary, rs4746was associated with a wide spectrum of disorders ranging from diabetes [19], athero- sclerosis [20], chronic renal failure [21], vascular diseases [22,34], neuropsychiatric disorders [24,25], and even to cancer [26–29]. In our work the borderline significance of the screening cohort was disproved in three large NACP cohorts from Germany, France, and China. As such, although, a functional relevance for this variant has been reported, our data show no association with CP.
We investigated cohorts with a reasonable number of patients and extended these cohorts whenever statistically or nominal significant results were obtained. Therefore, a prominent disease association ofGLO1variants with CP can be ruled out with high certainty. Neverthe- less, our approach is not capable of identifying rare associating variants. We therefore analyzed
Table 6. Data of the replication cohorts ofGLO1SNPsrs937662,rs1699012,rs4746in patients with non-alcoholic chronic pancreatitis (NACP) and controls. For computations different genetic models were used.
SNP/Genetic model for calculations p-value OR 95% CI
rs937662 C/T 0.06 1.212 0.994–1.477
CC + CT/ TT 0.25 1.279 0.865–1.892
CC/CT + TT 0.07 1.299 0.980–1.722
rs1699012 A/G 0.01 0.766 0.627–0.936
AA + AG/GG 0.01 0.607 0.413–0.893
AA/AG + GG 0.08 0.768 0.579–1.018
rs1699012
(Germany replication)
A/G 0.31 0.907 0.755–1.089
AA + AG/GG 0.77 0.938 0.640–1.375
AA/AG + GG 0.22 0.854 0.664–1.099
rs4746 (Germany)
T/G 0.003 1.360 1.108–1.669
TT + TG/GG 0.09 1.407 0.952–2.079
TT/TG + GG 0.004 1.571 1.168–2.112
rs4746
(Germany replication)
T/G 0.34 1.093 0.917–1.303
TT + TG/GG 0.63 1.097 0.797–1.510
TT/TG + GG 0.31 1.152 0.883–1.503
rs4746 (France)
T/G 0.11 1.117 0.979–1.276
TT + TG/GG 0.06 1.262 0.998–1.596
TT/TG + GG 0.44 1.087 0.888–1.331
rs4746 (China)
T/G 0.27 1.175 0.897–1.539
TT + TG/GG 0.81 0.815 0.312–2.132
TT/TG + GG 0.25 0.837 0.621–1.129
The different models comprise (order from top to bottom), allele frequencies, the dominant and the recessive model for computations. The number of patients and the genotype distribution of each variant are summarized in Table G inS1 File. Note, forrs937662,rs1699012, andrs4746the extended German cohorts comprise the screening cohort and further German samples. Forrs1699012the replication cohort from Munich is displayed. Calculations were performed using the Fisher’s exact test. Abbreviations: OR = odds ratio, 95% CI = 95% confidence interval.
https://doi.org/10.1371/journal.pone.0222927.t006
whole exome sequencing data from an ongoing project but did not identify rare variants enriched in our NACP patients (unpublished data). Nonetheless, our study is limited in its restriction to a Caucasian (German) cohort as only one SNP was analyzed in an Asian replica- tion cohort and therefore we may have missed specific associations in other ethnicities.
In summary, we performed a comprehensive investigation ofGLO1variants and did not demonstrate a prominent role for CP development in alcoholic and the non-alcoholic etiolo- gies of the disease.
Supporting information
S1 File. Figure A. Linkage disequilibrium figure of theGLO1locus generated by the SNPinfo LD TAG SNP Selection tool.
To generate the linkage disequilibrium (LD) figure, the SNPinfo LD TAG SNP Selection tool (https://snpinfo.niehs.nih.gov/snpinfo/snptag.html) with the following parameters was applied: LD threshold of 0.8; a minimum of one SNP tagged; a minimum of 5 valid genotypes to calculate LD in populations with European ancestry (CEU); integrated region with 10.000 bp in the 5’-region and the 3’-region of GLO1. Abbreviations: SNP, single nucleotide polymor- phism; LD, linkage disequilibrium; CEU, Northern Europeans from Utah. For the following SNPs we used tagging SNPs in our study: rs10484854 was tagged by rs12198212; rs1781735 by rs1621788; rs6458064 by rs937662; and rs9394523 by rs13212218. As demonstrated in the fig- ure the tagging SNPs represented the depicted haplotypes. In Table A inS1 Filethe informa- tion on the SNPs selected according to the published literature and by SNPinfo is summarized.
Table A. Overview of screenedGLO1SNPs that were identified by SNPinfo or by a litera- ture research.
We used the SNPinfo LD TAG SNP Selection tool to identify SNPs in the GLO1 locus that cover the haplotypes of the gene. As several variants have been reported in the literature, we included these using tagging SNPs, where possible. The corresponding literature for the screened SNPs is indicated in brackets. For rs4746 several studies reported associations and functional data are available in addition.�These SNPs have been tagged by the screened SNP rs1616723, rs9380765, rs13212218, and rs1621788 respectively.
Table B. Polymerase chain reaction (PCR) primers and probes for melting curve analysis of all GLO1SNPs. Abbreviations: fw, forward; rv, reverse; XI, internal dye modified base; LC610, 5´- LightCycler Red 610; LC640 (sensor probe), LightCycler Red 640 (sensor probe); FL, 3’-Fluo- rescein labelling (anchor probe); PH, 3´-phosphate.
Table C. Genotype data of the analysedGLO1SNPs in patients with alcoholic chronic pan- creatitis (ACP) and controls.
Note: For rs937662 and rs1699012 the extended German cohorts are shown. Calculations were performed using the Chi-square test (two-sided). Abbreviations: Contr. = controls, Pat. = patients.
Table D. Genotype data of the GLO1 SNP rs1937780 in patients with alcoholic chronic pancreatitis in European cohorts including Germany. Note: The German cohort comprises the screening cohort and additional samples. Calculations were performed using the Chi- square test (two-sided). Abbreviations: Contr. = controls, Pat. = patients.
Table E. Results of logistic regression with covariate gender for the GLO1 SNP rs1937780 in patients with alcoholic chronic pancreatitis in European cohorts including Germany.
Note: The German cohort comprises the screening cohort and additional samples. Calcula- tions were performed using logistic regression. Abbreviations: OR, Odds ratio; CI, confidence interval; ACP, alcoholic chronic pancreatitis.
Table F. Genotype data of the analysed GLO1 SNPs in German patients with non-alcoholic
chronic pancreatitis (NACP) and controls.
Calculations were performed using the Chi-square test (two-sided). Abbreviations: Contr. = controls, Pat. = patients.
Table G. Genotype data of the analysed GLO1 SNPs rs937662, rs1699012, rs4746 in the extended NACP cohorts.
Note: For rs937662, rs1699012, and rs4746 the extended German cohorts comprise the screen- ing cohort and additional German samples. Calculations were performed using the Chi-square test (two-sided). Abbreviations: Contr. = controls, Pat. = patients.kNACP replication cohort and controls from Germany. $ Independent NACP replication cohort from Munich. § NACP cohort and controls from France.€NACP cohort and controls from China.
(DOCX)
Author Contributions
Conceptualization: Tom Kaune, Marcus Hollenbach, Maren Ewers, Heidi Griesmann, Patrick Michl, Jonas Rosendahl.
Data curation: Tom Kaune, Claudia Ruffert, Andrea To´th, Maren Ewers.
Formal analysis: Tom Kaune, Claudia Ruffert, Holger Kirsten, Andrea To´th, Maren Ewers.
Funding acquisition: Marcus Hollenbach, Frank Ulrich Weiss, Peter Hegyi, Heiko Witt, Jonas Rosendahl.
Investigation: Tom Kaune, Andrea To´th.
Methodology: Tom Kaune, Bettina Keil, Carla Becker, Claudia Ruffert, Markus Scholz, Andrea To´th, Maren Ewers, Heiko Witt, Jonas Rosendahl.
Project administration: Tom Kaune, Marcus Hollenbach.
Resources: Jian-Min Chen, Emmanuelle Masson, Marko Damm, Robert Gru¨tzmann, Albrecht Hoffmeister, Rene H. M. te Morsche, Giulia Martina Cavestro, Raffaella Alessia Zuppardo, Adrian Saftoiu, Ewa Malecka-Panas, Stanislaw Głuszek, Peter Bugert, Markus M. Lerch, Frank Ulrich Weiss, Wen-Bin Zou, Zhuan Liao, Peter Hegyi, Joost PH Drenth, Jan Riedel, Claude Fe´rec, Heiko Witt.
Software: Tom Kaune, Andrea To´th, Jonas Rosendahl.
Supervision: Marcus Hollenbach, Patrick Michl, Jonas Rosendahl.
Validation: Jonas Rosendahl.
Visualization: Marcus Hollenbach, Holger Kirsten, Jonas Rosendahl.
Writing – original draft: Tom Kaune, Marcus Hollenbach, Frank Ulrich Weiss, Joost PH Drenth, Markus Scholz, Heiko Witt, Heidi Griesmann, Patrick Michl, Jonas Rosendahl.
Writing – review & editing: Jian-Min Chen, Emmanuelle Masson, Carla Becker, Marko Damm, Claudia Ruffert, Robert Gru¨tzmann, Albrecht Hoffmeister, Rene H. M. te Morsche, Giulia Martina Cavestro, Raffaella Alessia Zuppardo, Adrian Saftoiu, Ewa Malecka-Panas, Stanislaw Głuszek, Peter Bugert, Markus M. Lerch, Wen-Bin Zou, Zhuan Liao, Peter Hegyi, Jan Riedel, Claude Fe´rec, Holger Kirsten, Andrea To´th, Maren Ewers.
References
1. Majumder S, Chari ST. Chronic pancreatitis. Lancet. 2016; 387: 1957–1966https://doi.org/10.1016/
S0140-6736(16)00097-0PMID:26948434
2. Mayerle J, Sendler M, Hegyi E, Beyer G, Lerch MM, Sahin-Toth M. Genetics, Cell Biology, and Patho- physiology of Pancreatitis. Gastroenterology. 2019; 156: 1951–1968https://doi.org/10.1053/j.gastro.
2018.11.081PMID:30660731
3. Liu F, Shi Y, Zhang XQ, Xu XF, Chen Y, Zhang H. [The role of oxidative inflammatory cascade on pan- creatic fibrosis progression in mice induced by DBTC plus ethanol]. Zhongguo Ying Yong Sheng Li Xue Za Zhi. 2015; 31: 477–480 PMID:26827547
4. Yu JH, Kim H. Oxidative stress and inflammatory signaling in cerulein pancreatitis. World J Gastroen- terol. 2014; 20: 17324–17329https://doi.org/10.3748/wjg.v20.i46.17324PMID:25516643
5. Verlaan M, Roelofs HM, van-Schaik A, Wanten GJ, Jansen JB, Peters WH, et al. Assessment of oxida- tive stress in chronic pancreatitis patients. World J Gastroenterol. 2006; 12: 5705–5710https://doi.org/
10.3748/wjg.v12.i35.5705PMID:17007026
6. Singh R, Barden A, Mori T, Beilin L. Advanced glycation end-products: a review. Diabetologia. 2001;
44: 129–146https://doi.org/10.1007/s001250051591PMID:11270668
7. Maciejczyk M, Skutnik-Radziszewska A, Zieniewska I, Matczuk J, Domel E, Waszkiel D, et al. Antioxi- dant Defense, Oxidative Modification, and Salivary Gland Function in an Early Phase of Cerulein Pan- creatitis. Oxid Med Cell Longev. 2019; 2019: 8403578https://doi.org/10.1155/2019/8403578PMID:
30984340
8. Ohmori S, Mori M, Shiraha K, Kawase M. Biosynthesis and degradation of methylglyoxal in animals.
Prog Clin Biol Res. 1989; 290: 397–412 PMID:2498903
9. Ray S, Ray M. Formation of methylglyoxal from aminoacetone by amine oxidase from goat plasma. J Biol Chem. 1983; 258: 3461–3462 PMID:6833209
10. Casazza JP, Felver ME, Veech RL. The metabolism of acetone in rat. J Biol Chem. 1984; 259: 231–236 PMID:6706932
11. Phillips SA, Thornalley PJ. The formation of methylglyoxal from triose phosphates. Investigation using a specific assay for methylglyoxal. Eur J Biochem. 1993; 212: 101–105https://doi.org/10.1111/j.1432- 1033.1993.tb17638.xPMID:8444148
12. Vaca CE, Fang JL, Conradi M, Hou SM. Development of a 32P-postlabelling method for the analysis of 2’-deoxyguanosine-3’-monophosphate and DNA adducts of methylglyoxal. Carcinogenesis. 1994; 15:
1887–1894https://doi.org/10.1093/carcin/15.9.1887PMID:7923582
13. Lo TW, Westwood ME, McLellan AC, Selwood T, Thornalley PJ. Binding and modification of proteins by methylglyoxal under physiological conditions. A kinetic and mechanistic study with N alpha-acetylargi- nine, N alpha-acetylcysteine, and N alpha-acetyllysine, and bovine serum albumin. J Biol Chem. 1994;
269: 32299–32305 PMID:7798230
14. Hollenbach M. The Role of Glyoxalase-I (Glo-I), Advanced Glycation Endproducts (AGEs), and Their Receptor (RAGE) in Chronic Liver Disease and Hepatocellular Carcinoma (HCC). Int J Mol Sci. 2017;
18:
15. Thornalley PJ. The glyoxalase system in health and disease. Mol Aspects Med. 1993; 14: 287–371 PMID:8277832
16. Mannervik B. Glyoxalase I. In: Enzymatic Basis of Detoxification. Academic Press, New York. 1980; 2:
263–293
17. Junaid MA, Kowal D, Barua M, Pullarkat PS, Sklower BS, Pullarkat RK. Proteomic studies identified a single nucleotide polymorphism in glyoxalase I as autism susceptibility factor. Am J Med Genet A.
2004; 131: 11–17https://doi.org/10.1002/ajmg.a.30349PMID:15386471
18. Barua M, Jenkins EC, Chen W, Kuizon S, Pullarkat RK, Junaid MA. Glyoxalase I polymorphism rs2736654 causing the Ala111Glu substitution modulates enzyme activity—implications for autism.
Autism Res. 2011; 4: 262–270https://doi.org/10.1002/aur.197PMID:21491613
19. Groener JB, Reismann P, Fleming T, Kalscheuer H, Lehnhoff D, Hamann A, et al. C332C genotype of glyoxalase 1 and its association with late diabetic complications. Exp Clin Endocrinol Diabetes. 2013;
121: 436–439https://doi.org/10.1055/s-0033-1345124PMID:23775136
20. Wu JC, Li XH, Wang JB, Tang JF, Wang YF, Peng YD. Glyoxalase I and aldose reductase gene poly- morphisms and susceptibility to carotid atherosclerosis in type 2 diabetes. Genet Test Mol Biomarkers.
2011; 15: 273–279https://doi.org/10.1089/gtmb.2010.0075PMID:21294693
21. Kalousova M, Germanova A, Jachymova M, Mestek O, Tesar V, Zima T. A419C (E111A) polymorphism of the glyoxalase I gene and vascular complications in chronic hemodialysis patients. Ann N Y Acad Sci. 2008; 1126: 268–271https://doi.org/10.1196/annals.1433.012PMID:18079478
22. Gale CP, Futers TS, Summers LK. Common polymorphisms in the glyoxalase-1 gene and their associ- ation with pro-thrombotic factors. Diab Vasc Dis Res. 2004; 1: 34–39https://doi.org/10.3132/dvdr.2004.
004PMID:16305054
23. Rinaldi C, Bramanti P, Fama A, Scimone C, Donato L, Antognelli C, et al. GLYOXALASE I A111E, PARAOXONASE 1 Q192R AND L55M POLYMORPHISMS IN ITALIAN PATIENTS WITH SPORADIC CEREBRAL CAVERNOUS MALFORMATIONS: A PILOT STUDY. J Biol Regul Homeost Agents.
2015; 29: 493–500 PMID:26122242
24. Williams R, Lim JE, Harr B, Wing C, Walters R, Distler MG, et al. A common and unstable copy number variant is associated with differences in Glo1 expression and anxiety-like behavior. PLoS One. 2009; 4:
e4649https://doi.org/10.1371/journal.pone.0004649PMID:19266052
25. Sidoti A, Antognelli C, Rinaldi C, D’Angelo R, Dattola V, Girlanda P, et al. Glyoxalase I A111E, paraoxo- nase 1 Q192R and L55M polymorphisms: susceptibility factors of multiple sclerosis? Mult Scler. 2007;
13: 446–453https://doi.org/10.1177/13524585070130040201PMID:17463067
26. Antognelli C, Mezzasoma L, Mearini E, Talesa VN. Glyoxalase 1-419C>A variant is associated with oxi- dative stress: implications in prostate cancer progression. PLoS One. 2013; 8: e74014https://doi.org/
10.1371/journal.pone.0074014PMID:24040147
27. Krechler T, Jachymova M, Mestek O, Zak A, Zima T, Kalousova M. Soluble receptor for advanced gly- cation end-products (sRAGE) and polymorphisms of RAGE and glyoxalase I genes in patients with pan- creas cancer. Clin Biochem. 2010; 43: 882–886https://doi.org/10.1016/j.clinbiochem.2010.04.004 PMID:20398646
28. Antognelli C, Del BC, Ludovini V, Gori S, Talesa VN, Crino L, et al. CYP17, GSTP1, PON1 and GLO1 gene polymorphisms as risk factors for breast cancer: an Italian case-control study. BMC Cancer. 2009;
9: 115https://doi.org/10.1186/1471-2407-9-115PMID:19379515
29. Chocholaty M, Jachymova M, Schmidt M, Havlova K, Krepelova A, Zima T, et al. Polymorphisms of the receptor for advanced glycation end-products and glyoxalase I in patients with renal cancer. Tumour Biol. 2015; 36: 2121–2126https://doi.org/10.1007/s13277-014-2821-0PMID:25407489
30. Peculis R, Konrade I, Skapare E, Fridmanis D, Nikitina-Zake L, Lejnieks A, et al. Identification of glyoxa- lase 1 polymorphisms associated with enzyme activity. Gene. 2013; 515: 140–143https://doi.org/10.
1016/j.gene.2012.11.009PMID:23201419
31. Lohr JM, Dominguez-Munoz E, Rosendahl J, Besselink M, Mayerle J, Lerch MM, et al. United European Gastroenterology evidence-based guidelines for the diagnosis and therapy of chronic pancreatitis (HaPanEU). United European Gastroenterol J. 2017; 5: 153–199https://doi.org/10.1177/
2050640616684695PMID:28344786
32. Derikx MH, Kovacs P, Scholz M, Masson E, Chen JM, Ruffert C, et al. Polymorphisms at PRSS1- PRSS2 and CLDN2-MORC4 loci associate with alcoholic and non-alcoholic chronic pancreatitis in a European replication study. Gut. 2015; 64: 1426–1433https://doi.org/10.1136/gutjnl-2014-307453 PMID:25253127
33. Duan Z, Chen G, Chen L, Stolzenberg-Solomon R, Weinstein SJ, Mannisto S, et al. Determinants of concentrations of N(epsilon)-carboxymethyl-lysine and soluble receptor for advanced glycation end products and their associations with risk of pancreatic cancer. Int J Mol Epidemiol Genet. 2014; 5: 152–
163 PMID:25379135
34. Rinaldi C, Bramanti P, Fama A, Scimone C, Donato L, Antognelli C, et al. GLYOXALASE I A111E, PARAOXONASE 1 Q192R AND L55M POLYMORPHISMS IN ITALIAN PATIENTS WITH SPORADIC CEREBRAL CAVERNOUS MALFORMATIONS: A PILOT STUDY. J Biol Regul Homeost Agents.
2015; 29: 493–500 PMID:26122242