LIFE CYCLE ASSESSMENT OF LIQUID INVERTED SUGAR AND HIGH- FRUCTOSE CORN SYRUP
1Ferenc Kiš, 1Nikola Maravić, 2Szabolcs Kertész, 1Zita Šereš
1University of Novi Sad, Faculty of Technology Novi Sad, Bulevar cara Lazara 1, 21000, Novi Sad, Serbia
2University of Szeged, Faculty of Engineering, Mars tér 7, H-6724, Szeged, Hungary e-mail: ferenc1980@gmail.com
ABSTRACT
The aim of this study is to compare the environmental impact of liquid inverted sugar (77°Bx) produced with enzymatic hydrolysis of beet sugar and HFCS (75% DM) produced from corn in a wet milling process. Given the different sweetness equivalents of liquid inverted sugar (77°Bx) and HFCS (75% DM), the reference flows were defined as 900 kg of liquid inverted sugar or 1000 kg HFCS. The analysis was performed with the life cycle assessment (LCA) method focusing on the cradle-to-gate stage. The inventory data of liquid inverted sugar processing were supplied by a producer while the LCA of HFCS relies on secondary data (literature) which describes the material and energy flows associated with glucose production. Life cycle inventory of relevant inputs and outputs were available from the Ecoinvent 3.4 database. Environmental impacts were calculated with the ReCiPe 2016 (H) life cycle impact assessment (LCIA) method. LCA results have revealed that inverted liquid sugar has a lower impact in 14 out of the 18 analysed impact categories. Consumption of inverted liquid sugar (>77°Bx) instead of HFCS (75% DM) could lead to significant reduction in GHG emissions (by 38%), fossil energy (by 31%) and water (by 95%) consumption, and reduces the required land area by 67%.
Keywords: high-fructose corn syrup, inverted sugar syrup, life cycle assessment 1. INTRODUCTION
Sucrose obtained from sugar beet or sugar cane has been a part of the human diet for centuries.
Furthermore, sucrose found in fruit or honey has been introduced to the human diet for millennia [1, 2]. In the recent decades, varieties of new sweeteners are developed in order to substitute sucrose in the standard food formulation [3]. Despite huge effort, none of these sweeteners was able to comply with numerous standards currently adopted by food industry regarding colour, aroma, texture, fermentation and shelf-life [4]. However, two liquid sweeteners, inverted sugar syrup and high-fructose corn syrup (HFCS), have found a huge market due to similar characteristics to the basic sucrose solutions.
The process of inverted sugar production includes several technological processes. Firstly, sucrose crystals are dissolved at higher temperature forming sugar syrup above 70% of DM. Afterwards, syrup is cooled and specific amount of corresponding enzyme is added. Hydrolysis of sucrose yields glucose and fructose in 1:1 ratio. After syrup filtration, the obtained inverted sugar syrup (above 70% DM) has increased sweetness level compared to sucrose syrup. Sweetness level of 1 kg of completely inverted sugar syrup (70% DM) is equal to 1 kg of sucrose crystals [5].
The production of high-fructose corn syrup involves 4 major processing steps: (a) wet milling of corn to obtain starch, (b) liquefaction - hydrolysis of the starch to obtain glucose, (c) isomerisation -conversion of a portion of the glucose to fructose, and (d) enrichment of the glucose-fructose stream to increase the fructose concentration. Typical composition of high-fructose corn syrup includes 55% of fructose and 41%
of glucose with maltodextrin residues up to 4%. Therefore, 1 kg of HFCS (75% DM) corresponds to the sweetness of 1 kg of sucrose crystals [4].
The aim of this study was to compare the environmental impacts of inverted liquid sugar produced from beet sugar and high-fructose corn syrup. The analysis was performed with the life cycle assessment (LCA) method, which takes into account the potential environmental impacts associated with all the stages of the product's life cycle.
2. MATERIALS AND METHODS
Life cycle assessment was performed according to the principles of attributional LCA [6] and following the cut-off modelling approach as defined by Ecoinvent [7]. The life cycle impact assessment (LCIA) is based on life cycle inventory (LCI) data which includes information on environmental flows (i.e. emissions and resource use) associated with the entire life cycle of a process or product directly linked to the investigated products.
2.1. Functional unit and reference flows
The functional unit was defined as the sweetness equivalent of 1000 kg of sucrose. The reference flow is the amount of the product necessary to deliver the performance described by the functional unit. Given that liquid inverted sugar (77°Bx) and HFCS (75% DM) have a relative sweetness factor of 1.1 and 1, respectively, the reference flow was defined as 900 kg of liquid inverted sugar or 1000 kg HFCS (Table 1).
If not explicitly stated otherwise, data in tables and charts refer to 1 functional unit and the respective quantity of reference flow.
Table 1. Description of the analysed products and reference flows
Product name Description Functional unit Reference flow Liquid inverted sugar Inverted liquid sugar
>77°Bx from beet sugar produced from sugar beet cultivated in Germany.
Sweetness equivalent of 1000 kg of sucrose
900 kg of liquid inverted sugar High-fructose corn
syrup*
HFCS (75% DM) produced from corn in a wet milling process (global average production).
1000 kg of HFCS
* due to unavailability of data referring to the HFCS product system, the HFCS is represented with the impact of glucose syrup (75% DM) made from corn grain (see section Limitation of the study).
2.2. System boundaries and life cycle inventory data
In this study, system boundary includes only processes associated with the production chain of the analysed products. Distribution, use of liquid inverted sugar and HFCS by food manufacturers or consumers, and disposal are not considered in this LCA as there is substantial variation in the potential use for these products. Furthermore, environmental flows associated with the construction, maintenance and disposal of infrastructure, buildings and equipment in the processing stage was not considered according to their minor contribution proved by previous LCA studies related to food products.
Data on the consumption of materials and energy during beet sugar processing into inverted sugar were collected from the industry (primary data), while the quantity of material and energy flows associated with HFCS processing was estimated based on literature data (secondary data). Life cycle inventory (LCI) of material and energy flows associated with inverted sugar or HFCS processing are available from the Ecoinvent 3.4 database. The Ecoinvent LCI database [8] is considered to be the most comprehensive and reliable LCI database in Europe and includes a comprehensive accounting of emissions emitted and resources consumed in the entire life cycle of many products and processes.
In the inverted liquid sugar processing module, the dataset includes the electricity and heat requirements (from natural gas combusted in average industrial boiler), as well as tap water required for sugar processing and washing of the process equipment (Table 2). Potential impacts associated with the production of enzymes and treatments of waste water generated during the process are also considered.
Data on chemicals and cleaning agents used in the processing process were not provided by the producer and they are not included in the assessment. Life cycle inventory data of inputs associated with inverted sugar production are available from the Ecoinvent database. The LCI data for beet sugar (primary raw material for liquid inverted sugar production) refer to a typical technology for the production of sugar from sugar beet in the period 1998–2005 in Europe (sweet juice is extracted from sugar beets by diffusion and purified and crystallized to sugar). The original ecoinvent process (beet sugar production | sugar, from sugar beet | Cutoff, U - Copy – RoW, Ecoinvent 3.4.) was slightly modified to include only sugar beet produced in Germany on the input side. The LCI dataset of sugar beet includes all relevant environmental flows (emissions and resource consumption) associated with the provision of seeds, mineral fertilizers, pesticides, all machine operations and corresponding machine infrastructure and sheds, transport activities, as well as the direct field emissions from the application of fertilizers and pesticides and the atmospheric CO2 uptake by the sugar beet. Potential CO2 emissions arising from land transformation are not included in the Ecoinvent LCI of sugar beet.
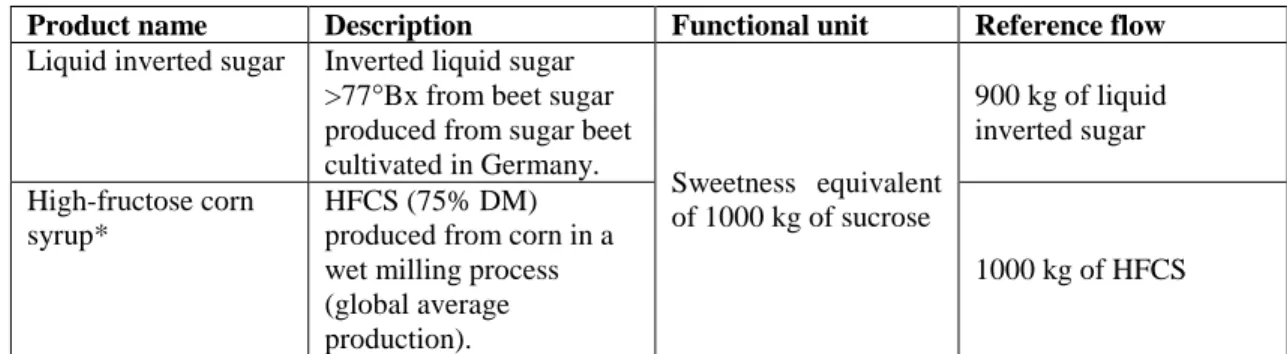
Table 2. Material and energy flows associated with the processing of beet sugar into liquid inverted sugar and their LCI data Units Amount LCI data (from the ecoinvent 3.4 database)
INPUTS Raw materials
Beet sugar granulated kg 720 beet sugar production | sugar, from sugar beet | Cutoff, U - Copy - RoW*
Tap water m3 0.3 market for tap water | tap water | Cutoff, U - Europe without CH
Transport
Transport of beet sugar (Distance: 300 km)
tkm 432 market for transport, freight, lorry, unspecified | transport, freight, lorry, unspecified | Cutoff, U - GLO
Processing
Electricity kWh 35.48 market for electricity, medium voltage | electricity, medium voltage | Cutoff, U - SL
Heat from natural gas MJ 435 heat production, natural gas, at industrial furnace >100kW | heat, district or industrial, natural gas | Cutoff, U – Europe without CH
Tap water for washing m3 0.66 market for tap water | tap water | Cutoff, U - Europe without CH
Enzymes kg 0.18 market for enzymes | enzymes | Cutoff, U - GLO OUTPUTS
Liquid inverted sugar
>77°Bx
kg 1000 Reference product
Wastewater m3 0.66 market for wastewater, average | wastewater, average | Cutoff, U - Europe without CH
*modified ecoinvent process (see above).
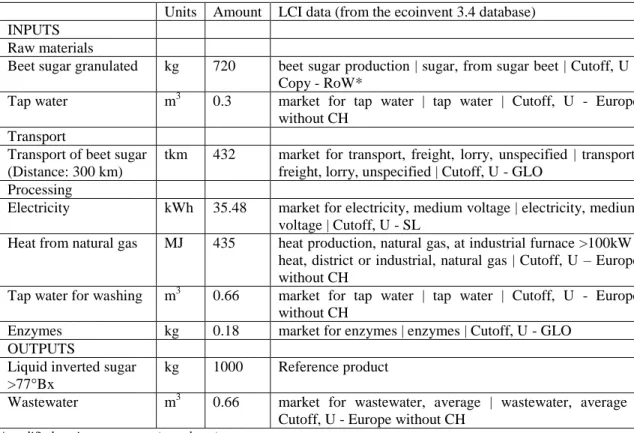
The inventory data of corn grain processing into high-fructose corn syrup was derived from literature [9]
referring to glucose production using wet milling. The dataset includes aggregated data on electricity and heat consumption, raw materials, chemicals and water usage, as well as information on emissions to air and effluents (Table 3). The potential environmental impact of the corn grain (primary raw material for glucose production) was modelled based on life cycle inventory dataset from the Ecoinvent 3.4 (market for maize grain | maize grain | Cutoff, U – GLO). The inventory data refer to the average inputs/outputs of global corn production in mid 2000s.
Table 3. Material and energy flows associated with the processing of corn grain into glucose syrup (75% DM) and their LCI data Units Amount LCI data (from the ecoinvent 3.4 database)
INPUTS Raw materials
Corn grain kg 1125 market for maize grain | maize grain | Cutoff, U - GLO Processing
Electricity MJ 700.5 market group for electricity, medium voltage | electricity, medium voltage | Cutoff, U - UCTE
Heat from
natural gas
MJ 1635.75 heat production, natural gas, at industrial furnace >100kW | heat, district or industrial, natural gas | Cutoff, U - RoW
Lime (CaO) kg 0.225 quicklime production, milled, loose | quicklime, milled, loose | Cutoff, S - CA-QC
Sulphuric acid (100%)
kg 0.3375 market for sulfuric acid | sulfuric acid | Cutoff, U - GLO
Sulphur dioxide kg 2.295 market for sulfur dioxide, liquid | sulfur dioxide, liquid | Cutoff, U - RoW
Urea g 156 market for urea, as N | urea, as N | Cutoff, U - GLO Sodium
hydroxide (50%)
g 211.5 market for sodium hydroxide, without water, in 50% solution state | sodium hydroxide, without water, in 50% solution state | Cutoff, U - GLO
Sodium chloride g 48.75 Sodium chloride, powder, at plant, processing - FR Cyclohexane g 41.25 market for cyclohexane | cyclohexane | Cutoff, U - GLO Chlorine g 9 market for chlorine, liquid | chlorine, liquid | Cutoff, U - GLO Water m3 0.495 market for tap water | tap water | Cutoff, U - RoW
OUTPUTS Products and by-products Glucose syrup (75% DM)
kg 1000 Reference product Corn gluten feed kg 201 By-product Corn gluten
meal
kg 60 By-product
Corn oil kg 20.25 By-product
Emissions to air Particulate (PM10)
g 0.525 Emission to air/unspecified Emissions to
water
BOD5 g 0.15 Emission to water/unspecified
Chlorides g 89.1 Emission to water/unspecified Sulphate g 0.15 Emission to water/unspecified Suspended
matter
g 0.525 Emission to water/unspecified
As seen from the table, glucose production is a multifunctional process, which apart from the main product, glucose, has three by-products (gluten feed, gluten meal and oil). According to ISO 14040:2006 and the principles of attributional LCA the overall impact of a multifunctional process should be portioned
between its co-products following an allocation procedure. In this study the overall impacts of the processing process is allocated between its co-products following economic allocation. Based on the economic allocation approach, Setzer [10] estimated that 84% of the overall impacts should be attributed to the main product, i.e. glucose.
2.3. Geographical and temporal relevance of the results
Data on material and energy flows associated with beet sugar processing into inverted liquid sugar was collected from a modern industrial-scale facility and describes average consumption of raw materials and utilities in 2018. When relevant, country-specific data were used to calculate the environmental impacts of products and processes associated with the production of inverted liquid sugar. Otherwise, global or European average data were used from the Ecoinvent database. Data on material and energy flows associated with sugar beet production refer to the typical inputs and yields of sugar beet in Germany in the period 2009–2012. Other inputs are mainly represented with Ecoinvent processes describing the flows associated with average technology in 1995–2005.
Data for corn wet milling came from a detailed production inventory of a modern corn wet mill in the USA, as described by Renouf et al. [9]. Although not explicitly stated by the authors, given the year of the publication it is reasonable to assume that the data refer to a typical technology for corn wet milling in early 2000s in the USA. The corn analysis was based on data from the Ecoinvent 3.4 database describing the average input and output flows associated with corn cultivation in the world in the period of 2004–
2006. Other inputs of HFCS processing are modelled with Ecoinvent data which usually describe the average production technology in the period from 1995 to 2005. As far as possible the environmental burdens associated with inputs and outputs of HFCS processing are calculated with global data. This means, that the LCA results refer to the average impact of HFCS on global level. If global average data was not available, than regional or country-specific data were used which is clearly indicated in the name of the Ecoinvent LCI dataset (last letters in the name of the Ecoinvent process; see Tables 2 and 3).
2.4. Life cycle impact assessment (LCIA) method
The environmental impact assessment is performed with the ReCiPe 2016 LCIA method [11]. ReCiPe 2016 is the most recent and harmonized indicator approach available for LCIAs. The potential environmental impacts are analysed and measured within 18 midpoint impact categories. As often encountered in scientific models, the assessment follows the hierarchist cultural perspective.
3. RESULTS AND DISCUSSION 3.1. Life cycle impact assessment results
Table 4 summarizes the results of environmental impact assessment within the ReCiPe 2016 midpoint impact categories. Inverted liquid sugar has a lower impact in 14 out of the 18 analysed impact categories.
Consumption of inverted liquid sugar (>77°Bx) instead of HFCS (75% DM) could lead to significant reduction in GHG emissions (by 38%), fossil energy (by 31%) and water (by 95%) consumptions, and reduces the land area (by 67%) required to produce the raw materials. HFCS had lower impacts in 4 impact categories (fine particulate matter formation, human non-carcinogenic toxicity, terrestrial acidification and ecotoxicity).
Table 4. Life cycle environmental impact of liquid inverted sugar and HFCS
Impact category Unit Liquid inverted
sugar
High-fructose corn syrup*
Fine particulate matter formation (PM) kg PM2.5 eq 3.07E+00 1.52E+00
Fossil resource scarcity (FD) kg oileq 1.17E+02 1.69E+02
Freshwater ecotoxicity (WE) kg 1,4-DCB 8.71E+00 1.73E+01
Freshwater eutrophication (WEU) kg Peq 1.32E-01 3.33E-01
Global warming (GW) kg CO2eq 4.93E+02 7.90E+02
Human carcinogenic toxicity (HTc) kg 1,4-DCB 1.23E+01 2.41E+01 Human non-carcinogenic toxicity
(HTnc)
kg 1,4-DCB 6.34E+02 2.12E+02
Ionizing radiation (IR) kBq Co-60eq 2.75E+01 5.53E+01
Land use (LU) m2a cropeq 2.30E+02 7.04E+02
Marine ecotoxicity (ME) kg 1,4-DCB 1.20E+01 1.95E+01
Marine eutrophication (MEU) kg Neq 5.94E-01 8.76E-01
Mineral resource scarcity (MD) kg Cueq 1.13E+00 2.07E+00
Ozone formation, Human health (Oh) kg NOxeq 1.62E+00 1.75E+00 Ozone formation, Terrestrial
ecosystems (Oe)
kg NOxeq 1.65E+00 1.79E+00
Stratospheric ozone depletion (OD) kg CFC11eq 4.40E-03 5.64E-03
Terrestrial acidification (TA) kg SO2eq 2.08E+01 5.40E+00
Terrestrial ecotoxicity (TE) kg 1,4-DCB 1.54E+03 1.21E+03
Water consumption (WD) m3 1.17E+01 2.37E+02
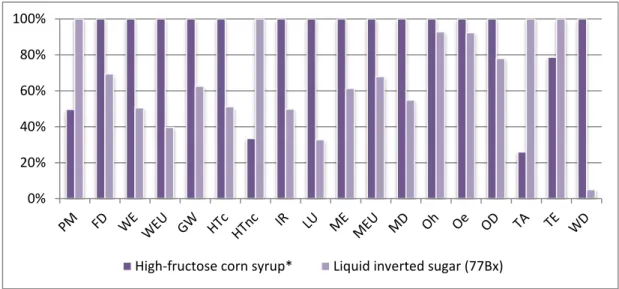
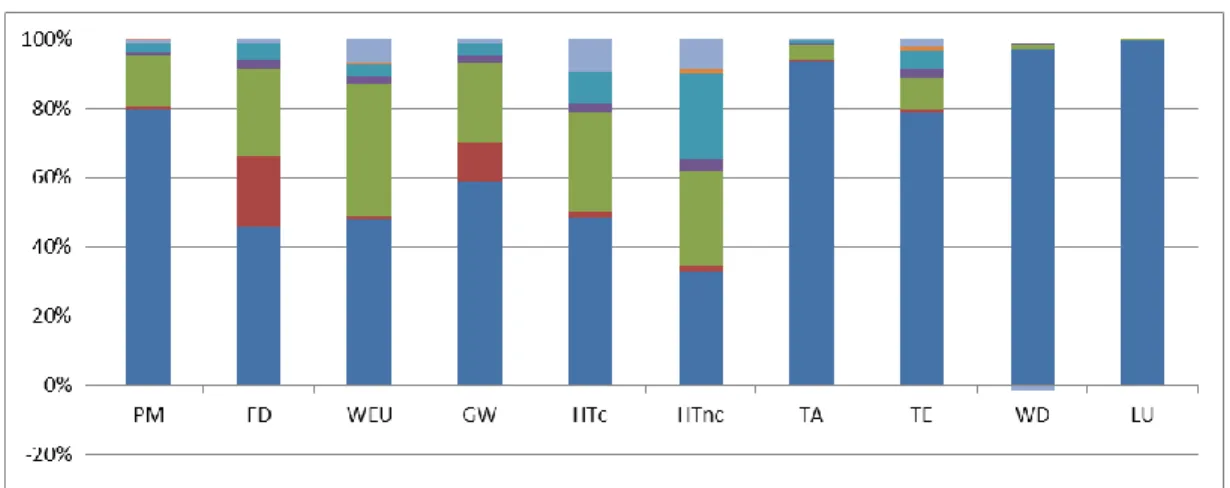
The following chart (Fig. 1) shows the relative results within the analysed midpoint impact categories. For each indicator, the product with the higher environmental impact is set to 100% and the results of the other product are displayed in relation to this result.
Figure 1. Relative difference between LCIA results for liquid inverted sugar and HCFS (the product with the higher impact category result is set to 100%)
0%
20%
40%
60%
80%
100%
High-fructose corn syrup* Liquid inverted sugar (77Bx)
3.2. Contribution of individual processes to impact category results
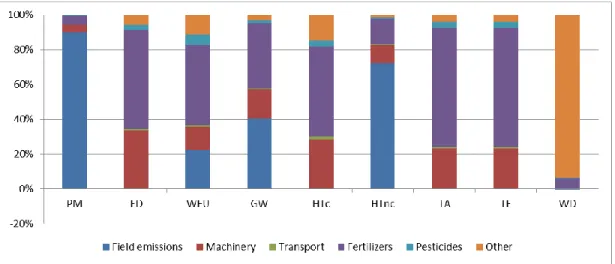
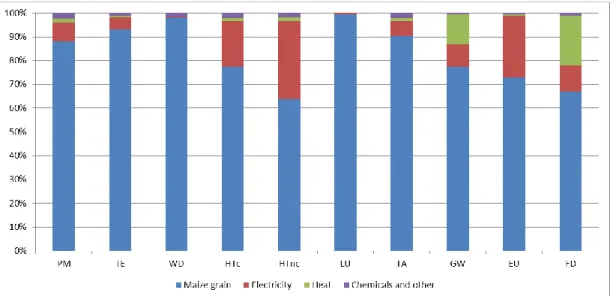
Fig. 2 shows the contribution of processes associated with liquid inverted sugar processing to the overall results within the selected life cycle impact category. The figure shows that the overall environmental impact of inverted liquid sugar is dominated by beet sugar production. The beet sugar processing into inverted liquid sugar has relatively minor influence on overall results (in general less than 20%) except in global warming, fossil energy depletion, terrestrial ecotoxicity and human toxicity impact categories. In the later four impact categories the processing related impacts are dominated by impacts associated with transport activities. The relatively high share of transport related impacts in total environmental impact can be explained with large transport distances (300 km in one direction) and the chosen transport mode (road transport) which is characterized by high environmental impact per tkm. Nevertheless, the highest impacts appear in the background system (provision of raw materials) which consists of processes on which the liquid inverted sugar producer has no, or very limited, influence.
Figure 2. Contribution of individual processes associated with liquid inverted sugar production to impact category results
Figure 3. Contribution of processes and flows to the environmental impact of sugar produced from sugar beet
The figures bellow show the results of the contribution analysis of the two most important upstream processes (in terms of their contribution to the overall results), that is beet sugar production and sugar beet production. As anticipated, the overall environmental impact of sugar is dominated by impacts associated with sugar beet cultivation. Impacts associated with the production of fertilizers, field emissions (from the application of fertilizers and pesticides) along with machinery (diesel fuel) are the main impacts related to sugar beet production.
Figure 4. Contribution of processes and flows to the environmental impact of beet sugar produced in Germany Contribution of individual process to the overall environmental impact of HFCS within the selected impact categories is depicted in Fig. 5. Environmental flows (emissions and resource use) associated with corn production cause most of the impacts within the selected impact categories.
The process of corn processing into HFCS has relatively minor influence on overall results within most of the impact categories. Exceptions are the global warming, fossil energy depletion, freshwater eutrophication and human toxicity impact categories in which heat and electricity consumption during the processing stage have significant contribution to the overall impacts.
Figure 5. Contribution of individual processes associated with HCFS production to impact category results
The global corn production is dominated by the USA which is responsible for around 38% of the corn produced globally. The figure bellow shows the contribution of processes to the overall environmental impact of corn production in USA („maize grain production | maize grain | Cutoff, U – US”; Ecoinvent 3.4). Field emissions associated with the application of fertilizers and pesticides have a dominant impact in most of the impact categories, however flows associated with drying and production of fertilizers have also significant share in some impact categories. It is interesting to see, that corn production has a positive impact on human toxicity (negative value on the charts). This means that corn removes more heavy metals from the soil (uptake) than it is incorporated into the soil via fertilizers and pesticides.
Fig. 6. Contribution of processes and flows to the life cycle environmental impact of the corn produced in USA
3.3. Limitations of the study
Modelling of inverted liquid sugar relies on primary data supplied by a producer and reliable and comprehensive LCI data (Ecoinvent 3.4 database). Some process inputs (see system boundaries) were not accounted for, but given their relatively small share in the total mass flow, it is not likely that their inclusion would significantly change the results.
The ecoinvent process used to calculated the environmental impact of enzymes refer to enzymes derived from potato starch unlike the one used by the data provider. However, given the small impact of enzymes on overall results (<0.5%), this simplification will not significantly change the results or conclusions.
Modelling of the HFCS product system relies on secondary data from literature sources. Although published in peer-reviewed scientific journal the authors did not provide information on data source, thus it was not possible to check and verify the reliability of the original data source. Furthermore, the data refer to the production of glucose from corn grain. Glucose is the intermediate product of the HFCS production (lacking only the final step of glucose isomerization) but it is not per se the product with the lower environmental impact due to different sweetness level of glucose and HFCS.
The production process described by Renouf et al. [9] refer to sugar production which is intended for fermentation, not for human consumption. In this regard our results likely underestimate the energy requirements for HFCS production. In this study we assigned 16% of the overall impacts to by-products based on economic allocation. Others have assigned larger co-product credits to corn glucose than in this study by undertaking a system expansion to include the potential benefits from avoided production of other processes displaced by corn meal and oil. However, the system expansion approach is not commonly used in the attributional LCA approach, and it is more suitable for consequential LCAs.
3.4. Comparison of the results with other studies
Even after an extensive literature review we were not able to find any LCA study of liquid inverted sugars.
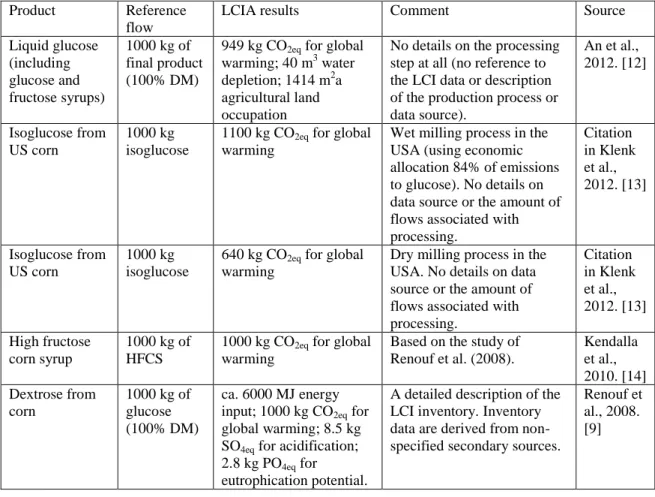
Several reports on the life cycle environmental impacts of glucose or HFCS are publicly available and their main findings are listed in the table below (Table 5).
As it can be seen from the table, previous researches have in general focused on intermediate products along the HFCS processing chain and not on HFCS itself. These reports considered only a few environmental aspects (usually only the global warming impact) and provide a very limited description of the analysed processing technology and data source. Despite the severe limitations of the previous LCA studies of HFCS it seems that our results, at least in terms of global warming impact of HFCS (790 kg CO2eq/1000 kg HFCS 75% DM, i.e. 1053 kg CO2eq/1000 kg HFCS 100% DM), are in good agreement with other LCAs of glucose and fructose syrups.
Table 5. Overview of LCA results of glucose and fructose syrups
Product Reference
flow
LCIA results Comment Source
Liquid glucose (including glucose and fructose syrups)
1000 kg of final product (100% DM)
949 kg CO2eq for global warming; 40 m3 water depletion; 1414 m2a agricultural land occupation
No details on the processing step at all (no reference to the LCI data or description of the production process or data source).
An et al., 2012. [12]
Isoglucose from US corn
1000 kg isoglucose
1100 kg CO2eq for global warming
Wet milling process in the USA (using economic allocation 84% of emissions to glucose). No details on data source or the amount of flows associated with processing.
Citation in Klenk et al., 2012. [13]
Isoglucose from US corn
1000 kg isoglucose
640 kg CO2eq for global warming
Dry milling process in the USA. No details on data source or the amount of flows associated with processing.
Citation in Klenk et al., 2012. [13]
High fructose corn syrup
1000 kg of HFCS
1000 kg CO2eq for global warming
Based on the study of Renouf et al. (2008).
Kendalla et al., 2010. [14]
Dextrose from corn
1000 kg of glucose (100% DM)
ca. 6000 MJ energy input; 1000 kg CO2eq for global warming; 8.5 kg SO4eq for acidification;
2.8 kg PO4eq for
eutrophication potential.
A detailed description of the LCI inventory. Inventory data are derived from non- specified secondary sources.
Renouf et al., 2008.
[9]
4. CONCLUSIONS
The comparative cradle-to-gate assessment of inverted liquid sugar and HFCS has revealed that the later has higher impact (i.e. causes more damage) in 14 out of the 18 analysed impact categories. Inverted liquid sugar has lower carbon and water footprint (by 38% and 95%, respectively) and its production requires less fossil energy (by 31%) and agricultural land (by 67%). The processing stage has relatively low contribution to the overall impact of inverted sugars and HFCS (in general less than 20% in most of the impact categories); therefore, further improvements in the process energy efficiency would have just minor impact on the overall results. Most of the life cycle impacts are attributable to the raw material production (i.e.
beet sugar and corn grain) on which the inverted liquid sugar or HFCS producer has no, or very limited, influence.
REFERENCES
[1] M. Asadi, Beet-sugar handbook, John Wiley & Sons, 2006
[2] J. S. White, Straight talk about high-fructose corn syrup: what it is and what it ain't, The American journal of clinical nutrition, 88(6) (2008), pp. 1716S-1721S.
[3] T. H. Grenby (Ed.), Advances in sweeteners. London, New York, NY: Blackie Academic &
Professional, 1996
[4] L. O'Brien-Nabors (Ed.), Alternative sweeteners, CRC Press, 2016
[5] P. W. Van der Poel, Sugar technology, Beet and cane sugar manufacture/PW van der Poel, H.
Schiweck, T. Schwartz. Berlin: Verlag Dr. Albert Vartens KG., 1998
[6] T. Ekvall, A. Azapagic, G. Finnveden, T. Rydberg, B. P. Weidema, A. Zamagni, Attributional and consequential LCA in the ILCD handbook, International Journal of Life Cycle Assessment, 21(3) (2016), pp. 293–296.
[7] B. Steubing, G. Wernet, J. Reinhard, C. Bauer, E. Moreno-Ruiz, The ecoinvent database version 3 (part II): analyzing LCA results and comparison to version 2, The International Journal of Life Cycle Assessment, 21(9) (2016), pp. 1269-1281.
[8] G. Wernet, C. Bauer, B. Steubing, J. Reinhard, E. Moreno-Ruiz, B. Weidema, The ecoinvent database version 3 (part I): overview and methodology, The International Journal of Life Cycle Assessment, 21(9) (2016), pp. 1218-1230.
[9] M. A. Renouf, M. K. Wegener, L. K. Nielsen, An environmental life cycle assessment comparing Australian sugarcane with US corn and UK sugar beet as producers of sugars for fermentation, Biomass and Bioenergy, 32(12) (2008), pp. 1144-1155.
[10] T. Setzer, Ökoeffizienz-Analyse Nachwachsende Rohstoffe zur Chemikalienherstellung am Beispiel Zucker, Masterarbeit im Studiengang Wirtschaftsingenieurwesen der Fachhochschule Mannhei, 2005 [11] M. A. J. Huijbregts, Z. J. N. Steinmann, P. M. F. Elshout, G. Stam, F. Verones, M. D. M. Vieira, M.
R. van Zelm, ReCiPe 2016: A harmonized life cycle impact assessment method at midpoint and endpoint level Report I: Characterization, 2016
[12] V. An, D. Evelien, B. Katrien, Life cycle assessment study of starch products for the European starch industry association (AAF): sector study, Flemish Institute for Technological Research NV, Boeretang, Kendalla, 2012
[13] I. Klenk, B. Landquist, O. R. de Imaña, The product carbon footprint of EU beet sugar, Sugar Ind, 2012, pp. 137, 169-177.
[14] A. Kendalla, J. Yuanb, S. Brodtc, K. J. Kramerd, Carbon Footprint of US Honey Production and Packing, Davis (CA), 2010