APPROACHES TO STRATEGIC DECISION MAKING IN WASTE TO ENERGY
PhD Thesis
Luca De Benedetto
Supervisor Prof Dr. Jiří J Klemeš, DSc
Doctoral School of Information Science and Technology
University of Pannonia
Veszprém, Hungary
2012
INTEGRATED LIFE CYCLE ANALYSIS APPROACHES TO STRATEGIC DECISION MAKING IN WASTE TO ENERGY
Thesis for obtaining a PhD degree in the Doctoral School in Information Science and Technology of the University of Pannonia.
Written by:
Luca De Benedetto Supervisor: Prof Dr. Jiří J Klemeš, DSc
Propose for acceptance (yes / no)
……….
(signature) The candidate has achieved …... % at the comprehensive exam,
I propose the thesis for acceptance as the reviewer:
Name of reviewer: …... …... yes / no
……….
(signature) Name of reviewer: …... …... yes / no
……….
(signature) Name of reviewer: …... …... yes / no
……….
(signature) The candidate has achieved …... % at the public discussion.
Veszprém, ……….
……….
Chairman of the Committee Labelling of the PhD diploma …...
………
President of the UCDH
Table of contents
CHAPTER 1 INTRODUCTION 13
BACKGROUND 13
LCA: THE HISTORY 14
LCA: AN OVERVIEW OF THE GENERAL FRAMEWORK 18
GOAL AND SCOPE DEFINITION 18
INVENTORY ANALYSIS 19
IMPACT ASSESSMENT 20
INTERPRETATION 22
LIMITATIONS OF LCAAPPROACHES 22
THE HUMAN FACTOR:WORK ENVIRONMENT IN LCA 24
LCAAPPLICATIONS IN THE WASTE-TO-ENERGY FIELD 28
RESEARCH QUESTIONS 31
PURPOSE OF THE RESEARCH 31
CHAPTER 2 FROM ENVIRONMENTAL ASSESSMENT TO STRATEGIC ENVIRONMENTAL MAPS 33
WHAT FOOTPRINTS? 35
CARBON FOOTPRINT 36
WATER FOOTPRINT 37
ENERGY FOOTPRINT 38
EMISSIONS FOOTPRINT 38
WORK ENVIRONMENT FOOTPRINT 39
BUILDING THE MAP 40
THE SUSTAINABLE ENVIRONMENTAL PERFORMANCE INDICATOR AND POLICY MAKING 44
CONCLUSIONS 45
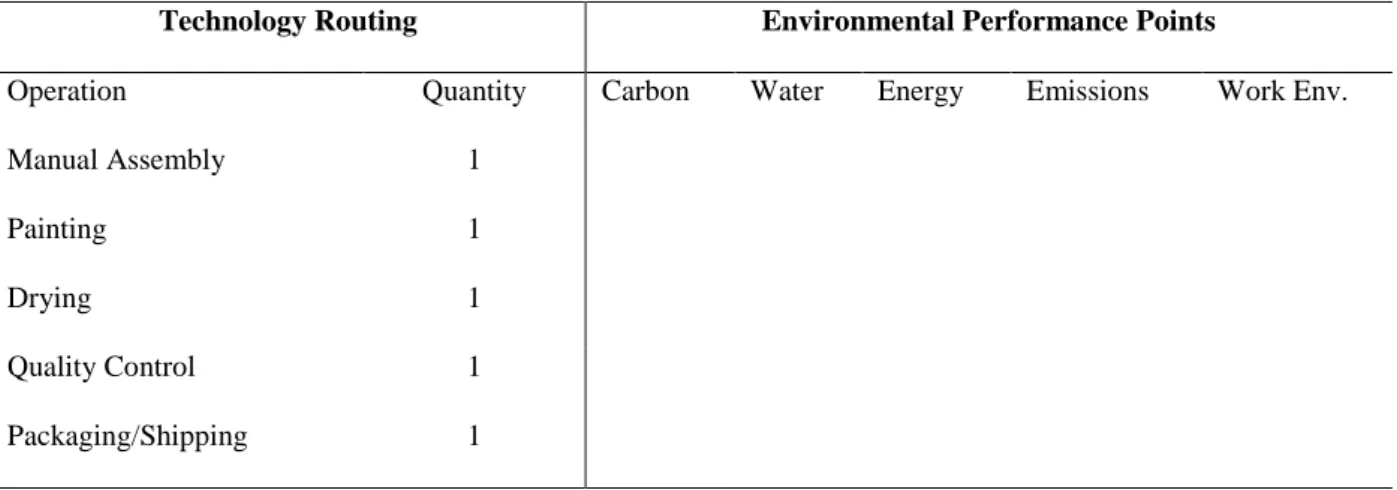
CHAPTER 3 THE ENVIRONMENTAL BILL OF MATERIALS AND TECHNOLOGY ROUTING 47
HOW TO USE THE ENV-BOM AND TECHNOLOGY ROUTING 49
CONCLUSIONS 54
CHAPTER 4 UNCERTAINTY ESTIMATION IN THE DEFINITION OF THE EPSM 56
INTRODUCTION TO FUZZY LOGIC 56
CASE STUDY 57
FUZZY INFERENCE SYSTEM FOR EPSMCALCULATION 58
CASE STUDY RESULTS 63
CONCLUSION 65
CHAPTER 5 THE E3-METHODOLOGY IN LCA EVALUATION OF W2E ISSUES 66
THE METHODOLOGY 66
THE E3-METHODOLOGY – THE STEPS 69
STEP1 69
STEP 2 69
STEP 3 70
STEP 4 70
STEP 5 71
THE E3-METHODOLOGY – THE CASE STUDY 73
SCOPE DEFINITION 74
THE BAMBOO MAT BOARD TECHNOLOGY 76
THE COIR BOARD TECHNOLOGY 81
CALCULATION OF THE ENVIRONMENTAL FOOTPRINTS 85
BAMBOO MAT BOARD 85
HUSK COIR BOARD 86
DEFINITION OF THE SEPI 90
COMPARISON OF RESULTS 91
CHAPTER 6 SUMMARY OF ACCOMPLISHMENTS 94
ORIGINAL CONTRIBUTIONS 95
THESES 96
THESES (HUNGARIAN) 99
JOURNAL PAPERS 102
CONFERENCE PROCEEDINGS 102
BOOK CHAPTERS 103
CHAPTER 7 REFERENCES 104
List of Tables
Table 1.1 Impact categories and normalisation factors (Schmidt, et al. 2004)... 27
Table 2.1 Normalization target factors ... 40
Table 2.2 Consumptions and emissions values of production process – single plant... 42
Table 2.3 Calculation of footprints and deviation from the targets ... 42
Table 2.4 Maximum target values in the given geographical area (North Jutland, DK) ... 43
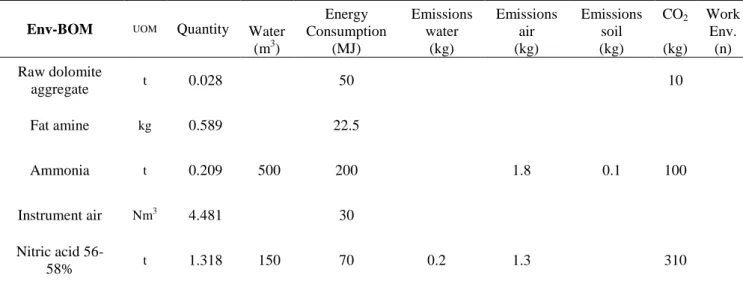
Table 3.1 Example of Environmental BOM... 48
Table 3.2 Example of Technology Routing table ... 49
Table 3.3 Bill of Materials of 1 ton of AN fertilizer ... 51
Table 3.4 Bill of Materials of 1 ton of AN solution used to produce AN fertilizer ... 51
Table 3.5 Environmental Bill of Materials ... 52
Table 3.6 Technology Routing ... 52
Table 3.7 Maximum target values in the given geographical area – Trans-Danubia region (De Benedetto and Klemeš, 2009) ... 53
Table 3.8 Normalized Env-BOM with Environmental Performance Points... 54
Table 4.1 Fuzzy rules for carbon footprinting calculation ... 61
Table 5.1 Normalization factor for region of San Isidro, Philippines ... 74
Table 5.2 Total consumptions and main impacts for the use of bamboo mat boards ... 86
Table 5.3 Construction and usage phase consumptions and impacts for Bamboo mat boards ... 86
Table 5.4 Environmental Footprints for bamboo mat board technology (raw data adapted from Salzer 2011).. 87
Table 5.5 Coir Board technology consumption ... 87
Table 5.6 Construction and usage phase consumptions and impacts for coir boards ... 88
Table 5.7 Environmental Footprints for coir board technology (raw data adapted from Salzer 2011) ... 89
List of Figures
Figure 1.1 Basic levels of LCA (adapted from Frankl et al. 2000) ______________________________________ 13 Figure 1.2 Phases and application of LCA (adapted from ISO 14040:1997) _____________________________ 16 Figure 2.1Plotting the footprints in the EPSM ____________________________________________________ 43 Figure 2.2 The additional dimension in the Environmental Performance Strategy Map ___________________ 44 Figure 3.1 Example of simplified Bill of Materials _________________________________________________ 47 Figure 4.1 Xc,n membership function ___________________________________________________________ 59 Figure 4.2 Xc,c membership function ___________________________________________________________ 59 Figure 4.3. Xc,p membership function___________________________________________________________ 59 Figure 4.4 Xc,s membership function ___________________________________________________________ 60 Figure 4.5 Membership function of the output variable ____________________________________________ 61 Figure 4.6 Fuzzy inference diagram ____________________________________________________________ 62 Figure 5.1 Evaluation software methodology _____________________________________________________ 68 Figure 5.2 The E3-Methodology to define the SEPI _________________________________________________ 72 Figure 5.3 Typical concrete and bamboo structures used for buildings in the Philippines (Salzer 2011) _______ 73 Figure 5.4 Cradle to Construction approach ______________________________________________________ 75 Figure 5.5 Bamboo Mat Boards (van der Lugt, Vogtländer et al. 2009) ________________________________ 76 Figure 5.6 Technology flow chart for Bamboo Mat board production _________________________________ 77 Figure 5.7 Coconut husk, skin, shell and copra (Salzer 2011) _________________________________________ 82 Figure 5.8 Coir production areas in the Philippines (Carpio et al, 2007) ________________________________ 83 Figure 5.9 Technology flow chart for Coir Board production from coconut husk. _________________________ 84 Figure 5.10 Vertex order for calculation procedure ________________________________________________ 90 Figure 5.11 Environmental Map value comparison ________________________________________________ 91 Figure 5.12 Strategic Environmental Performance Indicator comparison results _________________________ 92
NOMENCLATURE
BMB Bamboo Mat Boards
BAT Best Available Technique
BOM Bill of Materials
CNS Central Nervous System
E2E End-to-End
E3 Environmental End-to-End
Env-BOM Environmental Bill of Materials
EMS Environmental Management System
EPP Environmental Performance Points
EPSM Environmental Performance Strategy Map
EEA European Environmental Agency
ISO International Standard Organisation
ICPIC International Cleaner Production Information Clearinghouse
LCA Life Cycle Assessment
MSW Municipal Solid Waste
SHE Safety Health and Environment
SEPI Strategic Performance Indicator
SPI Sustainable Process Index
W2E Waste to Energy
WE-LCA Work Environment Life Cycle Assessment
ABSTRACT
Life Cycle Assessment (LCA) is a well-known tool for analysing environmental impacts on a wide perspective and with reference to a product system and economic activity. The need for a novel approach that complements environmental and financial considerations is clearly addressed in this study with the introduction of three new concepts: the Environmental Performance Strategy Map, the Environmental Technology Routing and the E3 (Environmental End-to-End) Methodology. The first is a particular graphical map that allowed the author to combine the main environmental indicators (footprints) with the additional dimension of cost. The Sustainable Environmental Performance Indicator is therefore introduced and defined as a single measure for sustainability. Comparison of different options for strategic decision making purposes can be enhanced and facilitated by the use of this indicator.
The Environmental Technology Routing is designed to evaluate the impacts of components and process on the Environmental Performance Strategy Map. The basic idea presented is that each component of a specific product has a certain environmental burden and consequently contributes to the environmental footprints. Those contributions are identified as Environmental Performance Points (EPP). When an item is routed through different technology processes to build the final product, it keeps contributing to the overall environmental burden. These contributions are again identified as EPP. The sum of all EPPs provides the basis for the creation of the characteristic Environmental Performance Strategy Map. This new approach allows wide flexibility: the impact of changing a component, material or a production process will be reflected immediately on the Map. Finally these methods have been compiled in an Environmental End-to-End methodology to provide the best combination of software and the above mentioned methods to be used in defining a sustainability indicator in the Waste to Energy field.
KIVONAT
Az Életciklus Elemzés (Life Cycle Assessment - LCA) a környezeti hatások elemzésében széleskörűen használható, jól ismert módszer, mely alkalmazható termékrendszer és üzleti tevékenység elemzésében is. Jelen tanulmány újszerű megközelítést alkalmaz, a környezeti és a pénzügyi szempontok figyelembevételével három új fogalmat mutat be:
· Környezeti Hatások Stratégiai Hálódiagramja,
· Környezeti Technológiai Útvonal, és az
· E3 (Environmental End-to-End) Módszertan.
A Környezeti Hatások Stratégiai Hálódiagramja. Térkép fogalom egy olyan grafikai térképet jelöl, melynek segítségével a szerző képes volt összekapcsolni a legfontosabb környezeti mutatókat („lábnyomokat‖) a költség aspektusával is. Ezért a Fenntartható Környezeti Hatás- mutató a fenntarthatóság egyetlen mutatójaként kerül meghatározásra. Ennek a mutatónak a használatával leegyszerűsíthető és javítható a stratégiai döntések meghozatala során felmerülő különböző opciók összehasonlítása. A Környezeti Technológiai Útvonal célja, hogy kiértékelje az összetevők és a folyamatok Környezeti Hatások Stratégiai Hálódiagramjára gyakorolt hatásait. A bemutatásra kerülő elképzelés alapján az egyes termékek valamennyi összetevője a környezetre fejti ki káros hatását és egyben hozzájárul a környezeti lábnyomhoz, ezen tudományos eredmény neve Környezeti Hatás Pont (Environmental Performance Point - EPP). Az egyes elemek a végtermékké válás különböző technológiai folyamatainak során folyamatos megterhelést jelentenek a környezet számára, amelyeket szintén EPP-nek minősíthetünk. Az EPP-k összessége szolgál alapul az adott Környezeti Hatások Stratégiai Hálódiagramja Térképének létrehozásához. Az új megközelítés széleskörű rugalmasságot tesz lehetővé: egyes összetevők, anyagi vagy termelési folyamatok megváltoztatásának hatásai azonnal megjelennek a térképen. A Környezeti End-to-End (E3) módszer segítségével a fent említett megközelítések és meglévő szoftverek legjobb
kombinációja hozható létre. Ezáltal meghatározható egy, a döntéshozatalt segítő, fenntarthatósági mutató amely a Hulladék Energetikai Hasznosításának területén alkalmazható.
ESTRATTO
Life Cycle Assessment (LCA) è uno strumento molto conosciuto per analizzare con un‘ampia prospettiva impatti ambientali sia per prodotti che per attività economiche. La necessità di un nuovo approccio che complementi considerazioni ambientali con quelle economiche, è chiaramente risolta in questo studio da tre nuovi concetti: la ―Environmental Performance Strategy Map‖ (Mappa Strategica di Performance Ambientale), il ―Environmental Technology Routing‖ (Routing Tecnologico Ambientale) e la E3 (Environmental End-to-End) Methodology (Metodologia end-to-end ambientale). La prima è una particolare rappresentazione grafice, che ha permesso all‘autore di combinare i prinicipali indicatori ambientali (footprints) con la dimensione aggiuntiva del costo. Il ―Sustainable Environmental Performance Indicator‖ (Indicatore di Performance Ambientale Sostenibile) è introdotto e definite come misura singola di sostenibilità. La comparazione di diverse opzioni nel processo di decisione strategica, puo essere facilitato dall‘uso di questo indicatore.
Il Routing Tecnologico Ambientale è disegnato per valutare gli impatti di component e processi sulla Mappa Strategica Ambientale. L‘idea di base presentata in questo studio è che ogni componente di un determinato prodotto o servizio possiede un certo carico dal punto di vista ambientale e percio contribuisce ai diversi indicatori ambientali. Questi contributi sono definiti in questo studio come Environmental Performance Points (Punti di Performance Ambientali. Quando un elemento è fatto passare attraverso differenti processi tecnologici per costruire il prodotto finale, continua a contribuire all‘impatto ambientale totale. Questi contributi sono identificati di nuovo come Punti di Performance Ambientali. La somma di questi contribute permette la definizione della caratteristica Mappa Strategica Ambientale.
Questo nuovo approccio permette una ampia flessibilità: gli impatti del cambiamento di un componente o processo tecnologico viene immediatamente riflesso sulla Mappa Strategica.
In ultima analisi questi metodi sono stati integrati in una metodologia End-to-End che provvede a fornire la migliore combinazione di software e metodi per definire un indicatore unico di sostenibilità nel campo del Waste to Energy.
ACKNOWLEDGEMENT
The research work presented in this thesis has been carried out at the Research Laboratory of Process Intensification and Integration (CPI2) at the Department of Computer Science and the Faculty of Information Technology, University of Pannonia, Hungary, under the supervision of Professor Jiří J Klemeš. I wish to express my sincere thanks to my supervisor for his flexibility, steady support and guidance. Flexibility particularly needed as I have been completing this study, while working full time on a very busy international schedule.
I would also like to thank all the colleagues from the Department of Computer Science for their help, always ready whenever needed. I am also very thankful to Professor Ferenc Friedler, for welcoming me to the Department from the very beginning and to Professor Rozalia Lakner for understanding and supporting me with great flexibility throughout these years.
My gratitude also to Ms Salzer, whose work with the HILTI foundation was the basis for one of the case studies. The occasional discussions on sustainability at the end of long business days were also highly appreciated and a testimony of her dedication to the topic.
The financial supports from the EC project Marie Curie Chair (EXC) MEXC-CT-2003- 042618 ―Integrated Waste to Energy Management to Prevent Global Warming – INEMAGLOW‖ is also gratefully acknowledged.
Finally, a great thank you goes to my family whose support was instrumental as the time needed to complete this thesis has been taken mainly from them.
The Author
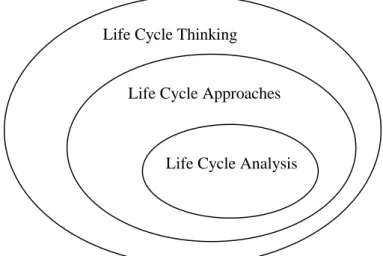
Chapter 1 Introduction Background
Life Cycle Assessment (LCA) is a tool for analyzing environmental impacts on a wide perspective, with reference to a product system or economic activity. The concept varies depending on the adoption pattern and on the precision that needs to be achieved. Due to the constraints on resource or data availability, industrial companies perform most of the time analyses based on a more simplified approach (Life Cycle Approach), or simply apply the general principles to certain aspects of the production system (Life Cycle Thinking), even though they are usually all referred as LCA activities.
Figure 1. Basic levels of LCA (adapted from Frankl et al. 2000)
Life Cycle thinking requires considering all environmental and toxicological impacts associated with the life cycle of a product. Life Cycle Thinking is a key element in different policies, from the US to the EU. Because lowering our overall environmental impact is critical, the research for ways to gauge the sustainability of our actions has intensified. The importance of specific metrics to support policy making and the decision-making process is
Life Cycle Thinking
Life Cycle Approaches
Life Cycle Analysis
paramount. In particular, Chapter 40 of Agenda 21 calls for research on indicators for sustainable development. The challenge is to develop indicators that are not too generic or too broad. At the same time it should be possible to aggregate them into a meaningful single indicator of performance, to be used for strategic decision making. This is particularly useful because it can provide the practitioner with a tool that, balancing different aspects, qualitatively points at the option that performs best from an environmental perspective.
Despite some limitations and methodological gaps, LCA is still recognized as a very powerful set of tools and ideas in evaluating not only environmental impacts but, in recent times, also occupational health and safety issues.
LCA: the history
Life Cycle Assessment involves the evaluation of specific elements of a product system, in order to determine its environmental impact. Also called Life Cycle Analysis or ‗cradle to grave‘ approach, LCA comprises a conceptual framework and a set of tools that have been studied and developed in the last 30 years. The core of the concept is the assessment of the impacts at each stage of the product life cycle. The term ‗product life cycle‘ is used here not with reference to a product‘s sales and profits course over time, but with reference to the notion of production, manufacturing, distribution, use and disposal including all necessary transportation steps. The proposed view is therefore a holistic one that includes the entire lifespan of a product from the extraction of the raw materials to its disposal.
The first studies on LCA date from the late sixties, early seventies. In 1969, for example, the Coca Cola Company funded a study to compare resource consumption and environmental releases associated with beverage containers (Udo de Haes, Heijungs 2007). Similar studies
were then started in UK, Switzerland and Sweden. In these early studies, LCA was closely linked with energy analysis. Also due to the energy crisis of the early seventies, waste and outputs were initially not considered and attention was concentrated on calculating the total energy used in production of various household goods. For example, Ian Bousted (1996) in the UK studied various types of beverage containers, including glass, plastic, steel and aluminum. This demonstrated the high embodied energy value of aluminium, in contrast to glass. Glass scored even better if it is reused or recycled. Nevertheless, the winners in this battle were the reusable plastic bottles, because glass and aluminium were transported great distances in order to be recycled.
After the oil crisis subsided, the energy issues, and the use of LCA in this application, lost prominence. It was only in the late eighties and early nineties that a new interest in the tool was found and coupled with efforts to bring standardization to its use. In 1989 Society of Environmental Toxicology and Chemistry (SETAC) started working on defining a common terminology and a methodology framework.
A first result of this work was the definition of the functional unit. This is a quantified description of the product systems to which impacts are attributed. This unit sets the scale for comparison of two or more products and one if its main purposes is to provide a reference to which the input and output data are normalised. Three aspects have to be taken into account when defining the functional unit (Lindfors, Christiansen, Hoffmann, et al. 1995):
efficiency of the product
durability of the product
performance quality standards
Finally, when performing an assessment of more complicated systems (e.g. multifunctional systems like waste treatment ones) special attention has to be paid to by-products.
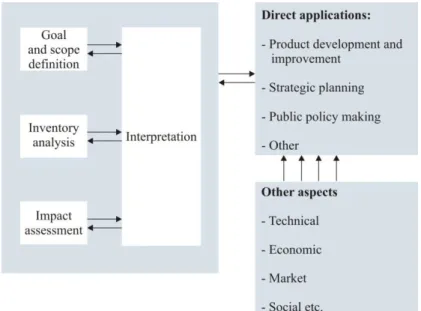
This standardization work was then picked up by the International Standard Organization (ISO) in 1994 with the first of its 14040 series. The rigid context of the ISO offered coherence to the different methodologies and approaches in LCA without imposing one. The ISO work has resulted in the definition of specific steps that allow the separation of the subjective and objective phases within the proposed method. The principles and framework for LCA in these documents include: goal and scope definition, life cycle inventory analysis (LCI), life cycle impact assessment (LCIA), life cycle interpretation phase and reporting.
These phases are the codification of the same steps individuated by SETAC in the previous years, with the exception that Life Cycle Improvement has been considered an activity that should permeate all other phases and not one of its own. The Interpretation phase was, instead, added. The interest on this topic is witnessed also by newer versions of the above mentioned series, the latest of which published in 2006 (ISO 14040:2006 effectively replaces 14040:1997, 14041:1998, 14042:2000 and 14043:2000).
Figure 1. Phases and application of LCA (adapted from ISO 14040:1997)
Even though in the last years the pace of development of LCA has been slowing, the methodology is beginning to consolidate. Nevertheless the usefulness of the technique is still very much in debate. For some LCA is a great tool that allows enormous progress towards full environmental responsibility for all corporate and public stakeholders. Others take a different view, pointing at the difficulties of the methodology and the unresolved issues with its application, such as:
Complexity
High cost and long-time scales
Uncertainty about valuation
Continuing invisibility of much of LCA work.
Another challenge lies with the communication of the results. Most people are not interested in reading entire documents, but if the results are too simplistic then there is no way for them to check the validity of the results. In recent times, the need to extend the complement the ISO LCA recommendation with other tools has also been expressed (Jeswani, Azapagic, Schepelmann et al. 2010).
A survey by the European Environment Agency (Jensen, Hoffmann, Moeller et al. 1996) pointed at the following social impacts of LCA:
LCA is now seen as necessary by all stakeholders as integral part of environmental management tool kit
Use of this tool is also seen important in the process of corporate strategy formulation
LCA remains still at early stage of development and further research is needed
Level of knowledge of LCA remains worryingly low in the general public
Level of progress in LCA adoption varies between countries
Quality control mechanism remains relatively weak
Involvement of external stakeholders in defining study boundaries is seeing increasingly important.
LCA: an overview of the general framework
The methodology for Life Cycle Analysis includes the phases described in Figure 1.. It has to be noted that ISO 14040 does not describe the technique in detail, nor does it specify which methodology should be used for each phase. It provides instead a framework in which these elements can be developed.
Goal and Scope Definition
This is the first, subjective, phase of the application of LCA. At this stage it is necessary to identify the aim of the analysis as well as to select the system boundaries to ensure that no relevant part of the system to be investigated is actually left out. The definition of the goal and the scope are critical elements, since the results will depend greatly on them.
The goal needs to state clearly and without ambiguity which is the application, what are the reasons, why the study is carried out and who the recipients of the results of the study are. A goal identified in such a way will allow the practitioner to perform the correct choices throughout the study. Obviously, the goal could also be adjusted depending on specific and relevant findings of some later steps of the analysis.
The scope sets really the borders of the assessment. Different elements should be considered in order to specify the scope correctly: product group, functional unit, the system and its boundaries, impact assessment boundaries, the data quality requirements, limitations. The definition of the system boundaries (inputs and outputs) are critical in order to determine the amount of work to be done. The impact categories need to be chosen from a list of standard ones: assessing the boundaries will also limit the categories to be considered during the study.
The work provided in the ISO 14040 actually lists the standard impact categories. The national agencies for environment then usually rework this list according to their national characteristics and release an official one. As for the goal, even the scope can be adjusted during the iterative process of the analysis.
Inventory Analysis
Aim of this second phase is to perform mass and energy balances to quantify all the material and energy inputs, waste and emissions from the system, i.e. the environmental burdens. The following main issues (as defined by ISO 14040:1997) should be considered during this phase: data collection, refining system boundaries, calculation, validation of data, relating data to the specific system and allocation.
Data can be specific (to the process, the company, and the geographical area) or more generic (for instance extracted from trade organizations or governmental institutions). According to the availability it is possible to rely on quantitative or qualitative data in order to perform this phase. Generally the results obtainable with LCA are very sensible to the set of data used, so it is important to understand the intrinsic criticality of this phase. More generic and qualitative data could be used for a first simplified analysis, to be reiteratively repeated on more specific and system related data.
The data initially collected can be used to review the system boundaries, as defined in the previous phase. We should also consider that, if the system is very complex, it might be necessary either to review the system boundary in order to include more data or to allocate the relevant environmental burdens to the system, ensuring that the approximation of the input- output relationship and the main characteristics is possible. Allocation might actually be necessary in case of multi input or multi-output systems, where a direct relation between inputs and emissions is not evident.
The inventory should then be interpreted considering all the specified uncertainties and lack of data. In particular validation should also be considered and carried out during the whole process of data collection, in order to reduce eventual discrepancies and data quality issues later on.
Impact Assessment
In the third phase, and as a natural sequence of the work done in the Inventory phase, it is necessary to aggregate the environmental impacts quantified in the Inventory Analysis into a limited set of recognizable impact categories (e.g. global warming, ozone depletion, acidification etc.). This phase comprises the following steps: classification, characterisation, normalisation and weighting.
According to ISO 14042:2000, there are three groups of categories to be considered: Resource use, Human Health consequences and Ecological consequences. These broad groups should include all categories like climate change, stratospheric ozone depletion, photochemical oxidant formation (smog), eutrophication, acidification, water use, noise, etc. It must be noted that, as of today, there is no consensus on a single list of impact categories. The impact categories should therefore be selected from a list of examples and be relevant to the system under investigation.
The second step in this phase is mainly a quantitative step: characterisation. In this step it is necessary to assign the relative contribution of each input and output to the selected impact categories. Pennington (2003) proposes a generic equation to calculate, from the inventory data, indicators for each impact category using generic characterisation factors.
𝐶𝑎𝑡𝑒𝑔𝑜𝑟𝑦𝐼𝑛𝑑𝑖𝑐𝑎𝑡𝑜𝑟 = 𝐶ℎ𝑎𝑟𝑎𝑐𝑡𝑒𝑟𝑖𝑠𝑎𝑡𝑖𝑜𝑛𝐹𝑎𝑐𝑡𝑜𝑟 𝑠 × 𝐸𝑚𝑖𝑠𝑠𝑖𝑜𝑛𝐼𝑛𝑣𝑒𝑛𝑡𝑜𝑟𝑦(𝑠)𝑠 Eq. 1.
Where ‗s‘ indicates the given element (e.g. chemical compound) and the ‗Factors‘ can be found in literature as databases or are available in various LCA support tools. The following equation takes into account some of the potential variables of non-generic characterisation factors in the context of human health and natural environment (Pennington et al. 2003):
j j Exposure s j t
t j s Effect t
j s Fate
t j s Exposure i
s Emission
t j s Fate i
s Emission
t j s Effect
t i s or sationFact Characteri
) , , (
) , , ( )
, , (
) , , ( )
, (
) , , ( )
, (
) , , (
) , , (
Eq. 1.
Subscript s again denotes the chemical, i is the location of the emission, j is the related location of exposure of the receptor and t is the time period during which the potential contribution to the impact is taken into account. ‗Fate(s,j,t)‘ is the probability that the given emission or exposure happens, depending on the chemical, the location and the related time interval.
The next step in this phase is the normalization. This activity is described by Stranddorf et al.
(2003) as necessary to calculate the magnitude of the category indicator results relative to reference values where the different impact potentials and consumption of resources are expressed on a common scale. The goal of normalization is to set a common reference enabling comparison of different environmental impacts.
Since quantitative results of the above mentioned characterisation of impact categories are not always comparable, an additional step is necessary: weighting. This activity aims at comparing the impact categories against each other. This would allow ranking and possibly defining the relative importance of these different results. Weighting can be a quantitative or qualitative activity, not always based on science, but often on social or political considerations. Different weighting methods have been developed (Lindeijer 1996).
Interpretation
This is the last phase as indicated by ISO 14040:1997. Interpretation is a systematic procedure to evaluate information from the conclusions of the inventory analysis and impact assessment of a product system, and present them in order to meet the requirements of the analysis as described in the goal and scope of the study.
The following tasks should be accomplished in this phase (Jensen, Hoffmann, Moeller et al.
1997).
1. Identify the significant environmental issues.
2. Evaluate the methodology and results for completeness, sensitivity and consistency.
3. Check that conclusions are consistent with the requirements of the goal and scope of the study, including, in particular, data quality requirements, predefined assumptions and values, and application oriented requirements.
4. If so, report as final conclusions. If not, return to step 1 or 2.
Limitations of LCA Approaches
Even though LCA is a powerful tool to assess the environmental impact of product/services, some important limitations have been evidenced in the past years (Lee, Choi, Osako, Dong 2007, Stoeglehner, Narodoslawsky 2008, Jeswani, Azapagic, Schepelmann et al. 2010). The main limitations are all related to the LCA methodological approach, especially data quality and collection, definition of system and time boundaries, multi-functionality and allocation.
LCA is a methodology that is very data dependent. The quality and availability of data influence the results significantly. Some of the steps of LCA can be re-iterated to better tune the analysis to the systems under investigation. It is therefore suggested to start with easily
accessible data and eventually to refine the data quality with reference to the results. In some cases it is unavoidable to introduce simplification and limitation of assumptions due to uncertainty of specific data. For instance, toxicological categories as well as some energy production impact categories are deeply affected by lack of data (Lee, Choi, Osako, Dong et al. 2007). There can be different type of data uncertainty (Schmidt, Hold, Merrild, Christensen 2007), and it must be noted that the methodological uncertainties are sometimes larger than the data ones.
The time aspect is often critical in including or excluding some effects of the systems under analysis. LCA should consider environmental impacts on the longest possible timeframe, possibly an infinite one. Most of the studies, nevertheless, use shorter time periods bringing to contestable conclusions (for instance, in Municipal Solid Waste treatments, landfills act in a limited period of time as carbon sinks and therefore become a more favourable solution than incineration).
The holistic approach of LCA, one of its main strengths, is also a cause of complexity during the actual execution of the analysis. Having to collect and analyse data from so many different elements, can be cumbersome. This is the reason why most of the times some assumptions are taken and the system boundaries are modified in order to leave out some elements. In particular the upstream elements of the supply chain are usually not included in the analysis, due to the inherent difficulty in gathering complete information for elements outside the specific product system.
Results of LCA are often used for process optimization. The applicability of these results depends greatly on the model of the process that has been adopted at the beginning of the study. This model is frequently simplified, to be able to take into consideration all possible
inputs and outputs, and in most cases does not include health and safety elements. This is very reductive because not all kind of results from LCA can be applied directly in process improvements: choices that reduce the environmental impact might not always be applicable for human or industrial constraints, or in some cases can prove to be dangerous. It is therefore necessary to make sure to take into due account the human factor and to integrate work environment in the holistic approach of LCA.
Uncertainty estimation is also another challenge in using LCA. A possible approach to overcome this challenge as well as the challenge of accounting for economic value is given by Hybrid LCA. This combines a bottom–up construction of the supply-chain based on facility- level data on material/energy use with a top–down economic input–output (EIO) model to account for processes for which direct data are usually not unavailable (Deng, Babbit, Williams 2011). In this approach the environmental burdens are calculated for the process that generated a specific product, while the economic impacts are derived from the decomposition/recycling of the final product at the end of the life cycle. In the context of waste management, different approaches have been worked out, but there is still the need to develop a method for uncertainty estimation and accounting of waste-LCA (Clavreul, Guyonnet, Christensen 2012).
Finally, the great detail required in completing a LCA, which takes into consideration also cost, might discourage some practitioners from using this approach as decision making support tool.
The human factor: Work environment in LCA
As noted previously, one of the main limitations of the LCA methodology, as described by ISO 14040, is the lack of inclusion of work environment issues. This does not mean that
safety and health analysis of processes is not carried out by the company. Most frequently these issues are addressed ex-post, to analyse the suggestions indicated by the application of an environmental oriented LCA.
There is still a tendency for companies to treat safety, health and environment (SHE) as separate issues (Crawley, Ashton 2002). This adds complexity to environmental management systems, and makes the companies lose out on possible synergies between environmental and safety issues. From an economical point of view, this practice is not optimal; since design could be taken too far before it is found too dangerous from a work environment perspective.
Historically the first efforts in including the human factor in LCA have been made in Scandinavia. The Nordic countries have therefore produced different approaches for Work Environment- LCA (WE-LCA).
Antonsson (1996) proposed a method based on five quantitative and two qualitative impact categories. The WE-LCA is carried out in a similar way as for the external environment, with the four steps of goal and scope definition, inventory analysis, impact assessment and interpretation. The method requires the use of an inventory of effects, instead of emissions, followed by the impact assessment. The quantitative impact categories are:
Deaths due to work related accidents
Workdays lost due to work related accidents
Workdays lost due to illness
Hearing loss
Allergies
The qualitative impact categories are:
Carcinogenic impact
Impact on reproduction
Data for the quantitative categories can be collected from single companies or trade statistics organizations. It must be noted that the final result will depend greatly on the quality and precision of this set of data. Moreover the level of detail must be balanced against the goals of the analysis. Another source of uncertainty in the method is the fact that not all impact categories can be estimated quantitatively. Work environment issues have been left out not only from LCA methodology, but also from environmental technology databases and reports of Best Available Technologies. In a project conducted for the European Commission on a selection of cases of the International Cleaner Production Information Clearinghouse (ICPIC) system, Ashford (1997) evidenced the following: the most striking feature of the case studies is their complete lack of information regarding the interactions of human beings with the production processes, materials, or products. No information is given regarding the physical or economic context for the processes Limited information is given regarding the physical form of the substances at certain stages in the process so that, should a worker be exposed, the physiologic route of entry cannot be adequately anticipated. A serious lack of integration of safety concerns with legislation, regulations and policies addressing environment and more generally industrial ecology is also to be seen.
The role of personal risk perception and involvement in occupation health and safety issues in environmental management systems has been interestingly analysed by Honkasalo (2000). In particular, in industrial environments risks seem to be perceived differently depending on the level of involvement of the perceiver. Risks caused by others, for instance global environmental issues, are not tolerated easily, because the perceiver feels that they cannot be affected. Risks taken voluntarily, for instance safety risks are more accepted. This is probably one of the main reasons for the over-estimation of environmental issues compared with the health and safety ones. Employee participation is another difference between environmental management systems (EMS) and work environment related approaches. EMS does not
usually require employee participation. In safety and health issues it is absolutely necessary to make sure that workers are involved and can actually influence the process.
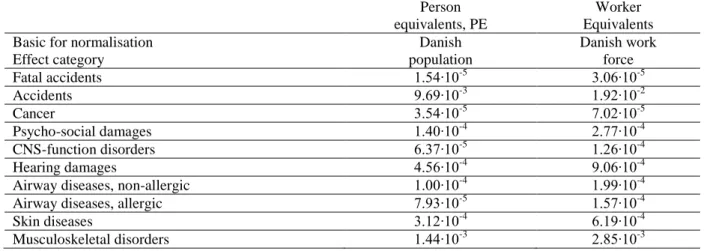
In 2004 The Danish Environmental Agency came up (Schmidt, Poulsen, Andreasen et al.
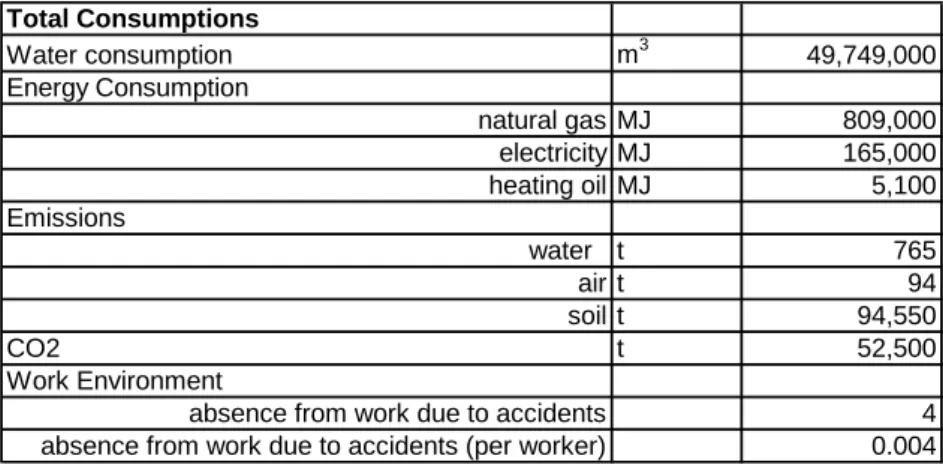
2004) with guidelines on how to calculate the potential Work Environment impacts per functional unit by adding the impacts from a number of processes and activities. This method, based on the collection of goods statistics, aims at calculating the number of reported accidents per produced weight unit on the sector level. The steps are the same as for the environmental oriented LCA. The first step is the inventory procedure, where material flows are calculated for the product (with reference to a set of data obtained from the governmental statistical office). The material flows are then aggregated on relevant processes in the provided database and for each process the weight is multiplied with the impacts per weight unit for each of the affected categories. It must be noted how the method introduces a great source if uncertainty. One of the main challenges in fact is to match the actual activities with data sets in the database (many thousand product groups must be related to a small number of sectors, less than 300). Aim of the normalisation activity in the impact assessment step is to relate the total number of accidents and work related diseases with the Danish population (the same could be applied to other countries, if similar databases are available). In the following table a list of impact categories and normalisation factors are illustrated.
Person equivalents, PE
Worker Equivalents Basic for normalisation
Effect category
Danish population
Danish work force
Fatal accidents 1.54∙10-5 3.06∙10-5
Accidents 9.69∙10-3 1.92∙10-2
Cancer 3.54∙10-5 7.02∙10-5
Psycho-social damages 1.40∙10-4 2.77∙10-4
CNS-function disorders 6.37∙10-5 1.26∙10-4
Hearing damages 4.56∙10-4 9.06∙10-4
Airway diseases, non-allergic 1.00∙10-4 1.99∙10-4
Airway diseases, allergic 7.93∙10-5 1.57∙10-4
Skin diseases 3.12∙10-4 6.19∙10-4
Musculoskeletal disorders 1.44∙10-3 2.85∙10-3
Table 1. Impact categories and normalisation factors (Schmidt, et al. 2004)
Interpretation can be done following the inventory or after the normalisation. In the first case it is possible to establish an overview of how much each of the activities contributes to the single effect categories. Following the normalisation, it is possible to depict which are the most important impact categories in the life cycle of a product. The method described is a comprehensive approach to determine the impact of work environment issues with an LCA approach. The established database associated to it covers about 80 economic sectors and provides an important tool for this kind of analysis in Denmark. It would be most useful if other countries collected the same kind of information, so that similar analyses could be done with increased reliability in other countries as well.
LCA Applications in the Waste-to-Energy Field
Waste treatment and Waste Management systems and techniques have been developed in recent years not only in order to reduce the environmental burden of land-filling, but also to address the energy aspect. Disposal of organic waste in landfills produces methane (CH4), the reduction of which is significant in fighting greenhouse gases emissions. At the same time waste treatment is recognized as a viable possibility for energy production (Waste-to-Energy or W2E). This possibility needs to be analyzed with specific tools to assess its environmental impact. An interesting experience in this field has been presented by Liamsanguan, Gheewala (2007) on the Thai reality and by Khoo, Tan L, Tan R (2012) on the Singapore one. Assamoi, Lawryshyn (2012) also provide a thorough overview of the use of LCA to compare options for Municipal Solid Waste or MSW treatment. While the environmental impact seems to be easily supported by the use of LCA, it is clear that the inclusion of the financial considerations is not established yet.
Municipal Solid Waste is a type of waste that includes predominantly household waste (domestic waste) sometimes with the addition of commercial waste collected within a
collection area. The waste is either solid or semisolid and generally excludes industrial hazardous waste. MSW consists of everyday items such as product packaging, furniture, clothing, bottles, food scraps, newspapers and other paper.
Depending on their nature and composition the treatment of solid waste requires various technologies and a coordinated mix of practices. That includes incineration, gasification, pyrolysis, recycling, composting, and disposal to landfills. A tool generally used to classify different approaches to waste treatment is called Waste Hierarchy (Wiedmann, Lenzen 2007). The waste hierarchy implies that some methods to handle waste are more opportune than others from an environmental point of view. Reducing the amount of waste is generally indicated as first priority. The order of the other priorities (reuse, recycle, incinerate and landfill) is based on the type of waste itself and the location where the waste arises. Different studies dealt with the environmental impacts of MSW systems, or compared different scenarios of solid waste management (Monfreda, Wackernagel, Deumling 2004, Hujbregts, Hellweg, Frischknecht et al. 2008, Gunamantha 2012, ).
LCA has found various applications in the Waste to Energy (W2E) field. The biggest contributions in this field are the ones regarding Municipal Solid Waste (MSW) systems and alternatives analysis. Different studies tried to assess the environmental impacts of MSW systems (Harrison, Dumaz, Barlaz 2000), or compared different scenarios of solid waste management (Denison 1996, Mendes, Haramaki, Hanaki 2004, Lee, Choi, Osako, Dong 2007, Finnveden, Johansson, Lind, Moberg 2005, Gunamantha 2012). In particular, both Finnveden and Gunamantha provide good examples on how to use LCA as a tool to analyze different MSW.
The studies confirm that Waste Hierarchy is usually a good starting point for waste policy making, however LCA can further support it in identifying situations in which this approach is not valid. Analogous results were also presented by Moberg, Finnveden, Johansson, Lind
(2005) and Olsson, Kärmann, Gustafsson (2006). The study also exposes the fragility of LCA to data gaps and base assumptions. In particular all assumptions on time aspects, system boundaries and characterisation models affect the final results significantly. In few cases this resulted in changing the order of the preference of the proposed waste hierarchy.
Clift, Doig, Finnveden (2000) provided an exhaustive review of the use of LCA in this field.
They are evidencing the criticality of the definition of the system boundaries as well as the importance of screening between direct, indirect and avoided environmental burdens in the LCI phase.
The role of national policies is paramount in the development of waste management and Waste to Energy (W2E) issues. Lee, Choi, Osako, Dong (2007) provide an LCA based comparison of landfill, incineration, composting, and feed manufacturing to treat food waste (that accounts in Korea to 30% of MSW). Most interestingly this study compares the situation of food waste treatment in 1997 and 2005. While the categories of global warming and human toxicity decreased significantly (50% and 70% respectively for the reduction of landfilling), acidification, eutrophication, and ecotoxicity increased impressively. This is due to emission in the recycling process, and highlights the need for better control and inclusion of work environment.
The role of LCA as decision support tool for waste management and W2E issues is further confirmed by studies on bottom ash originating from municipal solid waste incineration (MSWI) as a potential road construction material (Olsson, Kärmann, Gustafsson 2006), and on waste hierarchy for MSW and paper treatments (Schmidt, Hold, Merrild, Christensen 2007). More recently different studies for the evaluation of energy production from different
types of municipal solid waste have confirmed LCA as a prominent tool (Fruergaard, Astrup 2011, Slagstad , Brattebø 2012, Slagstad , Brattebø 2013, Othman, Noor, Abba, et al. 2013).
Research questions
While the importance of Life Cycle thinking and LCA is widely recognized, the applicability of the methodology to support decision making unequivocally in W2E and in general in waste re-use has not been thoroughly studied. LCA provides certain amount of information that only expert practitioners can eventually interpret to guide the decision making process. W2E field provides additional challenges, for the intrinsic difficulty in defining the system boundaries, material and energy balances. The questions that this study will address are the following:
How can the information derived from an LCA be used to support the strategic decision making process?
How can we understand the single contributions that mostly influence the environmental performance of a given product or service?
How can we account for the uncertainty that sometimes accompanies some of these evaluations?
And finally, which is the right methodological approach to deal with these questions?
Purpose of the Research
The main purpose of the research is to contribute to both the theoretical and practical application of LCA, developing a solid methodology for strategic decision making that combines mathematical and optimisation models. After developing the methodology the author will test each proposed step with specific case studies. In order to introduce the concept of uncertainty within the methodology, the author will also test the definition of an
expert system based on Fuzzy logic. Finally the theory should be proven also in the W2E field, with an application within the building industry, evaluating the long term strategic perspective of using solid waste materials otherwise destined to incineration or bio degradation.
Chapter 2 From Environmental Assessment to Strategic Environmental Maps
The ecological footprint is a way to compare human demand with our planet capacity to regenerate it and it is measure of our burden on the ecosystem (Stoeglehner 2003). Usually it represents the amount of biologically productive land and sea area needed to regenerate the resources consumed and to absorb the corresponding waste. Different footprints have been developed, to consider the impact of different resources. In a broader view the ecological footprint is related to the method of LCA, which is typically used for products and services, but also applicable for production plants and regions. One of LCA's advantages is that it better covers the whole range of impacts, and it may also provide an accounting of the upstream impacts. Recent studies have tried to combine the different footprints from the environmental assessment into a ―family‖ to provide support in the decision making process (Galli, Widemann, Ercin et al. 2012).
Nevertheless, one of the most important limitations in the application of LCA as an input for strategic decision-making from an environmental perspective is the limited inclusion of cost and investment considerations. The author proposes in this study, and for the first time, a new approach to integrate financial, environmental, resource and toxicological considerations into a single analysis. The core of this new concept is to calculate some specific sustainability indicators, based on LCA. This will help one define the relevant contributions to support strategic decision making. The cradle to grave approach will assure that all environmental and human consequences taken into account. These must be further balanced against financial and resource consumption considerations.
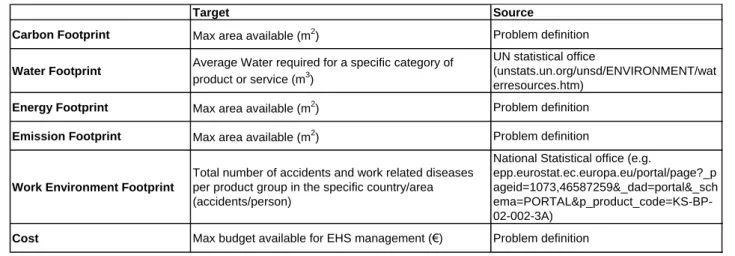
When evaluating different options from a strategic perspective, the author proposes to evaluate them against the following categories:
Carbon footprint (Hujbregts, Hellweg, Frischknecht et al. 2008, Wiedmann, Lenzen 2007);
Water footprint (Hoekstra and Hung 2002, Hoekstra 2008);
Energy footprint - Land, Renewables, Non-Renewables (Stoeglehner 2003);
Emission footprint - emissions in Air, in Water, in Soil, Waste materials (Sandholzer and Narodoslawsky 2007);
Work environment footprint - work-environment and toxicological impacts (Schmidt, Poulsen, Andreasen et al. 2004).
Cost should also be considered as an additional category, possibly representing the crucial relation that it has with all other categories.
To represent these relations and to compare options from an environmental and, more generally, business perspective as a first result of this study the author introduces a new graphical representation: the Environmental Performance Strategy Map (EPSM). The objective of this representation is to build upon the strength of Ecological Footprint and Life Cycle Analyses to provide a single indicator for each option. The practitioner can make use of this indicator to direct the decision-making process towards the best option from a sustainability and environmental perspective.
The first step in building the EPSM correctly is to calculate the impact of the option under analysis for all the above mentioned footprints. The combination of these elements and the cost perspective will provide a single indicator to assign to each option. The comparison between different options, with different characteristics and ratio of advantages and
disadvantages will be facilitated also by a graphical representation. The best option, from an environmental and financial perspective will be selected based on this approach.
What footprints?
Different methods have been developed in the last years to correlate environmental sustainability of specific activities with land and water areas required to supply this activity with resources and to absorb its wastes (Monfreda, Wackernagel, Deumling 2004). This is usually referred to as Ecological Footprint.
Some initial objections to the original method on the way energy is accounted for Ferng (2005), as well as difficulty in using the tool in the decision making process (Ayres 2000), have been overcome by the development of specific indicators (SPI by Krotscheck, Narodoslawsky 1996 and DAI by Eder, Narodoslawsky 1999). In particular the Sustainable Process Index (SPI) considers the area as a basic measure: the more area a process requires, the more its burden from an ecological point of view. The SPI method is based on the comparison of natural flows with the mass and energy flows generated by a technological process. The calculation of an SPI centres on the computation of the total area required (Atot):
Atot = AR + AE + AI + AS + AP Eq. 2.
where AR is the area required to produce the raw materials (given as the sum of the areas to provide renewable raw materials, fossil raw materials and non-renewable raw materials), AE is the area needed to produce process energy, AI is the area required for the process installations (equipment/plant), AS is the area required for support staff and AP is the area
required for the accommodation of products and by-products (Krotscheck, Narodoslawsky 1996).
A model that proposes the combination of ecological footprinting with economic considerations is proposed in the Ecological Value Added system (Kratena 2004). This is based on an input-output system and upon the ecosystem pricing concept, introduced via energy values and the ecological footprint. The balance between carbon sinks and emissions defines the sustainability target for this model.
In order to provide a more comprehensive analysis of the interaction of the environmental burdens and financial costs, the Environmental Performance Strategy Map is based on the combination of the following five footprints.
Carbon footprint
With environmental issues high on the business and political agenda, different definitions of the individual contribution to CO2 emissions have been proposed in the last years (Wiedmann, Lenzen 2007). Usually they are referred to as carbon footprint. In response to this public attention, different tools have been proposed to calculate the value of the carbon footprint, in relation to a product or process (Padgett, Steinemann, Clarke et al. 2008). Even though these tools are useful in increasing public awareness, they often lack transparency and might provide conflicting results.
For the purpose of building the Environmental Performance Strategy Map the author refers to a land based definition, where the carbon footprint estimates the land area required to sequester atmospheric fossil CO2 emissions through afforestation (Monfreda, Wackernagel, Deumling 2004). This area is calculated as (Hujbregts, Hellweg, Frischknecht et al. 2008):
𝐶𝐹 = 𝑀𝐶𝑂2×1−𝐹𝑆 𝐶𝑂 2
𝐶𝑂 2 × 𝐸𝐹 Eq. 2.