O R I G I N A L A R T I C L E
Preliminary analysis on roles of metal–organic compounds in the formation of invisible gold
Medet Junussov1 •Ma´dai Ferenc2• Krista´ly Ferenc1•To´th Tivadar3• Fintor Krisztia´n3•Mura´nszky Ga´bor4•Prekob A´ da´m4•Ha´mor-Vido´ Ma´ria5
Received: 25 January 2021 / Revised: 12 August 2021 / Accepted: 16 August 2021 / Published online: 9 September 2021 The Author(s) 2021
Abstract The paper comprises new analytical data on the nature and occurrence of gold in solid pyrobitumen, closely associated with the main gold-bearing sulfide arsenic ores of the Bakyrchik gold deposit (Kazakhstan), related to post-collisional magmatic-hydrothermal origin. Gold min- eralization of the deposit occurs mainly in the form of an
‘‘invisible’’ type of gold in the structures of arsenian pyrite and arsenopyrite, and the form of gold-organic compounds of pyrobitumen in carbonaceous-terrigenous sequences of Carboniferous formation. Microscopic and electron microscopic analysis, Raman and FT-Infrared analysis, mineralogical and three-step sequential extraction analysis (NH2OHHCl, H2O2, HNO3?HCl) has been carried out using 9 ore samples (from 3 different types of ores) for a comprehensive study of pyrobitumen and sulfide arsenic ores focusing mainly on organic matter. The sequentially extracted precious metal content of pyrobitumen reaches
up to 7 ppm gold and other metals like Ag 4 ppm, Pt 31 ppb, and Pd 26 ppb, forming metal–organic com- pounds, while arsenic sulfide minerals incorporate 11 ppm gold, 39 ppm Ag, 0.49 ppm Pt. The enrichment of gold associating with organic matter and sulfide ore minerals was confirmed in this study. Organic matter was active in the migration of gold and the capture of gold by pyrobi- tumen. Moreover, the reductive organic matter agent released gold, most likely for the sulfide arsenic ore min- erals. Pyrobitumen was a decisive factor in the concen- tration, transportation, and preservation of gold in the deposit.
Keywords GoldPyrobitumenBakyrchik Vitrinite Metal–organic compounds
& Medet Junussov
medet.junus@gmail.com Ma´dai Ferenc
askmf@uni-miskolc.hu Krista´ly Ferenc kristalyf@gmail.com To´th Tivadar
mtoth@geo.u-szeged.hu Fintor Krisztia´n efkrisz@gmail.com Mura´nszky Ga´bor
gabor.muranszky@gmail.com Prekob A´ da´m
kempadam@uni-miskolc.hu Ha´mor-Vido´ Ma´ria hamorvido@gmail.com
1 Department of Mineralogy and Petrography, Institute of Mineralogy and Geology, Faculty of Earth Sciences and Engineering, University of Miskolc,
Miskolc-Egyetemva´ros 3515, Hungary
2 Institute of Mineralogy and Geology, Faculty of Earth Sciences and Engineering, University of Miskolc, Miskolc-Egyetemva´ros 3515, Hungary
3 Department of Mineralogy and Geochemistry, Faculty of Science and Informatics, University of Szeged, Aradi ve´rtanu´k tere 1, Szeged 6720, Hungary
4 Institute of Chemistry, Faculty of Material Sciences and Engineering, University of Miskolc,
Miskolc-Egyetemva´ros 3515, Hungary
5 Department of Geology and Meteorology, Institute of Geography and Earth Sciences, Faculty of Sciences, University of Pe´cs, Vasva´ri pa´l utca, Pecs 7622, Hungary https://doi.org/10.1007/s11631-021-00494-y
1 Introduction
Analytical and experimental analysis of metal–organic compounds of solid pyrobitumen is the main aim of the study in this paper. The study of solid pyrobitumen and its relationship with the ‘‘invisible’’ gold leads to three research tasks: to determine the occurrence and mechanism of migration and entrapment of gold by liquid hydrocar- bons (1); the preservation of gold in hydrothermally altered sedimentary rocks (2); and to understand the impact of hydrocarbon migration on gold mineralization resulting in the formation of ‘‘invisible gold’’ in arsenic sulfide min- erals (3).
The so-called type ‘‘invisible gold’’ as first described by Bu¨rg (1930), is ionic gold (or submicroscopic form) in the form of a solid solution structurally binding in arsenic sulfides (Cabri et al. 1989; Cook and Chryssoulis 1990;
Fuxin et al.2001; Vikent’ev2006; Wu et al.2016; Volkov et al. 2017; Osovetsky 2017; Large and Maslennikov 2020), which is not detectable by electron microscopy, being smaller than 0.1lm (up to 10 nm) with concentra- tion less than 0.5 ppm (Cook and Chryssoulis1990; Large and Maslennikov2020) It accounts for 10%–15% of world gold production (Berger 2014). Gold content generally increases with arsenic content (Fleet et al.1993), possibly related to arsenic content in the host mineral (Cabri et al.
1989) which is common in arsenopyrite (Cook and Chryssoulis 1990), since gold can substitute Fe in the arsenopyrite lattice (Wu and Delbove 1989). Gold-rich arsenopyrite is paragenetically associates with organic materials (Hanping et al.,1999). Therefore, organic mate- rials are often found in sulfide deposits with invisible gold sulfide deposits (Jiuling et al. 1997), where there is a positive correlation between gold content and organic carbon (Farel’1980,1984), being an active chemical agent in ore-forming processes (Giordano 1994; Giordano and Kharaka1994). It was assumed that gold sulfide ores and organic materials are deposited together as a result of precipitation caused by changes in temperature, pressure, and pH of the gold-bearing fluid (Romberger1988) with the formation of metal–organic compounds, where organic matter can play a significant role in the metallogenesis of a sulfide gold deposit (Gatellier and Disnar1989; Parnell and McCready2000; Ross et al.2011).
The formation of metal–organic compounds has been investigated by many authors (Merwin1968; Radtke and Scheiner1970; Baskakova1970; Saxby1976; Emsbo and Koenig 2007; Parnell and McCready 2000; Ross et al.
2011; Migdisov et al. 2017) in coal, bitumen and solid pyrobitumens in which gold occurs in soluble and insoluble fractions from a few tenths of ppb to several thousands of ppm (Crocket 1991; Wood 1996; Razvozzhaeva et al.
2002; Ross et al. 2011; Fuchs et al. 2016). The role of metal–organic compounds in migration and entrapment of gold has been reported by several authors (Baskakova 1970; Saxby1976; Boyle1979; Giordano2000; Migdisov et al. 2017; Simoneit 2000,2018). The organic matter of phenolic aromatic and thiophenic sulfur compounds in hot aqueous ore fluids can favor the transfer of metals (Gior- dano and Kharaka1994; Giordano2000) and accumulation with metals occurred in the transformation from liquid bitumen, later precipitated as solid bitumen and, finally into solid pyrobitumen.
Solid pyrobitumen, as defined by Stasiuk (1997), is a high-temperature form of solid bitumen (Jacob 1989), a highly aromatic and insoluble bituminous substance (Glikson et al.2000; Huc et al.2000) of higher rank (more than R0= 2%). It has no fluorescence or weak (brown, wavelength[650 nm) fluorescence (Glikson et. al.2000) and occurs as petroleum (Rogers et al.1974; Milner et al.
1977; Hunt 1978; Jacob1985), as direct thermal cracking of oil at great burial depths (Waples 2002), where it is generally related to magmatic activity and hydrothermal fluid convection at temperatures from 60 to 400C (Si- moneit1994,2000,2018).
2 Geological settings
2.1 The deposit and regional geology
The sulfide-ore-bearing carbonaceous-sedimentary forma- tion of the Bakyrchik gold deposit is located in Auezov township (75 km from O´ skemen city), East Kazakhstan.
The gold reserves of the deposit are 410 t, on average 8–9 g/t (Goldfarb et al.2014; Dyachkov et al.2017). Gold mineralization is of a stratiform type (Zhautikov and Maulenov1985) formed in the Middle-Late Carboniferous (C2–3) (Dyachkov et al. 2011). The bulk (90%) of gold in the deposit occurs as an ‘‘invisible gold’’ type, bound to the lattice of arsenian pyrite and arsenopyrite (Umarbekova and Dyusembaeva 2019) and gold concentrates in a structure of amorphous organic matter (Marchenko and Komashko 2011). Gold is enriched with arsenic sulfide minerals in the presence of organic matter (0.2%–0.4%) in host siltstone rocks (Rafaylovish et al.2011; Azerbaev and Zhautikov2013). The presence of gold in the carbonaceous matter has a sedimentogenic origin in association with other precious metals (Azerbaev and Zhautikov2013).
The total carbon content of the organic carbon and carbonates is 0.3%–26.5% in the host rocks and 2.5%–6%
in ore zones (Rafaylovich et al. 2011). In ore zones, the content of arsenopyrite ranges from 0.3% to 15% while arsenian pyrite varies between 1.5% and 22% (Rafaylovich et al.2011). The gold content in organic matter can reach
10%–30% in the form of a metal–organic complex (Marchenko2010), while the gold content in arsenopyrite can reach more than 150 and 60 ppm in arsenian pyrite (Levitan 2008), respectively. Platinum group metals are also common in arsenian pyrite and arsenopyrite-bearing ores, up to 1 ppm (Rafaylovich et al.2011), forming nano- and microforms (Narseev et al.2001), and in nanostruc- tured particles of organic materials in the deposit (March- enko and Komashko2011).
The regional geology of the Bakyrchik gold deposit, as explained by Lubecky (2008) and (Wong2017) shows that the gold deposit was formed in an ophiolite suture zone relating to post-tectonic plate collisions of the Kazakhstan microcontinent and the Siberian craton in the Late Car- boniferous (C3), which includes the Late Palaeozoic Var- iscan Orogenic tectono-magmatic event (Parnell2019).
Parnell (2019) considered the deposit as one of the most important gold occurrences related to the global coal reservoir of Variscan gold formation during the Late Car- boniferous (300 Ma). During the tectono-magmatic event, the collision contributed to the formation of the Kunush granitic batholith in the Late Carboniferous-Early Permian (C3-P1) (Rafaylovich 2009) and the Qyzyl thrust fault (Dyachkov et al.2017). The Qyzyl thrust fault (2 km long and 30–50 dip in the north) lies within the ore bodies, occurs in carbonaceous-terrigenous rocks of molasses and limnic coal-bearing formations of the Middle-Late Car- boniferous (C2–3) Bukon suite in the Middle-Late Car- boniferous (C2–3) (Dyachkov et al. 2011; Umarbekova et al.2017b), as shown in Fig. 1a, b.
2.2 Stratigraphy
The recent structure of the deposit shows to a terrigenous basin, including a carboniferous sequence from the marine in the Early Carboniferous (C1), coastal-marine in the Middle Carboniferous (C2), and continental carbonaceous molasses in the Middle-Late Carboniferous (C2–3) (Lubecky et al. 2008), see Fig.1b. The lower part of the stratigraphic sequence comprises a 1500 km thick car- bonate and volcanogenic shales and volcanoclastic sand- stones containing lenses and interlayers of gritstone and carbonaceous-cherty siltstones. The upper part of the sequence consists of 600–800 m thick sandstone with layers of carbonaceous siltstones with fossil remains of Prinadacopteris aff. Sibirica (Zal.) Radcz., Neuropteris dichotoma Neub., Gondwanidium sibicium (Pet.) Zal.
Carbonaceous-terrigenous sequences are cut through by a magmatic formation (depth 3–3.5 km), which is parage- netically associated with ore mineralization, and within its single stocks and numerous dikes of plagiogranite por- phyries, and diorite porphyries forming belts of the
northwestern and sublatitudinal strike (Rafaylovich et al.
2011; Umarbekova et al.2017b).
3 Samples and methods
3.1 Sampling and analytical method
A total of nine rock samples were selected for analytical and experimental observation from the organic-rich sedi- mentary bedrocks, from three mineralization zones, located near the shear zone in the open pit (see Fig.2a). The first three samples relate to the lower zone of pre-ore mineral- ization, the second three represent the main ore mineral- ization zone, and the last three samples of the third group were collected from the upper surface zone of post-ore mineralization.
The first three samples (group I) (Bak 2; Bak 1; Bak 2.5) are carbonaceous-siltstone rocks; the next three samples of the second (group II) (Bak 2.2; Bak 2.3; Bak 2.1) are arsenic sulfide-rich carbonaceous-siltstones and the last three samples (group III) (Bol; Bak 2.4; Bak 2.25) of the third (III) group are antimony sulfide-rich carbonaceous- siltstone rocks (shown below in Fig. 2b).
Petrographically, all samples are of unmetamorphosed dark siltstones containing a high amount of solid pyrobi- tumen and dispersed arsenian pyrite and arsenopyrite appearing in quartz veins within authigenic clay particles.
The solid pyrobitumen in its host rocks fills in veinlets and veins of quartz showing black color, medium metallic luster, and has a brittle, partly flaky structure. Its density is less than 2 g/cm3 and hardness is between 2.5 and 3 (in Mohs scale).
Polished specimens mounted in epoxy resin were pre- pared from the rock samples enriched with solid pyrobi- tumen and sulfide ore minerals for optical microscopy, electron microprobe analysis (EMPA), and Raman microscopy.
For analytical measurements, the samples were crushed into powder (10*50lm) in a tungsten carbide ring mill and then in an agate mortar, homogenized, and portioned for further measurements. X-ray fluorescence (XRF), X-ray powder diffraction (XRPD), and Soxhlet extraction were performed for each sample. Carbonate-free powders were used for the Fourier-transform infrared spectroscopy (FTIR) with an attenuated total reflectance (ATR) attach- ment and organic elemental analysis (OEA) after removing inorganic carbonate minerals with 10% chloric acid. Bulk and sequentially separated samples were analyzed for gold concentration by inductively coupled plasma-optical emission spectroscopy (ICP-OES, 720 ES made by VAR- IAN Inc., Arial Plasma-view, simultaneous multi-element
Fig. 1 Geological map of the Bakyrchik gold deposit (a) and stratigraphic column with lithological facies of the Bukon suite of the deposit (simplified after Trubnikov1976; Seitmuratova et al.1997; Umarbekova et al.2017a). (complied by CorelDRAW Graphics Suite X6)
Fig. 2 Overview map of the study area (a) showing the sampling area marked with dashed lines and fragments of nine samples (b) from the three separate groups. (complied by Google Earth Pro and Adobe Photoshop CS3)
ICP spectrometer) during the experiment, described more in chapter 3.2.
Reflected-light organic petrography was performed on a Zeiss UMSP 50 microscope, using 509oil immersion lenses (R.I. of the oil = 1.5180). A Zeiss AxioImager (A2m) microscope was used for imaging in incident nor- mal and fluorescence light.
The electron microprobe analysis (EMPA) with backscattered electron (BSE) imaging, energy dispersive spectroscopy (EDS), and X-ray mapping was carried out on a JEOL SXA 8600 Superprobe (20 keV and 20 mA), for elemental analysis of the arsenic content in pyrite; as well as for sulfur, chlorine and phosphorous content in the organic phase.
Thermal maturity of the organic matter was character- ized by Raman microscopy (Thermo Scientific DXR Raman Microscope 532 nm Nd-YAG solid-state laser and OMNIC for Dispersive Raman 8.3.104 software), acquiring 47 measurement points focused on the three petrographi- cally different types of organic materials of the whole rock samples and for one demineralized concentrated kerogen sample. The demineralization of kerogen was carried out with removals of carbonates using 10% HCl (for 2 h, at 60C in a water bath), and silicates and quartz minerals using 40% HF: 10% HCL (3:1, for 5 h, at 70C) into a platinum dish and then the kerogen was separated physi- cally from sulfide minerals into a sodium polytungstate heavy liquid. The Raman measurements were collected on orderly oriented organic phases acquiring 5–10 spectra for each sample. The laser beam was focused to a width of about 0.9lm with a 100X objective varying to 109and 509due to the sizes of organic materials. The numeric aperture (NA) of objective was 0.90. The beam was aimed perpendicular to the polished section. The peak measure- ments were collected in the 500–3500 cm-1 range in the first-order and second-order regions.
Total organic carbon (TOC) and organic molecular structure were analyzed by OEA (ELTRA’s CS-2000) and FTIR (FTS-14) with ATR; amorphous matter and mineral inclusions were determined by XRPD (BRUKER D8 ADVANCE Cu-Ka40 kV, 40 mA), and selected elemen- tal composition of minerals was measured by XRF (WDX- XRF (RIGAKU Supermini Pd source, 50 kV-4 mA).
100 g of powdered samples were extracted into a cel- lulose thimble of the Soxhlet apparatus (Bu¨chi B-811) with a mixture of dichloromethane (837 mL) and methanol (63 mL) at 46C for 3 days. Due to the low organic carbon content, the extracts were not separated further into frac- tions of saturated and aromatic hydrocarbons.
All the above-mentioned petrolography, analytical instruments, and laboratory works were carried out at the University of Miskolc, except for the Raman measurement
which was carried out at the University of Szeged, Hungary.
3.2 Experimental method
A three-step sequential extraction method to remove gold from soluble fractions in nine samples was chosen for the experiment. The experiment has been performed by many authors (Beckett 1989; Davidson et al.1999; Liang et al.
2016) to extract and evaluate heavy metals associating with sulfide and organic fractions.
The experiment was performed by a three-step sequen- tial extraction method (Dold and Fontbote 2001; Usman- ova et al. 2017). Experimental materials comprised a test tube rack (woody), funnel, and 11 cm diameter of filter paper (Filtrier-Papier Nr. 5893 Blauband Marke Selecta- Germany) for filtration procedures and an oven for drying fractions after filtration on each stage and the chemical reagents of hydroxyl ammonium chloride (NH2-OHHCl), hydrogen peroxide (H2O2) and aqua regia (HNO3?HCl) provided by the Chemical Department of Miskolc University. For the experiment, samples were selected containing the largest amount of organic matter and arsenic sulfide-rich minerals from the nine rock samples. They were separately crushed to a size of less than 63lm, using an agate mortar and pestle. Size reduction of samples was done by the method of coning and quartering. After the crushing process, powder samples consisting mostly of organic matter and arsenic sulfide minerals have weighed a maximum of 5 g of every nine samples for the experiment.
At the first stage, for dissolving iron oxide and sulfides, 5 g of powder samples were added to and mixed manually with 45 mL of 1 M NH2OHHCl (hydroxylammonium chloride) at pH 4.5. Then the tube was shaken for 2 h at room temperature. The extract was decanted into a plastic test tube. Then the residue was prepared for the next step by washing it with distilled water and left in the oven for drying at 60C.
At the second stage, the purpose was to extract gold associate with organic matter. The residue of the sample from stage 1 was weighted; 2 g of powder was mixed manually with 18 mL of 30–35 % H2O2 (hydrogen per- oxide) added into a glass beaker (100 mL). After the mixing process, the glass test tube was placed into a water bath at 85C water for 1 h. After this procedure, it was decanted and filtrated, to divide liquid extracts and solid residues. The residue materials were kept for the third step.
At the third stage (for sulfide minerals, mostly arsenopyrite), the residue material from the first step was weighed; 1 g of the powder samples was mixed with 9 mL aqua regia (68% HNO3–37% HCl, 1:3). Then the mixture was placed into a water bath at 100C for 1 h. After fin- ishing, the liquid extract was filtered as in the former
process, ready to measure, the gold extraction from arsenic sulfide minerals. The liquid extracts of three steps were measured by ICP-OES for gold and other precious metals concentrations. The residues of extracts were examined by XRPD in a presence of an amorphous and mineral phase.
4 Results 4.1 Petrography
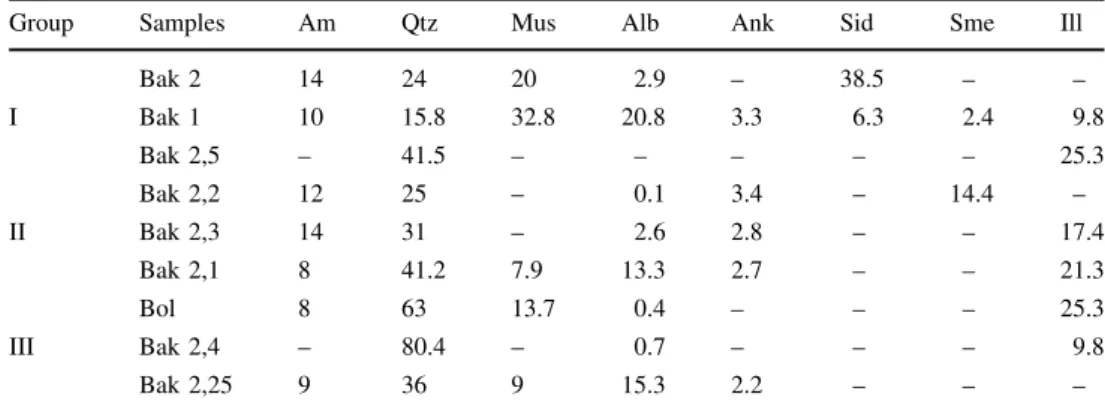
The nine rock samples are of the non-metamorphosed origin of clay minerals and contain typical sulfide and organic-rich sedimentary rock minerals: XRPD values show muscovite (average 10.5 wt.%), albite (average 5 wt.%), and illite (with low-grade smectite, general average 17 wt.%), hydrothermal carbonate minerals (ankerite and siderite, general average 16 wt.%), and quartz. Quartz is found as vein and veinlets which penetrate diagonally into laminated clay minerals as secondary minerals, indicating a hydrothermal origin. Hydrothermal quartz is found in an average of 25.1 wt.% in bulk samples and paragenetically associated with the arsenic sulfide ore minerals, antimony minerals, and solid pyrobitumen as veins and veinlets in clay seams (see in Fig.3a, b and Table1).
The solid pyrobitumen appears mostly in two types of veins (see in Fig.3b) and its content varies between 8 and 14 wt.% (average 11 wt.%, shown in Table1) in all three groups (except vitrinite, presented in Bak 1, Bak 2.1, and Bak 2.5) of samples. It has an amorphous structure (de- scribed more in detail in the next chapter). The solid pyrobitumen of samples in thin sections is opaque, and it appears as dark and partly brownish-grey fillings of veins and veinlets. Usually, it is optically isotropic or weakly anisotropic.
The solid pyrobitumen appears as flow-like textures and covers quartz grain boundaries with very narrow (less than 1lm) to broad (*0.25 mm) rims, filling in voids and microcracks or forming lenses showing the results of migration.
4.2 Organic petrology
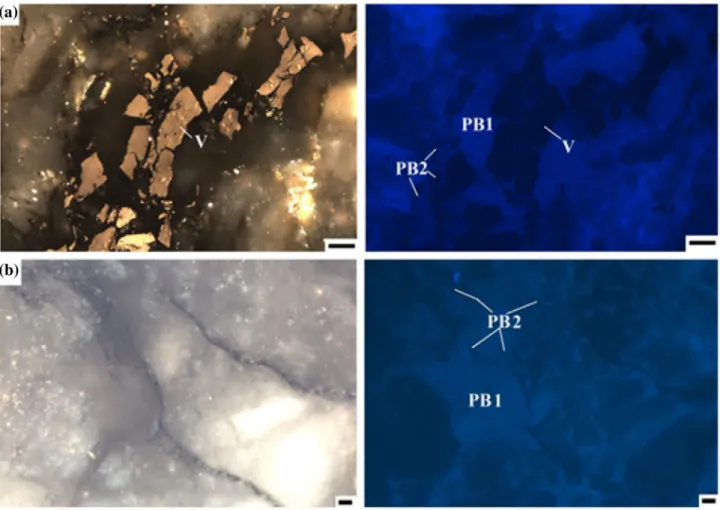
The organic matter found in all nine samples is represented by dark brown to grayish color veined pyrobitumens (de- noted as PB1 and PB2) and by reworked vitrinite as trap- ped and cracked, angular-shaped maceral in the middle of the hydrothermal fracture zone. The pyrobitumen has fracture- and void-filling textures showing two different microscopic features. The two veined pyrobitumens can be distinctly recognized under fluorescent light excitation: one has light brownish-grey fluorescence (PB1), while the other has a dark brown color in reflected white light and is non-
fluorescing (PB2). This later occurs in large fractures and voids of quartz (found in all samples).
The two veined pyrobitumens fill in two main quartz veins of different sizes. The fluorescing PB1 bitumen occurs as a diffuse bituminous matrix or a continuous pretty thin membrane on the quartz, which is adhered also to the wall rocks. This pyrobitumen type usually occurs on the majority of quartz veins (Fig.4).
The non-fluorescing (PB2) pyrobitumen is a discontin- uous membrane filling the veins with a diameter smaller than 0.5lm, adhered to wall rocks (Fig.4).
The two pyrobitumens are closely associated with sul- fide ore minerals in hydrothermal quartz veins and veinlets.
Two pyrobitumens occur in the veinlets like patches of diffused pyrobitumen or following the grain boundaries (Fig.4a, b).
The reworked vitrinite (V) is characterized as cracked smaller vitrinite particles of more- or less linear character and parallel with the fracture orientation, locating in the middle of large voids later filled by spheroidally growing quartz. This reworked vitrinite appears relatively rarely; it occurs in the first and second groups of samples (found only in three samples of Bak 1, Bak 2.1, and Bak 2.5). In the reworked vitrinite framboidal pyrite also occurs (Fig.4a). The elemental content of the reworked vitrinite obtained by EMPA is shown in detail below in chapters 4.4 and 4.5.
4.3 Ore mineralogy
The ore microscopic observations show that the samples have ore mineral assemblages of gold-bearing arsenian pyrite and arsenopyrite, stibinite, and valentinite. The arsenic pyrite was found in cubic and hexahedral textures while arsenopyrite mineral in the samples had a twin-tab- ular and acicular form (see Fig.5a, b). The antimony ore minerals are stibnite and valentinite, found in the open space of hydrothermal quartz veins in the form of over- growths of fibrous textures (shown in Fig.5c). Free gold was not detected in samples under optical microscopy.
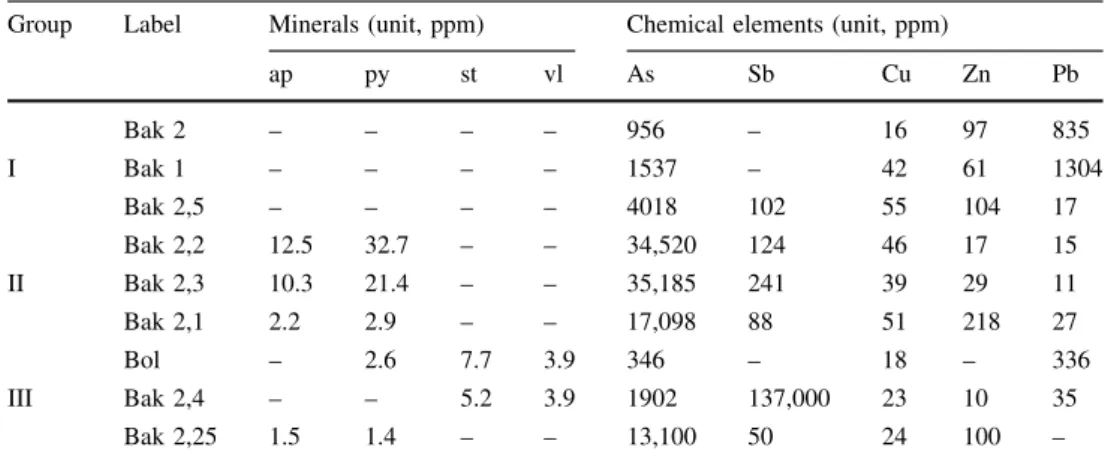
The arsenic sulfide ore minerals were found mostly in the three samples of the second group; they always occur alongside the veins of hydrothermal quartz (Figs.3 and 5a). The amount of arsenian pyrite varies between 1.5 and 32.7 wt.% (average 7.7 wt.%), while the amount of arsenopyrite varies between 1.5 and 12.5 wt.% (average 4.2 wt.%). The antimony minerals have values between 3.9 and 7.7 wt.% (average 6.5 wt.%), found only in three samples of the third samples group, related to the upper surface zone of mineralization (see in Table2). Maximum arsenic content up to 35,185 ppm in the second sample group and the lowest value is 346 ppm in the third group of samples while the antimony shows the highest value up to
Fig. 3 Transmitted microscopy images under plane-polarized light of hydrothermal quartz veins (qtz) withaarsenic sulfide ore minerals and btypical pyrobitumen in the samples Bak 2.5. Scale: 0.2 mm
Table 1 Quantitative results for rock minerals and amorphous matter from nine samples (unit, wt%)
Group Samples Am Qtz Mus Alb Ank Sid Sme Ill
Bak 2 14 24 20 2.9 – 38.5 – –
I Bak 1 10 15.8 32.8 20.8 3.3 6.3 2.4 9.8
Bak 2,5 – 41.5 – – – – – 25.3
Bak 2,2 12 25 – 0.1 3.4 – 14.4 –
II Bak 2,3 14 31 – 2.6 2.8 – – 17.4
Bak 2,1 8 41.2 7.9 13.3 2.7 – – 21.3
Bol 8 63 13.7 0.4 – – – 25.3
III Bak 2,4 – 80.4 – 0.7 – – – 9.8
Bak 2,25 9 36 9 15.3 2.2 – – –
Amamorphous matter,Qtzquartz,Musmuscovite,Albalbite,Ankankerite,Sidsiderite,Smesmectite,Ill illite
Fig. 4 Photomicrographs of solid pyrobitumen (left is normal reflected light and right is ultraviolet excitation in oil immersion) filling in hydrothermal quartz veins: reworked vitrinite (V) associated with fluorescing brownish grey (PB1) and non-fluorescing dark brownish solid pyrobitumen (PB2) and pyrite;bfluorescing coating. Right: parallel polarized light in oil immersion. Left: ultra-violet fluorescent excitation of diffused and fractured solid pyrobitumen filling (PB1) associated with non-fluorescing solid pyrobitumen (PB2). Right: parallel polarized light in oil immersion. Left: ultra-violet fluorescent excitation. Scale: 10lm
Fig. 5 Photomicrographs of ore microscopy:acubic pyrite (py), acicular arsenopyrite (asp), and pyrobitumen (PB2 and PB3) occurring within hydrothermal quartz veins;bhexahedral pyrite (py) and tabular arsenopyrite (asp) in quartz veins (qtz);cstibnite and antimonite into quartz veins (qtz). Scale: 10lm
137,000 ppm in the third group of samples (shown in Table 2). The elemental compositions of the sulfide ore minerals are described below.
4.4 Microprobe analysis for reworked vitrinite and ore minerals
Microprobe analysis is carried out for reworked vitrinite grains and two other vein types of pyrobitumen. Other authors also mentioned the detection limit problem (Belin 1994; Cardott 2007). Pyrite growing over the reworked vitrinite appears in globular framboids or sometimes polyframboids was found only in the first group of samples.
The framboidal pyrite is of sedimentary-digenetic origin with a diameter of 2–50 micron, showing no presence of arsenic (Fig.6). The reworked vitrinite contains more than 90 wt.% carbon element and oxygen of 4–6 wt.%.
Moreover, the reworked vitrinite has a relatively higher S content, between 0.78 and 1.27 wt.% P (0.15–0.19) and
Cl (0.09–0.12 wt.%). Fe is detected as 0.23 wt.%, while Ti varies between 1.19 and 2.77 wt.% in some samples.
Si is detected up to 0.32 wt.% and Al is up to 0.25 wt.%, and with minor amounts of K and Mg in the range of 0.08–0.17 wt.% present in organic matter. The minor amounts of Si, Al, K, and Mg are most likely present in the reworked vitrinite, due to the vicinity of the rock minerals.
Framboidal pyrites occur up to 8lm in reworked vit- rinite grains, where they are enriched in Zn up to 0.43 wt.%, As to 0.46 wt.%, and Sb to 0.49 wt.% in some samples. This indicates that framboidal pyrites are of a hydrothermal origin as a co-precipitation.
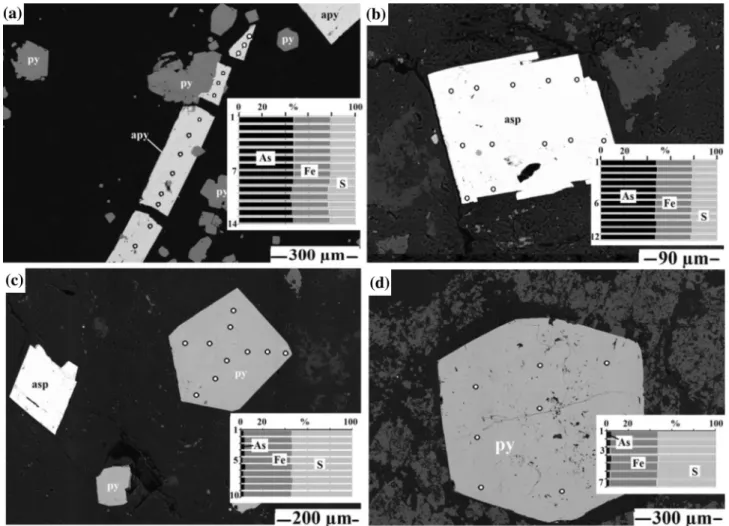
Additionally, using EMPA-EDS, 66 points were ana- lyzed on the surfaces of individual arsenic sulfide crystals in polished sections for the detection of gold and arsenic elements (part of analytical points on grains shown in Fig.7). The EDS results show varying chemical concen- trations within different morphogenetic shapes and sizes.
Cubic and hexahedral shapes of pyrite were found in the Table 2 Mineralogical and
chemical compositions of sulfide ores in three groups of nine samples
Group Label Minerals (unit, ppm) Chemical elements (unit, ppm)
ap py st vl As Sb Cu Zn Pb
Bak 2 – – – – 956 – 16 97 835
I Bak 1 – – – – 1537 – 42 61 1304
Bak 2,5 – – – – 4018 102 55 104 17
Bak 2,2 12.5 32.7 – – 34,520 124 46 17 15
II Bak 2,3 10.3 21.4 – – 35,185 241 39 29 11
Bak 2,1 2.2 2.9 – – 17,098 88 51 218 27
Bol – 2.6 7.7 3.9 346 – 18 – 336
III Bak 2,4 – – 5.2 3.9 1902 137,000 23 10 35
Bak 2,25 1.5 1.4 – – 13,100 50 24 100 –
Aparsenopyrite,Pypyrite,Ststibnite,Vlvalentinite
Fig. 6 BSE images showing the chemical composition of vitrinite (V) and growths of framboidal pyrites on the vitrinite (unit wt.%)
samples of the second group. They are of hydrothermal origin with 0.15–0.5 mm in size. Arsenic was found in the cubic pyrite between 0.97 and 3.68 wt.% (average 2.32 wt.%) and 2.7–4.86 wt.% (average 3.78 wt.%) in the hexahedral pyrite. Gold was not detected in these pyrite grains.
Arsenopyrite crystal has twin-tabular and acicular forms in the second group of samples. The average size of the twin-tabular arsenopyrite crystal is 0.2 mm and the acicular crystal is between 0.6 and 1 mm in length and about 75 microns in width. Arsenopyrite has an apparent arsenic content of over 42 wt.% and has no detected gold inclusions.
Antimony content is measured over 80 wt.% in valen- tinite and less than 73 wt.% in stibnite. These minerals have no arsenic and gold inclusions.
4.5 X-ray maps of sulfur content for reworked vitrinite
EMPA X-ray map shows that organic sulfur covers reworked vitrinite grains (Fig.8a, c). Several light white spots on the reworked vitrinite show growths of individual sulfide crystals of sphalerite and pyrite in the map (Fig.8b). The reworked vitrinite includes globular pyrite up to 5lm in size (denoted as pyrite 1 in Fig.8b), con- taining relatively lower amounts of arsenic (1.02 wt.%), and the absent elements of copper, zinc, and antimony, which are present in the acicular form, and crystal-shaped pyrite with a size of 30lm (designated as pyrite 2 in the Fig.8b). Reworked vitrinite occurs also in intergrowths with tiny globular sphalerite grains, 3–5 lm in size (Fig.8b).
Fig. 7 Photomicrograph of arsenopyrite and arsenian pyrite analysis on the chemical compositions (point analysis) of crystal grains for different textures.aAcicular grains of arsenopyrite;btabular-twin grains of arsenopyrite;cpentahedral grains of pyrite crystal with tabular-arsenopyrite twin;dhexahedral grains of pyrite crystal
4.6 Thermal maturity and reflectance
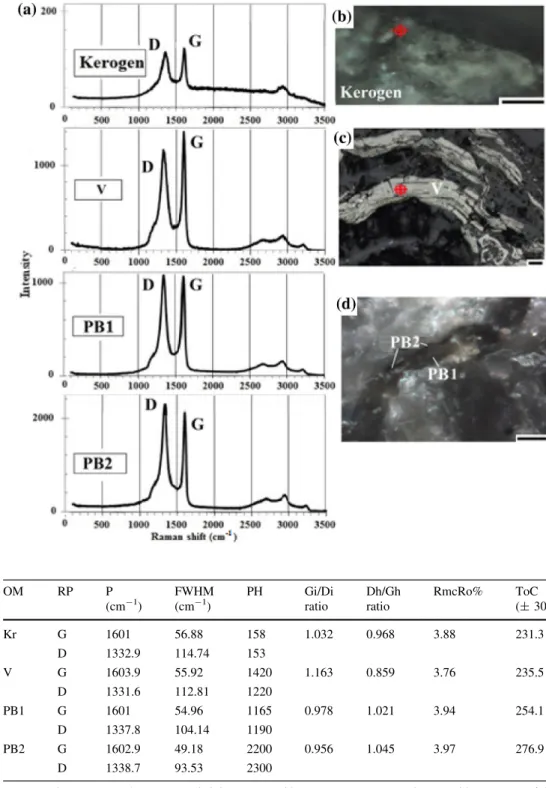
The results of micro-Raman spectroscopy for two types of solid pyrobitumen, the vitrinite, inertinite macerals, and, additionally, the kerogen was focused on the first-order region, which associates with two bands (D and G) between 1350 and 1600 cm-1, and on the second region being associated with up to three bands (S) between 2600 and 3500 cm-1, following the studies of Jehlicka et al.
(2003) and Kouketsu et al. (2014). The Raman results indicate pyrobitumen with bituminous structure in the samples, which can be correlated with the structural evo- lution of bitumen from Zbecˇno (Czech Republic) and Karelia (Russia) in the study of Jehlicka et al. (2003). The Raman measurements concentrate on three parameters; the position of peaks, intensity, and full width at half maxi- mum (FWHM), which is based on Kouketsu’s (2014) equation, see Eq. 1 below:
TðCÞ ¼ 2:15 FWHMð D1Þ þ478 ð1Þ where T = estimated temperature; FWHM = full width at half maximum; D1 = a peak of Raman spectra.
The equation is used to estimate the thermal maturity of carbonaceous matter because it is applicable and accurate in the range of 200–400C (Kouketsu et al. 2014). The quantitative Raman measurement shows that multiple spot analyses of different areas in the samples of three types of carbonaceous matter and kerogen provided similar spectra (‘‘n’’ means the numbers of spectra), showing relatively intensive bands of D (1331–1338 cm-1) and G (1600–1604 cm-1), while D3 (1500 cm-1) and D4 (1180 cm-1) are quite weak bands in the first-order region, and S bands (between 2600 and 3300 cm-1) have a
relatively low intensity in the second-order region. The three types of carbonaceous matters and kerogen are described separately below (shown in Fig.9and Table3):
Kerogen is characterized by a low intensity wide (up to
118.6 cm-1 FWHM) D1 band at around
1332.9±8.7 cm-1(n = 5), and a relatively high intensity narrow (up to 68.46 cm-1 FWHM) D2 band at 1601.0±11.57 cm-1(n = 5). In the second-order region, the major peaks occur at wavenumbers of 2867.06 cm-1 (S1), 2914.31 cm-1(S2) and 3065.69 cm-1(S3) (Fig.9a, d).
Reworked vitrinite (V) is characterized by a low inten- sity wide (up to 117.64 cm-1FWHM) D1 band at around 1331.6±9.6 cm-1(n = 10) and a relatively high intensity narrow (up to 58.82 cm-1 FWHM) D2 band at 1603.9±6.75 cm-1(n = 10). In the second-order region, the major peaks occur at wavenumbers of 2655.9 cm-1 (S1), 2913.35 cm-1(S2), and 3219.87 cm-1(S3) (Fig.9a, b).
The first pyrobitumen (PB1) has a high intensity wide D1 peak (up to 109.92 cm-1FWHM) at wavenumber of 1337.8±22.2 cm-1 (n = 5) and a low intensity, narrow D2 peak (up to 58.81 cm-1 FWHM) at wavenumber of 1601.0±7.7 cm-1 (n = 5) in the first region and the S peaks at wavenumbers of 2607.46 cm-1 (S1), 2922.98 cm-1 (S2) and 3191.1 cm-1 (S3) (n = 5) in the second region (Fig.9a, c).
The second pyrobitumen (PB2) exhibits a high intensity, relatively wide (up to 93.53 cm-1) D1 peak at around 1338.7±12.54 cm-1(n = 5), while a low intensity, nar- row (up to 49.18 cm-1) D2 peak at around 1602.9±5.8 cm-1(n = 5) occurs in the first region. In the second region, the pyrobitumen has a weak S1-peak at Fig. 8 EMPA-EDS X-Ray map for vitrinite: BSE image (a) and EDS measurements;bsulfur mapping image in thin-walled fly ash, an inertinite particle (c) (unit wt.%)
around 2655.9 cm-1 (S1) and two weak overtones at 2992.41 cm-1 (S2) and 3203.58 cm-1 (S3) are present (Fig.9a, c).
The reflectance of pyrobitumen was determined by laser Raman characteristic peaks (peak height) using Liu’s
(2013) equation, which is equivalent to vitrinite reflectance that can reflect different maturation grades and the surface optical properties of samples (Liu et al. 2013), see Eq. 2 below:
RmcR0%¼1:1659 h ðDh=GhÞ þ2:7588 ð2Þ Fig. 9 Raman microscopy
measurement of reworked vitrinite (V), two types of pyrobitumen (PB) and kerogen with Raman spectra (a) of D and G peaks, and optical
photomicrographs under cross- polarized light (bkerogen, cvitrinite, anddPB 1 and PB 2). Scale: 10lm
Table 3 Relevant parameters of the Raman spectra of selected samples for estimated
temperatures and estimated organic maturity
OM RP P FWHM PH Gi/Di Dh/Gh RmcRo% ToC
(cm-1) (cm-1) ratio ratio (±30)
Kr G 1601 56.88 158 1.032 0.968 3.88 231.3
D 1332.9 114.74 153
V G 1603.9 55.92 1420 1.163 0.859 3.76 235.5
D 1331.6 112.81 1220
PB1 G 1601 54.96 1165 0.978 1.021 3.94 254.1
D 1337.8 104.14 1190
PB2 G 1602.9 49.18 2200 0.956 1.045 3.97 276.9
D 1338.7 93.53 2300
OMorganic matter,Krkerogen,Vvitrinite,PBpyrobitumen,RPRaman peak,PPosition,FWHMfull width at half maximum,PHPeak height,Gi/Diintensity ratio,Dh/Ghpeak height ratio,RmcRo%Raman reflectance calculated using Raman parameters expressed in equivalent to vitrinite reflectance, TTemperature
where RmcR0% refers to the Raman reflectance using Raman parameters; h(Dh/Gh) refers to the Raman peak height ratio (Dh refers to the peak height D, Gh refers to the peak height G).
The equation is more applicable for pyrobitumen (highly matured hydrocarbon with mineral inclusion) in an ore deposit (Liu et al. 2013; Yuguang 2017), which corre- sponds to our case.
In the samples, the equivalent reflectivity of three types of pyrobitumen and kerogen was calculated the maturity parameters of which are indicated in Table3.
4.7 Total organic content
The total organic carbon (TOC %) of the samples was measured in carbonate-free samples using an organic ele- mental analyzer after treatment with10% chloric acid at room temperature and 60C for 20–30 min in water bath.
The TOC found in various samples ranges from 0.31 to 0.47 wt.% (0.36 wt.%) in three groups of samples. The lowest TOC content was found in the sample Bak 2.25, which is 0.31 wt.%, and no TOC was found in the Bol and Bak 2.4 samples from the third group which is related to the antimony sulfide ore zone (near-surface post-ore min- eralization). Average TOC value ranges from 0.33 to 0.38
wt.% in three samples (Bak 2.2, Bak 2.3, and Bak 2.1) of the second group related to the arsenic sulfide ore zone (the main ore mineralization), while the first group of the three samples (Bak 2, Bak 1 and Bak 2.5), belonging to the zone rich in the carbonaceous matter (pre-ore mineralization) shows the highest TOC content from 0.32 wt.% to 0.47 wt.% (see below in Table4).
4.8 Elemental composition, functional groups, and soluble organic matter analysis
The organic elemental analyzer was used for the determi- nation of the C, H, N, and S content of the organic matter.
Hydrogen contents range from 0.09 to 0.43 wt.% (average 0.26 wt.%), while the nitrogen content varies from 0.15 to 0.26 wt.% (average 0.21 wt.%) in the samples. Total sulfur content varies from 1.12 to 2.1 wt.%, the average value is 1.61 wt.%.
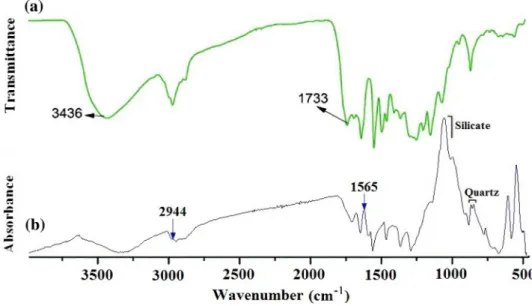
The composition of organic matter was determined using FTIR spectra (Fig. 10): a broad peak at 3375 cm-1 has stretching vibrations of hydroxyl (O–H) groups (very small amount), and methylene groups appear like antisymmetric stretching the peak at 2932 cm-1 and stretching the peak at 2854 cm-1, respectively. The peaks at 1632 cm-1, 1525 cm-1, 1497 cm-1, and 1282 cm-1
Table 4 Total organic carbon
(TOC %) of nine samples Samples
Bak 2 Bak 1 Bak 2,5 Bak 2,2 Bak 2,3 Bak 2,1 Bol Bak 2,4 Bak 2,25
0.34 0.33 0.38 0.47 0.43 0.32 – – 0.31
Fig. 10 FTIR analysis and comparison of organic fractions with the assignment of major peaks:aMolecular structure of lignin with silica
nanocomposites (modified from Weizhen et al.2017);borganic matter with rock matrices from the rock samples
correspond to characteristic vibrations from aromatic rings, which are characterized by polycyclic aromatic hydrocar- bon. The stretching vibration of C-O for carbonyl groups is absent in the samples. The characteristic vibrations of the aromatic rings of the phenolic hydroxyl group at 1632, 1523, 1499, and 1282 cm-1, and the similar characteristic peaks of vibrations reflect the studied organic matter shows stretching vibrations similar to the phenolic hydroxyl group at 2854 and 2931 cm-1 and is practically similar to the broad peak of the phenolic hydroxyl group at 1436 cm-1. However, the carbonyl area of the phenolic hydroxyl group peak at 1733 cm-1where it is absent in the composition of the studied organic matter. The carbonyl group could be missed in the studied organic matter during a decarboxy- lation process. Other functional groups of the organic matter composition and structure correspond to the phe- nolic hydroxyl group characteristic of the lignin material.
The extractable fraction and the volume of the soluble organic matter were very small and, not fractioned further.
4.9 Experimental results
The optical and electron microscope techniques did not confirm the presence of free gold grains in the three types of pyrobitumen and even in the arsenic sulfide minerals.
Despite that, the experimental extraction of gold was suc- cessful for the previously separated organic fraction and for the handpicked arsenic sulfide minerals analysis too.
Moreover, besides gold, the organic fraction contains other precious metals too. This confirms that gold and other precious metals are very finely dispersed within the organic matrix.
Gold content accompanied with other metals (Ag, Pt, and Pd) extracted by the sequential extraction from two different phases, soluble organic fractions of solid pyrobi- tumen and arsenic sulfide minerals from nine samples were measured by ICP-OES; see Table 5.
In the first stage, the solvent of hydroxyl ammonium chloride started to extract the higher amount of As (180 ppm), Fe (3757 ppm), and S (132 ppm), most likely the dissolution of arsenian pyrite was removed with a precious metal content of gold (between 0.05 and 0.2 ppm), Ag (up to 1.4 ppm) and Pt (up to 130 ppb).
In the second stage, the amounts of dissolved precious metals in the nine samples exceeded the first stage. This solvent was strong enough to oxidize organic materials removing major amounts of precious metals: gold (7.23 ppm), Ag (3.8 ppm) and Pt (29.8 ppb), and Pd (10.4 ppb). Additionally, the presence of other elements in the extracts was found, such as As (over 4.5 ppm), Fe (over 9.4 ppm), S (over 175 ppm), and P (up to 88 ppm) at this stage.
In the last third stage, the most powerful aqua regia solvent completely dissolved all remaining precious metals from arsenopyrite and some remains of pyrite, and even no- recoverable metals from the first stage. This stage shows the highest values for As (4000 ppm), Fe (14,285 ppm), S (10,246 ppm), and the highest grade of Au (10 ppm), Ag (33 ppm), Pt (264), and Pd (16) were dissolved by the aqua regia solvent, most likely, from the arsenopyrite minerals (see below in Table5).
The XRPD shows that each chemical element dissolved has corresponding phases in the three stages, with Table 5 Concentrations of
extracted noble metals at the 3 stages (unit, ppm for Au and Ag; ppb for Pt and Pd)
Noble metals Samples group I Samples group II Samples group III
Bak Bak Bak Bak Bak Bak Bol Bak Bak 2,25
2 1 2.5 2.3 2.2 2.1 2.4
Stage 1 (pyrite)
Au 0.1 0.13 0.09 0.08 0.05 0.13 0.01 0.1 0.05
Ag – – 1.4 0.4 1.1 2 – 0.4 1.4
Pt – – – – – 130 – – 100
Pd – – – – – – – – –
Stage 2 (solid pyrobitumen)
Au 2 3 0.21 0.19 0.22 0.76 0.2 0.44 0.21
Ag 1.7 1.7 – 0.12 0.01 0.32 – – –
Pt – – 5 – 25 – – – 1
Pd – – 10 – – – – – 16
Stage 3 (arsenopyrite)
Au 0.5 4 0.11 0.81 1.26 2.1 0.4 0.43 0.48
Ag 0.6 27 1,67 0.27 0.62 0.42 – 0.24 1.85
Pt – – – 105 139 – – 19 –
Pd – – – – – – – – –
decreasing or completely lost phases of amorphous and mineral matters during the process of acid digestion.
The three groups of the nine samples have gold, Ag, Pt, and Pd contents with different values in organic matter and arsenic sulfide ore minerals. The total gold content is higher in sulfide minerals (11 ppm) than in pyrobitumen (7 ppm) (described below in detail). The total Pt value includes (490 ppb) appearing more in sulfide minerals than in pyrobitumen (31 ppb) while the Pd value found in pyrobitumen alone totals up to 26 ppb.
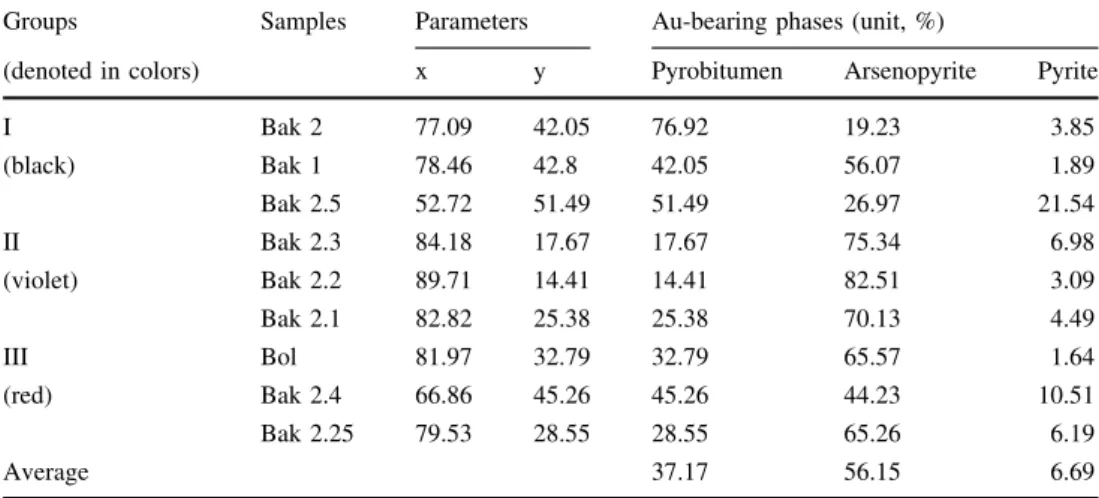
According to the ratio of gold to pyrobitumen and arsenic sulfide ore minerals in a triangular diagram (see
below in Table6and Fig.11), it can be seen that the gold content decreases from arsenopyrite (6 times more) and pyrobitumen (3times more) to pyrite in the nine samples from three groups. Samples show that the arsenopyrite mineral is more enriched in gold (on average, 56.15%), especially in the samples from the second group, which corresponds to the main ore mineralization. Solid pyrobi- tumen comprises gold on average 33.38% of gold from three groups of samples, mainly from samples of the sec- ond group. The lowest content of gold (on average 6.27%) is observed in pyrite, gold of pyrite includes mostly in the second group of samples.
Table 6 Triangular diagram for gold to pyrobitumen and arsenic sulfide ores ratios
Groups Samples Parameters Au-bearing phases (unit, %)
(denoted in colors) x y Pyrobitumen Arsenopyrite Pyrite
I Bak 2 77.09 42.05 76.92 19.23 3.85
(black) Bak 1 78.46 42.8 42.05 56.07 1.89
Bak 2.5 52.72 51.49 51.49 26.97 21.54
II Bak 2.3 84.18 17.67 17.67 75.34 6.98
(violet) Bak 2.2 89.71 14.41 14.41 82.51 3.09
Bak 2.1 82.82 25.38 25.38 70.13 4.49
III Bol 81.97 32.79 32.79 65.57 1.64
(red) Bak 2.4 66.86 45.26 45.26 44.23 10.51
Bak 2.25 79.53 28.55 28.55 65.26 6.19
Average 37.17 56.15 6.69
Fig. 11 Triangular diagram of the gold in pyrobitumens, vitrinite, Arsenopyrite, and pyrite ratio in three sample groups of total nine samples (Denoted by color: black for group I; violet for group II, and red for group III)
The results of the ratio of gold to the organic phase and ore sulfide phase indicate as a whole that the second group of samples from the main ore mineralization zone is more relevant and promising.
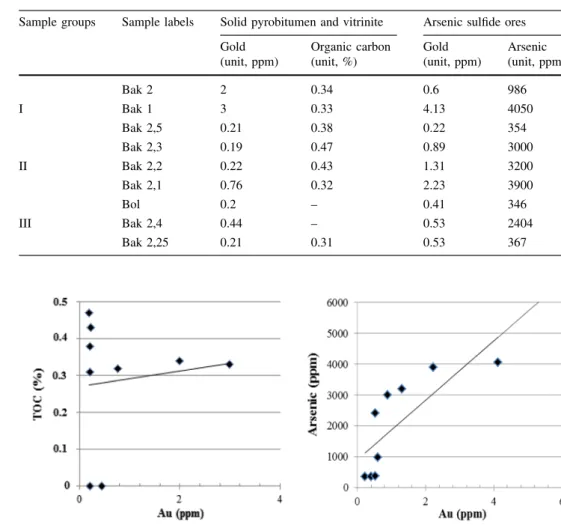
Correlation between gold and the total organic carbon (TOC) is found no correlation in nine samples, while gold with arsenic element is positively correlated in three sample groups (see below in Table 7 and Fig. 12). The reason for the lack of correlation between gold and TOC is more likely the weak thermal stability of some part of organic fractions in the hot hydrothermal system during polymerization. Other authors Rafailovich et al. (2011) confirm the positive correlation of gold with the arsenic element.
5 Discussion
5.1 Source of organic matter (OM) and gold 5.1.1 Source of OM
The bulk ratios of carbon isotope in organic matter (d13C = -14 731%) in the Bakyrchik deposit indicate its
biogenetic nature and organic source (Zairi et al. 1987).
Geochemical results, such as the presence of polycyclic (hetero) aromatic hydrocarbon and humic acid, indicate a terrestrial carbon source of lignin (TOC, 0.3–0.5%) in the lacustrine environment, which has allochthonous nature due to gravity flows (Azerbaev and Zhautikov2013).
The composition and source of kerogen in the sample (hardly distinguishable from pyrobitumen) partially con- firms the terrestrial organic source, mainly from vascular plants, yielding an aromatic hydrocarbon (most likely the original coal source). The temperature of transformation of heating kerogen into liquid petroleum may occur at 231.3±30C, which corresponds to its thermal maturity of 3.88% (RmcRo%).
5.1.2 Source of gold
Gold is of a mantle source and occurs in ultramafic rocks from the mantle to the oceanic basement (Rafaylovich 2009), which occurred 300 Ma ago, spanning five geo- logical ages: 574, 380, 300, 250, and 210 Ma due to the isotopic analysis of Pb (Pb/U[50) in gold-bearing sulfide minerals (Lubecky et al. 2008; Umarbekova and Dyusembaeva2019). The first gold occurrence (574 Ma) is Table 7 Ratio of gold to
organic carbon and arsenic element (from both arsenopyrite and pyrite) in nine samples
Sample groups Sample labels Solid pyrobitumen and vitrinite Arsenic sulfide ores
Gold Organic carbon Gold Arsenic
(unit, ppm) (unit, %) (unit, ppm) (unit, ppm)
Bak 2 2 0.34 0.6 986
I Bak 1 3 0.33 4.13 4050
Bak 2,5 0.21 0.38 0.22 354
Bak 2,3 0.19 0.47 0.89 3000
II Bak 2,2 0.22 0.43 1.31 3200
Bak 2,1 0.76 0.32 2.23 3900
Bol 0.2 – 0.41 346
III Bak 2,4 0.44 – 0.53 2404
Bak 2,25 0.21 0.31 0.53 367
Fig. 12 Correlation of gold to the total organic carbon (TOC
%) and arsenic element
related to the riftogenic stage of the Late Cambrian and Early Ordovician (€3-O1), the second mineralization (380 Ma) is associated with the oceanic stage of the Early Devonian and Middle Devonian (D1-2) with regression of the palaeo-ocean and formation of the volcanic island-arc stage in Late Devonian and Early Carboniferous (D3fm- C1v) above the subduction zone associated with basalt- andesitic complexes. The age of 300 Ma is related to an early collision with the intrusion of the Kunush gold- bearing intrusive complex at the Late Carboniferous and Late Permian age (C3-P1); it is a great granitic batholith and the source of the main gold generation. The final stage of gold occurrence ended between 250 and 210 Ma, the Middle Triassic and Late Triassic age (T2-3), characterized by regeneration of gold (Lubecky et al.2008).
5.2 Mobilization and preservation of OM and gold 5.2.1 Maturation, migration, and entrapment of OM
Vitrinite at the anthracite stage shows that migration went on at 235.5±30C confirmed with thermal maturity of 3.76% (RmcRo). This bituminous matter and, partially, vitrinite is most likely migrated by a hydrothermal system as angular-shaped forms from the high-temperature zone to the low-temperature zone through large voids in the host rock. The large void filling of reworked vitrinite displays medium to coarse-grain mosaic textures of particle assemblages in samples of Bak 1, Bak 2.1, and Bak 2.5.
The reworked vitrinite coexisted within framboidal and needle-shaped digenetic pyrite. The coexistence of fram- boidal sphalerite in the reworked vitrinite grains is also attributed to a diagenetic, epigenetic origin. The framboidal and needle-shaped textures of sulfide crystals have been observed growing from metal-enriched H2S-bearing hydrothermal fluids, according to the concept of Scott et al.
(2009) in a gold sulfide deposit. The needle-shaped pyrite and framboidal pyrite and sphalerite of reworked vitrinite include minor elements As, Sb, Zn Cu, and Ni (from pyr- ite), and P (from sphalerite), while the reworked vitrinite enriched in S, Cl and P.
Reworked vitrinite and other vitrinite particles contain 90 wt.% carbon, and 2 wt.% organic sulfur and other ele- ments (P and Cl) preserved as sulfur-rich reworked vitri- nite. Dai et al. (2015) indicated that organic sulfur is generated from hydrothermal solutions during the coalifi- cation stage, ranging from about 0.1% to 4–12% levels (Dai et al. 2020). Organic sulfur is more abundant in bituminous coal and anthracite than in low-rank coals as thiophenic sulfur compounds (Chou2012). The content of thiophenic sulfur increases with maturation (Ho et al.1974) in bitumen with a high content of aromatic hydrocarbons, resins, and asphaltenes (Tissot and Welte 1984),
thermostable up to 250C in hydrothermal fluids (Gior- dano2000). Hwang (1998) indicated that the formation of sulfur-rich pyrobitumen is a result of subsequent thermal change in asphaltic-rich bitumen in the presence of sulfur species. Moreover, Powell (1984) confirmed that the interaction of bitumen with the thermochemical reduction of sulfate should be responsible for the formation of some sulfur-rich bitumens.
Chlorine is present in organic matter, as Caswell et al.
(1984a,b) described that chlorine is more likely taken from Cl-rich groundwater during diagenesis. Chou et al. (1992) found that, under reducing conditions, chlorine, in the form of HCl, is released at temperatures between 250 and 600 C, with a maximum release at 445C. Finkelman (1981) and Black (1981) believed that phosphorus in most organic matters is likely to be present in phosphates, where phosphorus is organic rather than a mineral fraction.
Pyrobitumen of the first type (PB2) migrates at a tem- perature of 254C, and its thermal maturity is 3.94%
(RmcRo). It migrates through very narrow fractures and voids within hydrothermal quartz in the host rock and is retained as tiny narrow-filling forms within the hydrothermal quartz, showing a quite weak fluorescence intensity. The occurrence of a thin membrane adhered to the wall rocks may explain that the bitumen precipitated as an immiscible phase with the hydrothermal fluid and slowly flowed along the wall of veins due to its consistent transformation into this type of pyrobitumen.
The second type of pyrobitumen (PB3) migrated at a relatively higher temperature of 276.9±30C, with thermal maturity of 3.97% (RmcRo), and it migrated withinthe hydrothermal fluid to the low-temperature zone through narrow fissures; it is entrapped in the relatively narrow voids of the hydrothermal quartz.
The two sizes of veins of pyrobitumens on quartz may explain that they were displaced and trapped within a dif- ferent chemical composition during the distillation process, as cooling the hydrothermal fluid can cause differentiation in the chemical composition of the bitumen. The final freezing point of the mixture and the molecule size, which can migrate through the neck diameter, controls this process.
Solid pyrobitumen and vitrinite are polymerizing to increase aromatic compounds and losing aliphatic hydro- carbon during the migration within the hot hydrothermal fluid. This aromatic hydrocarbon-enriched bitumen is trapped with decreasing the fluid temperature in quartz in the lower temperature zone, as a filler in voids of the quartz matrix. Thus, the heavy component of the bitumen is trapped within hydrothermal quartz, pyrolyzed and con- verted to pyrobitumen as a result of thermally altered pri- mary bitumen, which was driven off the soluble hydrocarbon products and volatile organic components of
N, H, CH4CO2(Zairi et al.1987), retained in the insoluble carbon-rich residues. The carbon isotope of the solid pyrobitumen and vitrinite (d13C = -22726,8%) confirms that it has a terrigenous origin (Zairi et al.1987).
5.2.2 Transport and precipitation of gold
Rafailovich (2009) has considered transportation and pre- cipitation of gold in the deposit by three processes (1) In the sedimentary-diagenetic process, gold was transported by a bisulfide gold and depositing in the shallow zone and underwater deltas, rich in organic matter and hydrogen sulfide, framboidal pyrite precipitated on rhythmically layered gold-bearing carbonaceous sediments. (2) In the tectonic-metasomatic process, gold was transported in a mineralized solution as a chloric complex of gold and precipitated in carbonaceous-terrigenous sediments, while framboidal pyrite recrystallized into gold-bearing pyrite of cubic and pentagon-dodecahedral forms with inclusions of arsenic. (3) In the intrusive-thermal-metasomatic process, syngenetic gold was remobilized along the Qyzyl shear zone in the areas of intrusions and dikes of the Kunush granitic complex, and then gold reached the final precipi- tations with pyrobitumen.
5.3 Role of solid pyrobitumen in the Bakyrchik gold deposit
5.3.1 OM and gold mineralization
The gold mineralization of the deposit occurs in the Qyzyl shear zone (Lubecky et al.2008). Zhu et al. (2011) con- sidered that the gold mineralization in most shear zones is a result of post-peak metamorphism and associates a multi- stage alteration event.
Current and previous analytical and experimental data may explain the role of pyrobitumen in the Bakyrchik gold deposit by separating the three geological processes of gold mineralization, which, most likely, correspond to regional maturations of the three pyrobitumen types:
1. Syngenetic gold accumulates in the sedimentary-dia- genetic process with an increasing precursor asphaltic- rich hydrocarbon at low temperature in a slightly alkaline environment with the penetration of hydrogen sulfide-rich hydrothermal fluids into clay or silty lacustrine sediments of the Middle-Late Carboniferous formation. The bisulfide gold is transported a hydrothermal fluid and the fluid mobilizes asphaltic- rich bituminous materials through large voids of mineral grains of the host rock in the high-temperature zone. Simoneit (2018) mentioned that a hydrothermal ore fluid can rapidly generate bituminous material
from immature organic matter to fully matured prod- ucts in host rocks. Ore fluid destroys only partly the organic matter with an increase of aromatic hydrocar- bon content (polycyclic compound) and loss of aliphatic carbon content because the thermogenic products are rapidly removed from the hot zone through voids (Simoneit 1994). The low-temperature hydrothermal water may contribute to the thermo- chemical origin of framboidal pyrites in asphaltic-rich carbonaceous materials, where the palaeotemperature was up to 235±30C shown by the thermal matu- ration of reworked vitrinite (V).
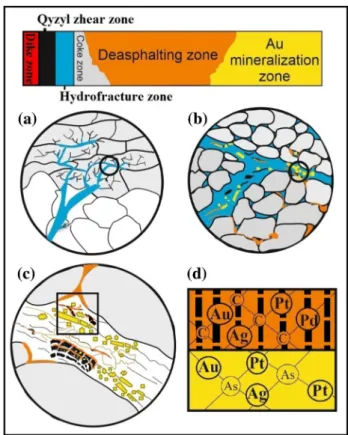
Fig. 13 Schematic model of the formation of gold compounds of organic matter and arsenic sulfide ore minerals in six active zones of the Bakyrchik gold deposit showing a penetration of the hot hydrothermal ore fluid (blue) into liquid bituminous materials (in coke zone, grey) through fissures and fractures in the host rock (white); b migration of gold, bitumen (orange) and sulfide ore components (yellow) into the hydrothermal fluid; centrapment of gold, bitumen, and ore elements undergoing thermal and chemical influences for gold precipitation (in OM and ore minerals), and bitumen maturation (origin of (V) reworked vitrinite (black) and its thermochemical reduction for framboidal pyrite, and two veined pyrobitumens (PB1, PB2) with increasing thermal maturation and arsenic sulfide minerals occurrence (arsenian pyrite and arsenopyrite);
dgold inclusions in polycyclic aromatic hydrocarbons of pyrobitu- mens (orange) and vitrinite (black) as metal–organic compounds (noble metals) and ‘‘invisible gold’’ in the arsenic structure lattice of arsenian pyrite and arsenopyrite (yellow). Detail view at the micron size (a–c) and nano-size (d). (complied by CorelDRAW Graphics Suite X6)