CORVINUS UNIVERSITY OF BUDAPEST
D
EPARTMENT OFM
ATHEMATICALE
CONOMICS ANDE
CONOMICA
NALYSIS Fövám tér 8., 1093 Budapest, Hungary Phone: (+36-1) 482-5541, 482-5155 Fax: (+36-1) 482-5029 Email of corresponding author: zsolt.darvas@uni-corvinus.huWebsite: http://web.uni-corvinus.hu/matkg
W ORKING P APER
2011 / 6
A T ALE OF T HREE C OUNTRIES : R ECOVERY AFTER B ANKING C RISES
Zsolt Darvas
20 December 2011
A tale of three countries: Recovery after banking crises
Zsolt Darvas 20 December 2011
Highlights:
• Iceland, Ireland and Latvia experienced similar developments before the crisis, such as sharp increases in banks’ balance sheets and the expansion of the construction sector. However the impact of the crisis was different: Latvia was hit harder than any other country in the world.
Ireland also suffered heavily, while Iceland came out from the crisis with the smallest fall in employment, despite the greatest shock to the financial system.
• There were marked differences in policy mix: currency collapse in Iceland but not in Latvia, letting banks fail in Iceland but not in Ireland, and the introduction of strict capital controls only in Iceland. The speed of fiscal consolidation was fastest in Latvia and slowest in Ireland.
• Economic recovery has started in all three countries and there are several encouraging
signals. The programme targets in terms of fiscal adjustment, structural reforms and financial reform are on track in all three countries.
• Iceland seems to have the right policy mix.
• Internal devaluation in Ireland and Latvia through wage cuts did not work, because private- sector wages hardly changed. The productivity increase was significant in Ireland and moderate in Latvia, yet was the result of a greater fall in employment than the fall in output, with harmful social consequences.
• The experience with the collapse of the gigantic Icelandic banking system suggests that letting banks fail when they had a faulty business model is the right choice.
• There is a strong case for a European banking federation.
JEL codes: F31, F32, J30, O40
Keywords: banking crisis; banking sector restructuring; economic recovery; currency devaluation;
internal devaluation; capital controls; fiscal adjustment
The author is grateful to Alan Ahearne, Karlis Bauze, John Fitzgerald, Randy Henning, Radoslav Krastev, Philip Lane, Jean Pisani-Ferry, István Székely, Karsten Staehr, Guntram Wolff, Juan Zalduendo and Gylfi Zoega for helpful comments and suggestions. However, the views expressed in this policy contribution are not necessarily those of the persons mentioned. Dana Andreicut, Lucia Granelli and Ali Sarzaeem provided excellent research assistance. This policy contribution was written as a background paper for the World Bank ECA report ‘Golden Growth: Restoring the Lustre of the European Economic Model’, edited by Indermit Gill and Martin Raiser.
1. Introduction
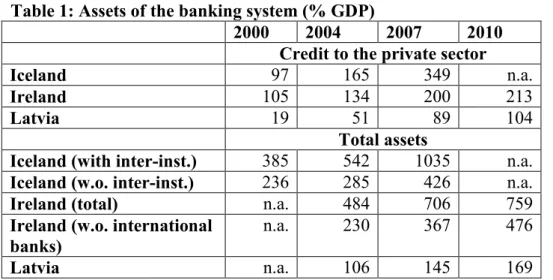
Three small, open European economies —Iceland, Ireland and Latvia with populations of 0.3, 4.4 and 2.3 million respectively—got into serious trouble during the global financial crisis. Behind their problems were rapid credit growth and expansion of other banking activities in the years leading up to the crisis (Table 1), largely financed by international borrowing. This led to sharp increases in gross (Iceland and Ireland) and net (Iceland and Latvia) foreign liabilities (Tables 2 and 3)1. Credit booms fuelled property-price booms and a rapid increase in the contribution of the construction sector to output – above 10 percent in all three countries. While savings-investment imbalances in the years of high growth were largely of private origin, public spending kept up with the revenue over-performance that was the consequence of buoyant economic activity. During the crisis, property prices collapsed, construction activity contracted and public revenues fell, especially those related to the previously booming sectors. All three countries had to turn to the International Monetary Fund and their European partners for help.
There were also common elements to crisis management in the three countries. Fiscal austerity programmes, structural reforms, the fostering of private debt restructuring and strengthening of the banking system were central to their economic adjustment programmes.
However, partly due to differences in institutional set up, there were marked differences in policy responses, in terms of, for example, exchange rate policy, the adoption of capital controls and the handling of the banking crisis. There were also marked differences in economic outcomes.
The purpose of this Policy Contribution is to compare the policy responses in, and the adjustments made by, the three countries. Based on this comparison, we draw lessons for exchange rate policy, internal devaluation, capital controls, banking sector restructuring and fiscal consolidation. By selecting similar countries that responded differently, this paper conducts a kind of controlled experiment, even though we cannot always isolate the impacts of individual elements of the policy mix.
The next section discusses the key differences in policy responses, followed by an assessment of economic outcomes. The final section concludes and compares the results with other perspectives expressed in the literature.
1 Note that the sharp deterioration of Icelandic net international investment position after the crisis (Table 2) is largely related to defaulted banks. Benediktsdottir, Danielsson and Gylfi Zoega (2011) conclude that without banks, the international investment position of Iceland has improved. Table 3 shows that three-quarters of gross external debt is the liability of defaulted banks. According to Lane (2011b), the significant deterioration of Irish net external liabilities during the past three years is most likely related to the internationally-leveraged structure of the financial portfolios of domestic Irish residents.
Table 1: Assets of the banking system (% GDP)
2000 2004 2007 2010 Credit to the private sector
Iceland 97 165 349 n.a.
Ireland 105 134 200 213
Latvia 19 51 89 104
Total assets
Iceland (with inter-inst.) 385 542 1035 n.a.
Iceland (w.o. inter-inst.) 236 285 426 n.a.
Ireland (total) n.a. 484 706 759
Ireland (w.o. international banks)
n.a. 230 367 476
Latvia n.a. 106 145 169
Source: Credit to the private sector is from the IMF IFS; total assets are from Central Bank of Iceland, Central Bank of Ireland and Central Bank of Latvia.
Note: Ireland’s figures for total assets include the Irish operations of international banks. The Central Bank of Iceland reports assets both with and without inter-institutional transactions. Total liabilities reported are equal total assets without inter-institutional transactions. The increase in the credit/GDP ratio from 2007 to 2010 in Ireland and Latvia is primarily due to the fall in GDP.
Table 2: International investment position (% GDP)
2000 2004 2007 2010
Iceland foreign assets 45 125 514 266
foreign liabilities 112 192 625 895
net foreign assets -67 -66 -112 -629
Ireland foreign assets 643 857 1,195 1,691 foreign liabilities 650 875 1,215 1,782
net foreign assets -8 -18 -19 -91
Latvia foreign assets 50 65 81 117
foreign liabilities 80 118 155 197
net foreign assets -30 -52 -75 -80
Source: central banks of the three countries (foreign assets and liabilities) and Eurostat (GDP at current prices).
Note: see Table 3 below and Benediktsdottir, Danielsson and Gylfi Zoega (2011) for the interpretation of Icelandic net foreign assets position change during the past three years, and Lane (2011b) for an assessment of the Irish case.
Table 3: Gross external debt of Iceland (% GDP)
2000Q4 2004Q4 2007Q4 2008Q3 2008Q4 2011Q2
Monetary authorities 2 0 0 6 20 18
General government 24 23 19 42 36 33
Deposit money banks (DMBs) 51 131 455 685 46 11
Other sectors 27 19 46 61 806 751
DMBs undergoing winding-up
proceedings ... ... ... ... 739 696
Others 27 19 46 61 67 55
Direct investment 1 6 48 72 90 93
Total external debt 107 179 568 866 998 906
Source: Central Bank of Iceland (external debt) and Eurostat (GDP at current prices).
2. Differences in institutional set up and policy response
2.1 Exchange rate regime and developments
There was a broad consensus at the outbreak of the crisis that real exchange rates in all three
countries should be depreciated to help economic recovery – which has indeed happened during the past three years, but through different means and to different degrees.
The differences are partly related to exchange rate regimes and partly to policy choices. Ireland has been a member of the euro area since 1999, and therefore adjustment through the nominal exchange rate against the euro was not an option. Latvia has had a fixed exchange rate with the euro since 2004, and Latvian policymakers chose not to exercise the option to devalue2. Both Ireland and Latvia decided to embark on a so called ‘internal devaluation’, ie efforts to cut wages and prices. Iceland has a floating exchange rate. When markets started to panic and withdrew external lending, given the size of the country’s obligations (Table 2), there was no choice but to let the currency depreciate.
The Icelandic krona depreciated by about 50 percent in nominal terms – depreciation would have been sharper without capital controls (see section 2.3 below).
Nevertheless the unit labour-cost (ULC) based real effective exchange rate (REER) has depreciated in all three countries. The ULC-REER can be decomposed as:
ty productivi ulc
wage neer hours
empl production ulc
wage neer ulc
production wage hours neer empl
ulc ulc ulc neer
reer foreign
foreign foreign
foreign
⋅
= ⋅
⋅ ⋅
= ⋅
⋅ ⋅
⋅
⋅ =
= ( )
) ( )
( )
) (
( ,
where reer(ulc) is the labour-cost based real effective exchange rate, neer is the nominal effective exchange rate (an increase indicates appreciation), ulc is the domestic unit labour cost, ulc(foreign) is the foreign unit labour cost, empl is the number of people employed, hours is the average hours worked per employee, wage is the nominal hourly wage (or more precisely: hourly labour cost, which is also effected by, eg changes in social security contributions paid by the employer),
production is real output (GDP), and productivity is production divided by labour input, which is the product of number of people employed and their average hours worked.
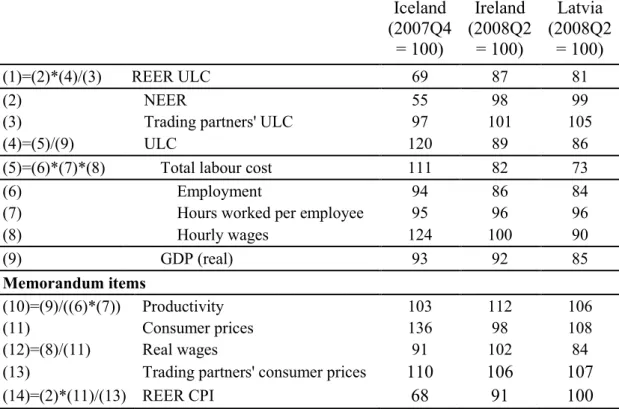
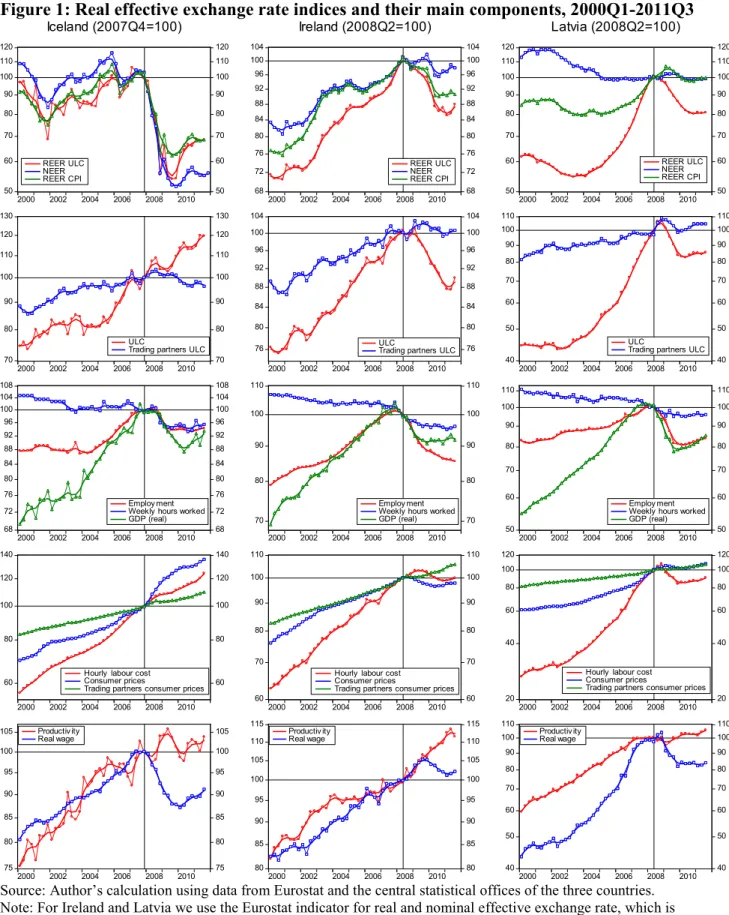
Table 4 presents this decomposition for the changes in the real exchange rate from the real exchange rate peak to 2011Q3. It should be noted that the adjustment may continue in the future and therefore the table reports the developments during the past three years. For example, as Figure 1 indicates, ULC-based REER is still clearly moving downwards in Ireland, is moving somewhat upwards in Iceland, and has flattened out in Latvia.
In Iceland the main driving force of real depreciation was the significant fall in the nominal exchange rate (45 percent in the period shown in Table 4). Productivity and trading partners’ ULC have hardly changed. While the depreciation-induced wage inflation3 (24 percent) eroded some of gain from the
2 Even though Ireland has the euro and the Latvian lats is fixed to the euro, the nominal effective exchange rates of these two countries do change somewhat when the exchange rate of the euro against other currencies changes, because some of the trade of these countries go outside the euro area. But these changes are largely exogenous, because
asymmetric shocks in Ireland and Latvia have limited, if any, impact on the euro’s exchange rates. Note that Latvia had a peg against the SDR (IMF Special Drawing Rights) until 2004 and in this period the nominal effective exchange rate was more variable, as indicated by Figure 1.
3 Most likely in all three countries there was a change in skill composition of employed labour during the crisis:
probably more unskilled jobs were lost than skilled jobs. If this is the case, the average wage tends to increase due to this compositional change.
fall of the nominal exchange rate, the krona is still weaker by 31 percent relative to its pre-crisis level in real effective terms. It is also much weaker than it was in 2001, when Iceland had its previous currency crisis (see the top-left panel of Figure 1).
By contrast, in Ireland and Latvia the nominal effective exchange rate has hardly changed and real depreciation had different drivers.
In Ireland the main reason was productivity improvement (by 12 percent from 2008Q2 to 2011Q3), which is almost equal the real depreciation (13 percent). During the last three years, hourly wages did not change much, though there was a modest 4 percent wage decline from the peak in wages in 2009Q2 to the trough in 2011Q1 (see the second panel in the fourth row of Figure 1)4. The 13 percent real depreciation has restored the real effective exchange rate level of late 2004.
However, it should be also highlighted that the Irish tradable sector was competitive even before the crisis and ULC increases characterised mostly the non-tradable sector (Darvas, Pisani-Ferry and Sapir, 2011; Darvas, Gouardo, Pisani-Ferry and Sapir, 2011). For example, manufacturing ULC was on a continuous downward trend (similarly to Germany) in the decade prior to the crisis and has declined even further during the crisis.
In Latvia, the main driver of adjustment was a fall in nominal hourly wages (10 percent). The real exchange rate adjustment was helped by an increase in foreign ULC (5 percent) and a moderate productivity improvement (6 percent). As a result, the Latvian ULC-based REER is 19 percent lower in 2011Q3 compared to its peak in 2008Q2, but this adjustment has only restored the early 2007 value of this index and is still 30 percent higher than in 2000Q15.
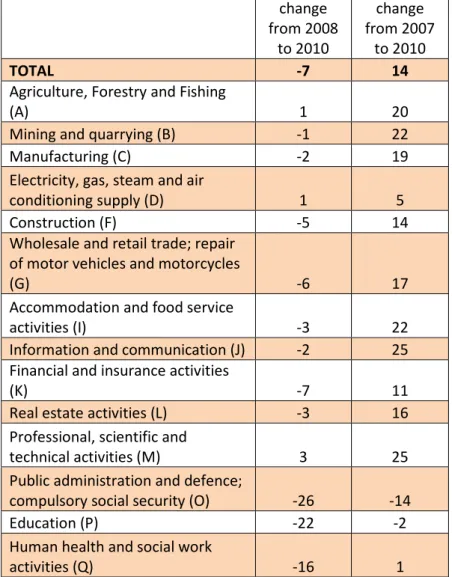
However, the public and private sector distinction is crucial for Latvia. Table 5 shows, using annual data, that from 2008 to 2010 hourly labour costs declined by 7 percent for the whole economy. But this decline primarily came from the public sector: the decline was 26 percent in public
administration, 22 percent in education and 16 percent in health and social work. In contrast, hourly labour costs have declined by only two percent in manufacturing and the decline (if any) in various private sector activities was also minor. Furthermore, the recent minor declines in hourly labour costs in private sector activities have not even compensated for one year of increase before: the change in hourly labour costs from 2007 to 2010 (second data column in Table 5) is in the range of 10-20 percent for most private sector activities. Therefore, while the public sector in Latvia was able to significantly reduce nominal wages, the internal devaluation, ie nominal wage and price falls, hardly worked in the private sector. However, due to a greater fall in labour input than output (Tables 7 and 8), productivity has improved in both industry and manufacturing. According to calculations by the Bank of Latvia, the manufacturing ULC-based REER in 2011Q2 was 2 percent below the level of 2000Q1, yet above the level of 2002.
4 From 2009Q2 to 2011Q2, average hourly labour costs fell by 5.1 percent in the public sector and 3.1 percent in the private sector. Additionally, in public sector a 7.5 percent pension levy was imposed in 2010.
5 It should be noted that we use the REER published by Eurostat, which is calculated against 36 trading partners, not including Russia. Russia’s share in Latvia’s export was 13 percent in 2007 (Russia’s share is much lower for Iceland, 1.4 percent, and Ireland, 0.4 percent). According to calculations by the Bank of Latvia, the REER that includes Russia as well among trading partners depreciated somewhat more than the Eurostat indicator.
Table 4: Decomposition of the change in the unit labour cost based real effective exchange rate index (from peak* to 2011Q3)
Iceland (2007Q4
= 100)
Ireland (2008Q2
= 100)
Latvia (2008Q2
= 100)
(1)=(2)*(4)/(3) REER ULC 69 87 81
(2) NEER 55 98 99
(3) Trading partners' ULC 97 101 105
(4)=(5)/(9) ULC 120 89 86
(5)=(6)*(7)*(8) Total labour cost 111 82 73
(6) Employment 94 86 84
(7) Hours worked per employee 95 96 96
(8) Hourly wages 124 100 90
(9) GDP (real) 93 92 85
Memorandum items
(10)=(9)/((6)*(7)) Productivity 103 112 106
(11) Consumer prices 136 98 108
(12)=(8)/(11) Real wages 91 102 84
(13) Trading partners' consumer prices 110 106 107
(14)=(2)*(11)/(13) REER CPI 68 91 100
Notes. * The peak in Icelandic ULC-based REER was in 2007Q2 (see Figure 1), but it has hardly changed till 2007Q4 and most adjustment occurred after 2007Q4. Therefore, the table tracks the adjustments since then. In order to get rid of very short term noise in the data, the entries shown in the table were calculated in the basis of Hodrick-Prescott filtered series with smoothing parameter 1, a very low parameter. Note that the standard smoothing parameter for quarterly data is 1600. Figure 1 shows both the original and this Hodrick-Prescott filtered series, which suggests that the filter well captures the main tendencies and also the turning points.
Source: Author’s calculation using data detailed in the note to Figure 1.
Figure 1: Real effective exchange rate indices and their main components, 2000Q1-2011Q3
120 110 100 90 80 70 60
50
120 110 100 90 80 70 60
50 2000 2002 2004 2006 2008 2010
REER ULC NEER REER CPI
Iceland (2007Q4=100)
104 100 96 92 88 84 80 76 72 68
104 100 96 92 88 84 80 76 72 68 2000 2002 2004 2006 2008 2010
REER ULC NEER REER CPI
Ireland (2008Q2=100)
120 110 100 90 80 70 60
50
120 110 100 90 80 70 60
50 2000 2002 2004 2006 2008 2010
REER ULC NEER REER CPI
Latvia (2008Q2=100)
130 120 110 100 90 80
70
130 120 110 100 90 80
70 2000 2002 2004 2006 2008 2010
ULC
Trading partners ULC
104 100 96 92 88 84 80 76
104 100 96 92 88 84 80 76 2000 2002 2004 2006 2008 2010
ULC
Trading partners ULC
110 100 90 80 70 60 50
40
110 100 90 80 70 60 50
40 2000 2002 2004 2006 2008 2010
ULC
Trading partners ULC
108 104 100 96 92 88 84 80 76 72 68
108 104 100 96 92 88 84 80 76 72 68 2000 2002 2004 2006 2008 2010
Employ ment Weekly hours worked GDP (real)
110
100
90
80
70
110
100
90
80
70 2000 2002 2004 2006 2008 2010
Employ ment Weekly hours worked GDP (real)
110 100 90 80 70 60
50
110 100 90 80 70 60
50 2000 2002 2004 2006 2008 2010
Employ ment Weekly hours worked GDP (real)
140 120 100
80
60
140 120 100
80
60 2000 2002 2004 2006 2008 2010
Hourly labour cost Consumer prices
Trading partners consumer prices
110 100 90
80
70
60
110 100 90
80
70
60 2000 2002 2004 2006 2008 2010
Hourly labour cost Consumer prices
Trading partners consumer prices
120 100 80 60
40
20
120 100 80 60
40
20 2000 2002 2004 2006 2008 2010
Hourly labour cost Consumer prices
Trading partners consumer prices
105 100 95 90 85 80 75
105 100 95 90 85 80 75 2000 2002 2004 2006 2008 2010
Productiv ity Real wage
115 110 105 100 95 90 85 80
115 110 105 100 95 90 85 80 2000 2002 2004 2006 2008 2010
Productiv ity Real wage
110 100 90 80 70 60 50
40
110 100 90 80 70 60 50
40 2000 2002 2004 2006 2008 2010
Productiv ity Real wage
Source: Author’s calculation using data from Eurostat and the central statistical offices of the three countries.
Note: For Ireland and Latvia we use the Eurostat indicator for real and nominal effective exchange rate, which is
calculated against 36 trading partners. REER- ULC from Eurostat is available only up to 2010Q4. Values for 2011Q1-Q3 are our estimates. For Iceland we use the real effective exchange rate published by the Central Bank of Iceland but the nominal effective exchange rate (NEER) is not available from official sources. Therefore, we used the NEER calculated by Darvas (2011), which may not be consistent with the REER of the Central Bank of Iceland. However, the bias from this inconsistency could be quite small, since trading partners ULC –line (3) of Table 4– looks reasonable and it was derived from the REER, NEER and domestic ULC. For each variable two lines are shown: the seasonally adjusted data (we used Census X12 for seasonal adjustment) is indicated with a thin line with symbols, and the Hodrick-Prescott
filtered values are shown with the same colour thick line without symbols. For Hodrick-Prescott filtering we used the smoothing parameter 1, a very low parameter, to filter out high frequency noise only. Note that the standard smoothing parameter for quarterly data is 1600. The comparison of the original and this Hodrick-Prescott filtered series suggests that the filter well captures the main tendencies and also the turning points.
Table 5: Latvia: percent change in hourly labour costs by kind of activity
change from 2008
to 2010
change from 2007
to 2010
TOTAL -7 14
Agriculture, Forestry and Fishing
(A) 1 20
Mining and quarrying (B) -1 22
Manufacturing (C) -2 19
Electricity, gas, steam and air
conditioning supply (D) 1 5
Construction (F) -5 14
Wholesale and retail trade; repair of motor vehicles and motorcycles
(G) -6 17
Accommodation and food service
activities (I) -3 22
Information and communication (J) -2 25 Financial and insurance activities
(K) -7 11
Real estate activities (L) -3 16
Professional, scientific and
technical activities (M) 3 25
Public administration and defence;
compulsory social security (O) -26 -14
Education (P) -22 -2
Human health and social work
activities (Q) -16 1
Source: Central Statistical Office of Latvia
2.2 Bank rescue and bank losses
The second main difference between the countries is their capacity to save banks and the consequent distribution of bank losses.
In Iceland, where credit to the private sector reached 3.5 times Icelandic GDP (Table 1), the
combined balance sheet of banks reached an even greater number, and banks heavily borrowed from the wholesale market6, the government did not have the means to save the banks (Buiter and Sibert, 2008; Benediktsdottir, Danielsson and Zoega, 2011). Therefore, there was no choice but to let the banks default when global money markets froze after the collapse of Lehman Brothers in September
6 For example, according the aggregate balance sheet of the credit system published by the Central Bank of Iceland, gross foreign borrowing exceeded lending to the domestic non-financial sectors in 2006 and 2007.
2008. Banks also suffered heavily from their domestic lending. In addition to the recession and the collapse in housing prices, the depreciating currency and the consequent accelerating inflation also led to deteriorating bank balance sheets. In mid-2008 more than 70 percent of total corporate loans were denominated in foreign currencies and most lending to households was indexed to the
consumer price index. Borrowers, therefore, found it more difficult to service their debts. In addition, the Icelandic Supreme Court declared illegal foreign-exchange-indexed loans (ie loans paid out and collected in Icelandic krónur, but indexed to foreign currencies), thereby increasing the burden on banks7.
Domestic deposits in Iceland (by both residents and non-residents) were fully guaranteed, but the issue of the depositors of Icesave, which operated as a branch of Landsbanki (one of the three formermajor Icelandic banks) in the UK and the Netherlands, is still unsettled. Foreign creditors of Icelandic banks faced a €47 billion loss (source: Benediktsdottir, Danielsson and Zoega, 2011, citing the Financial Services Authority of Iceland report). This loss is 3.1 times greater than 2007 Icelandic GDP and 5.4 times 2009 Icelandic GDP. The Central Bank of Iceland also suffered losses, since it provided massive liquidity support to banks, which, by mid-2008, reached about one-third of GDP (source: liquidity support is from Figure 3 of Benediktsdottir, Danielsson and Zoega, 2011; GDP is from Eurostat). Consequently, the Central Bank of Iceland needed significant recapitalisation from the government. Bank-related losses increased the public debt ratio by about 20 percentage points of GDP8. Parallel to the collapse of banks, the banking system was restructured to manage domestic credit and to keep the payments system functioning (Box 1).
Box 1. Bank restructuring in Iceland
In a matter of few weeks after the collapse of Lehman Brothers in September 2008, wholesale funding disappeared and the three major Icelandic banks, Glitnir, Kaupthing and Landsbanki, could not continue their operations. They were put into receivership and their boards replaced by resolution committees. Each of the failed banks was divided into two: a new and an old bank. New state-owned banks were established, and these banks took over the domestic activities of the three old banks, while international businesses remained with the failed old banks for winding up. The division itself was a complicated affair, involving protracted negotiations over the ‘fair value’ of the defaulted banks' assets as they were transferred to the new, post-crisis banks. In the end, creditors of the old banks placed capital in the new banks, thus ensuring their stake in any potential upside from an economic recovery. All three new banks have been recapitalised with strong capital ratios – in excess of 16 percent of all assets – and are 90 percent funded with deposits. Most of smaller savings banks were also restructured. During the whole process, all deposits in Iceland (both of residents and non- residents) were guaranteed in full.
Source: Central Bank of Iceland.
END BOX
7 The first ruling of the Supreme Court in June 2010 applied to motor vehicle loans to households, which were later extended by the Icelandic Parliament to mortgage loans for residents (December 2010), and by the Supreme Court to corporate loans (June 2011). These loans were converted into domestic currency loans, whereby the outstanding principles of the loans were reduced considerably, and the interest rates were also recalculated (retroactively as well) using the lowest non-indexed interest rate published by the Central Bank of Iceland.
8 According to the table on page 13 of IMF (2011b), bank restructuring debt amounts to 16.2 percentage point out of the 92.6 percent of GDP public debt of Iceland in 2010. According to Benediktsdottir, Danielsson and Zoega (2011) 12 percent of GDP was used to recapitalize banks and 11 percent of GDP to recapitalise the central bank. These numbers do not include the contingent impact of compensating the British and Dutch depositors of Icesave, but
Danielsson and Zoega (2011) argue that the actual cost may not be more than 2% of GDP, since most of the costs will be covered by the recovery from the assets of Lansdbanki, the bank that operated Icesave.
In Ireland, the balance sheet of Irish-owned banks was 3.7 times GDP in 2007, yet with international financial centres the ratio was 7.1 times GDP (Table 1). The Irish government guaranteed most liabilities of Irish-owned banks. In September 2008, the total liabilities of the credit institutions resident in Ireland were €1,446 billion, of which €787 billion was the liability of domestic banks (source: Central Bank of Ireland). According to Davy Research (2009), the liability of Irish-owned banks was €575 billion, of which the guarantee covered € 440 billion. Taxpayers’ money was used to cover bank losses above bank capital (which was wiped out) and subordinated bank bondholders (whose loss is estimated to be about 10 percent of Irish GDP in the form of retiring €25 billion subordinated debt for new debt or equity of €10 billion). According to FitzGerald and Kearney (2011), of the €148 billion of gross public debt at end-2010, €46.3 billion (30 percent of GDP) was due to government intervention in the banking system, which increased to €60 billion (about 40 percent of GDP) by mid-20119. The initial decision for not restructuring banks' senior debt was made entirely by the Irish authorities. But later, when the problems with the blanket guarantee became clearer and the issue emerged in political debates, the pressure from European institutions, most prominently the European Central Bank, but also from governments including countries outside the euro area (UK, US), prohibited a changed in the policy. The European Central Bank feared
disruption of bank-funding markets throughout the euro area10.
At the same time, the Eurosystem (lending from the European Central Bank and from the Central Bank of Ireland via the Exceptional Liquidity Assistance11), provided ample liquidity. This support is given at a very low interest rate of about one percent per year – well below the previous funding cost of banks, thereby amounting to significant support for Irish banks. The amount of Eurosystem
lending has fluctuated between €78 billion and €138 billion since October 2008, the June 2011 figure amounting to €100 billion. Therefore, this massive low-interest rate lending was (and still is) a significant support to Irish banks.
In Latvia about two thirds of the banking system was owned by foreign banks (mostly Scandinavian banks), which assumed banking losses and supported their Latvian subsidiaries, thereby making the lender-of-last-resort role of the Latvian central bank less relevant. The Swedish central bank offered a euro/lats swap to Latvia and the ECB agreed with the Swedish central bank a Swedish krona/euro swap. Thereby ECB support could have been channelled indirectly to Latvia. The major
domestically-owned Parex Bank was nationalised. According to the ECB’s data on consolidated banking statistics, the loss incurred by foreign banks was about 5.7 percent of GDP and the loss of domestic banks about 3.6 percent of GDP by 2010 – a large amount, but well below the banking sector losses in the two other case-study countries. IMF (2011c, Table 4, page 35) calculated that bank support boosted the public debt/GDP ratio by about 7 percentage points of GDP by 2010.
2.3 Capital controls
The third major difference was the introduction of capital controls in Iceland but not in the other two countries. Due to fear of further capital outflows and additional depreciation of the Icelandic krona, in late 2008 strict capital controls were introduced in Iceland. This has locked in non-resident deposits and government paper holdings in Iceland and locked out Icelandic krona assets held outside the country, in addition to prohibiting transfers across the border by both residents and non- residents. IMF (2011b, page 14) estimates offshore krona holdings at 30 percent of GDP and reports
9 These numbers do not include the operations of the National Asset management Agency (NAMA).
10 O’Rourke (2011) and Brennan (2010) argue that the IMF advocated that the Irish government not pay back all of unguaranteed senior debt owned by Irish banks, but the EU and the ECB insisted upon the opposite. See Lane (2011a) for arguments against and in favour of restructuring of senior bank debt.
11 See Buiter, Michels and Rahbari (2011).
a high spread between onshore and offshore exchange rates, indicating that the capital controls are effective (Figure 6 of IMF 2011b, page 15).
Viterbo (2011) assessed the legality of Iceland’s capital controls in light of international agreements.
While under the IMF Articles, countries retain the right to impose capital controls, the EEA (European Economic Area) Agreement guarantees the free movement of payments and capital among the European Free Trade Association (EFTA) states and European Union countries. The Icelandic controls were not deemed illegal under EEA regulations, because they were triggered by exceptional economic circumstances. But to remain legal, the restrictions would have to be lifted once the crisis was over, but this seems to be a major challenge (Gylfason, 2011; IMF, 2011b).
2.4 Fiscal consolidation
Fiscal consolidation, ie policy induced changes in government revenues and expenditures, was central to the adjustment programme of all three countries. As table 6 shows, Latvia’s adjustment was the most radical in 2009, while Ireland’s adjustment was the least ambitious in 2010. However, cumulatively the adjustment is broadly similar in the three countries.
Table 6: Annual fiscal adjustment (% GDP)
2009 2010 2011 2012 2013 2014
Iceland 5.1 6.4 2.5 na na na
Expenditure Reductions 3.2 3.6 1.7 na na na
Revenue Enhancement 1.9 2.8 0.8 na na na
Ireland 5.0 2.6 3.7 2.2 1.8 1.6
Expenditure Reductions na na 2.8 1.3 1.2 1.0
Revenue Enhancement na na 1.0 0.9 0.6 0.6
Latvia 9.4 3.3 2.2 0.9 na na
Expenditure Reductions 8.2 1.9 0.6 0.4 na na
Revenue Enhancement 1.3 1.4 1.6 0.5 na na
Sources: Ireland – Table 2 on page 135 of OECD (2011a), Iceland – Table 2.3 on page 73 of OECD (2011b), Latvia - IMF Latvia Team Calculations.
3. Different economic outcomes
Economic outcomes in the three countries were shaped by their pre-crisis vulnerabilities. All three went through massive credit booms (the speediest in Iceland) and an increasing share of construction in output (reaching the highest level in Iceland). Both Latvia and Iceland had unusually large current account deficits – over 20 percent of GDP (Figure 2). Ireland’s deficit was more moderate – about 5 percent of GDP. As a consequence, the net international investment positions of Iceland and Latvia deteriorated significantly before the crisis, while in Ireland the deterioration was modest (Table 2).
Since private capital inflows stopped abruptly in Iceland and Latvia after September 2008, the current account balance had to improve accordingly. The required improvements in external accounts had knock-on effects on all components of demand, employment and public finance.
Figure 2: Current account (% GDP), 1990-2012
-25 -20 -15 -10 -5 0 5 10
1990 1995 2000 2005 2010
Iceland Ireland Latvia
Source: European Commission (2011b).
Note: the shaded 2011-2012 values are forecasts.
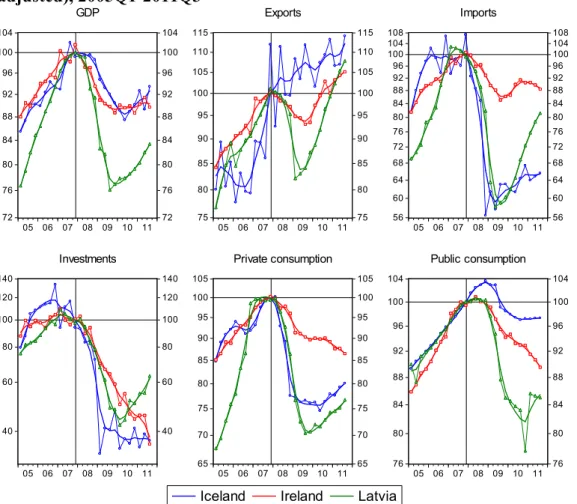
Figure 3: Quarterly GDP and its main components (2007Q4=100, constant prices, seasonally adjusted), 2005Q1-2011Q3
104 100 96 92 88 84 80 76 72
104 100 96 92 88 84 80 76 72 05 06 07 08 09 10 11
GDP
115 110 105 100 95 90 85 80 75
115 110 105 100 95 90 85 80 75 05 06 07 08 09 10 11
Exports
108 104 100 96 92 88 84 80 76 72 68 64 60 56
108 104 100 96 92 88 84 80 76 72 68 64 60 56 05 06 07 08 09 10 11
Imports
140 120 100 80
60
40
140 120 100 80
60
40
05 06 07 08 09 10 11 Investments
105 100 95 90 85 80 75 70 65
105 100 95 90 85 80 75 70 65 05 06 07 08 09 10 11
Iceland Ireland Latvia
Private consumption
104 100 96 92 88 84 80 76
104 100 96 92 88 84 80 76 05 06 07 08 09 10 11
Public consumption
Source: Author’s calculation using the data from Eurostat.
Note: For each variable two lines are shown: the seasonally adjusted data is indicated with a thin line with symbols, and the Hodrick-Prescott filtered values are shown with the same colour thick line without symbols. For Hodrick-Prescott filtering we used the smoothing parameter 1, a very low parameter, to filter out high frequency noise only. Note that the standard smoothing parameter for quarterly data is 1600. The comparison of the original and this Hodrick-Prescott filtered series suggests that the filter well captures the main tendencies and also the turning points.
• In all three countries economic hardship started several quarters before the collapse of
Lehman Brothers in September 2008; therefore, we normalise quarterly GDP figures as 2007 Q4 = 100 in Figure 3. From peak to trough, Latvian GDP collapsed by 25 percent, which is about twice as much as in Iceland and Ireland, even though in all three countries output fell back to its early 2005 level. Among the 184 countries included in IMF (2011d), Latvia suffered from the greatest fall in output in 2009 (18 percent), and also during the three years from 2007 to 2010 (22 percent). Ireland (fifth place) and Iceland (seventh place) are also among the worst performers in the ranking of cumulative output loss from 2007 to 2010, with drops in output of ten and nine percent, respectively.
• In Iceland the massive current account adjustment was to a great extent fostered by export growth. Among the 34 countries for which Eurostat publishes constant price data on exports of goods and services, Iceland was the only country where there was a growth in 2009 compared to 2008 (Figure 4). It is not clear cut if the large exchange rate depreciation had a positive impact on exports in Iceland, because about one-half of exports are concentrated in aluminium and marine products, and the growth of aluminium exports was likely the result of the new capacities built in the years before the crisis (see Appendix). However, the exports of services (comprising 35 percent of total Icelandic exports of goods and services) picked-up in 2009, a year after the real exchange rate depreciation. These exports may have been
positively affected by the depreciation. Also, the higher costs of imports have likely
encouraged import substitution. More generally, the highly increased revenues from export activities likely dampened the impact of the crisis.
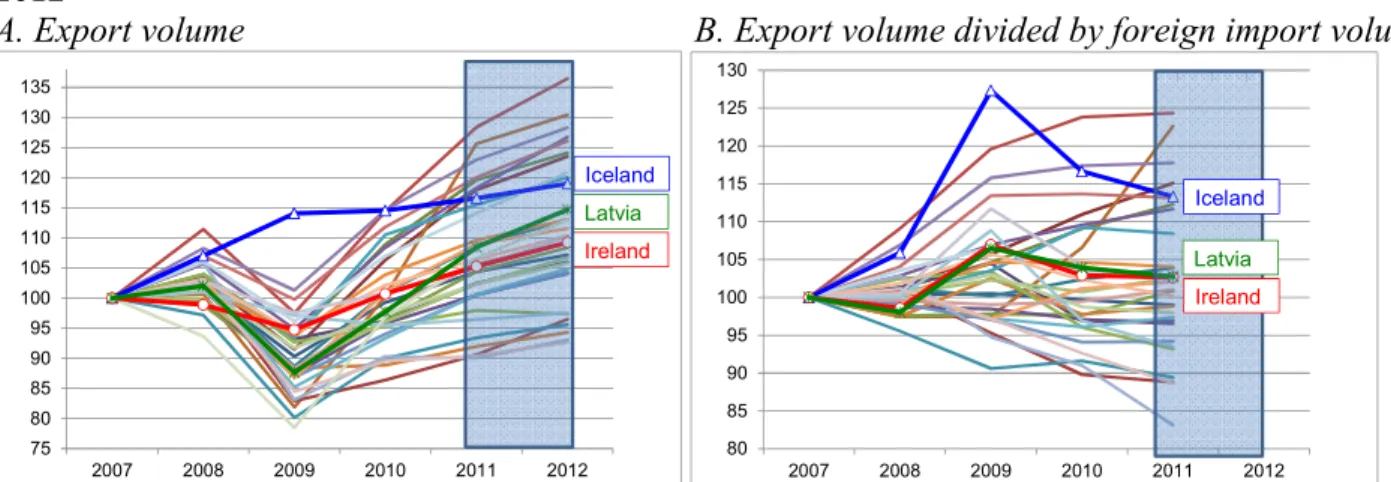
• Exports also started to recover in Ireland and Latvia in 2010, a trend forecast to continue by the European Commission (2011b). However, Ireland and Latvia are only in the mid-field compared to the performance of other countries (Panel A of Figure 4). But, export volumes also depend on foreign demand, which contracted by about 8 percent more for Latvia than for the other two countries12. To correct for different developments in import markets, Panel B of Figure 4 shows the ratio of export volumes of the country under consideration to import volumes of trading partners. The performances of Ireland and Latvia are almost identical in this regard and they are in the mid-field, while Iceland is still among the best performers, though its advantage is declining.
• There was a similar collapse in investment in all three countries and so far investment has started to recover only in Latvia.
• Private consumption went into free fall in both Iceland and Latvia. The adjustment in Ireland was smaller, but it is still on-going, while in Iceland and Latvia private consumption growth has resumed.
• Public consumption adjusted the most in Latvia (a 20 percent drop); less so in Ireland and, in particular, in Iceland. This partly reflects the different speeds of fiscal consolidation in the three countries (Table 6).
• Imports declined by about 40 percent in Iceland and Latvia, in line with the fall in investment and private consumption, while the Irish import decline (14 percent) was similar to the EU average.
12 This is largely due to the higher share of Estonia, Lithuania, Russia and Ukraine (four countries that witnessed massive import contraction) in Latvian exports.
Figure 4: Exports of goods and services in 34 countries (at constant prices, 2007=100), 2007- 2012
A. Export volume B. Export volume divided by foreign import volume
75 80 85 90 95 100 105 110 115 120 125 130 135
2007 2008 2009 2010 2011 2012
Ireland Latvia Iceland
80 85 90 95 100 105 110 115 120 125 130
2007 2008 2009 2010 2011 2012
Ireland Iceland Latvia
Source: Author’s calculation using data from European Commission (2011b), OECD, and national sources (for China, Hong Kong, Singapore, Thailand, Ukraine).
Note: The shaded 2011-2012 values are forecasts. Panel A shows the development of exports of goods and services in 34 countries for which the Eurostat publishes these data: the 27 EU countries plus Iceland,Norway, Switzerland, Croatia, Turkey, United States and Japan. Panel B shows the ratio of export volume to foreign import volume. Foreign import volume is the weighted averages (using country-specific weights derived from 2007 export data) of imports of goods and services of 47 countries, the 34 countries listed so far plus Australia, Brazil, Canada, China, Hong Kong, Israel, Korea, Macedonia (Former Yugoslav Republic), Mexico, Russia, Singapore, Thailand and Ukraine. On average, these 47 countries comprise 89 percent of exports, while for Iceland, Ireland and Latvia the coverage is 94-95 percent.
These developments in output and demand translated into very different social impacts.
• Iceland experienced a modest (5 percent) drop in employment from 2007 to 2010 Table 7), while job losses were much more dramatic in Latvia (17 percent) and Ireland (13 percent).
The number of jobs in Latvia fell below the level of early 2000 – though there has been a slight recovery in employment since early 2010 (see the third panel in the third row of Figure 1).
• Poverty was already high in Latvia and has increased, while Iceland was not impacted in this regard, and in Ireland a gradual improvement up to 2009 reversed somewhat in 2010 (Figure 5).
Figure 5: At risk of poverty rate (% of population), 2005-2010
0 5 10 15 20 25 30
2005 2006 2007 2008 2009 2010
Iceland Ireland Latvia EU27
Source: Eurostat (all data but the 2010 data for Ireland, which was chained to Eurostat data using data from the Irish Central Statistics Office).
Note: The rate assesses whether disposable net income (both from employment, investment and social transfers) falls below the poverty threshold. The threshold is set at 60 percent of the national median income per equivalent adult.
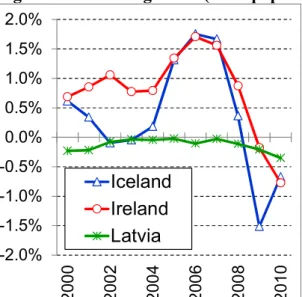
The different employment impacts are not the consequence of shortening work time – in all three countries the average hours worked per week declined by 4-5 percent (Table 4 and Figure 1). Also, the difference is not the consequence of emigration, since Iceland experienced the largest net emigration (as a percent of population) in 2008 and 2009 (Figure 6), even though official data on migration may not be reliable. But in any case, emigration cannot explain the employment impact when the level of unemployment has reached such a high level as in Ireland and Latvia.
Figure 6: Net immigration (% of population), 2000-2010
-2.0%
-1.5%
-1.0%
-0.5%
0.0%
0.5%
1.0%
1.5%
2.0%
2000 2002 2004 2006 2008 2010
Iceland Ireland Latvia
Source: population data is from Eurostat, migration data is from the central statistical offices of the three countries. Note that migration data could be unreliable.
The differences in employment response could be related to policies, the sectoral composition of production, and the shift in sectoral composition.
Table 7 shows that the major differences are
••••
Industrial employment, which remained broadly stable in Iceland, but which fell by almost 20 percent in the other two countries;••••
Public employment, which fell by 10 percent in Latvia, but has even slightly increased in the other two countries;••••
Construction employment, which fell by 33 percent in Iceland and about 50 percent in the other two countries – yet the share of construction employment in total employment was the smallest in Iceland in 2007 and was still the smallest in 2010;••••
Agriculture and fishing employment, which fell less in Iceland (though the share of this sector in total employment is small).Therefore, employment in industry, which is the most tradable sector, was protected in Iceland, but almost every fifth job was lost in Ireland and Latvia.
Table 7: Change in employment from 2007 to 2010
Iceland Ireland Latvia
2007 2010 2007 2010 2007 2010
Agriculture and fishing -8 -23 -21 5.9 5.8 5.5 4.9 9.7 9.2
Construction -33 -54 -50 9.0 6.3 13.4 7.1 11.3 6.7
Finance and real estate -3 -5 -3 14.9 15.2 13.6 14.9 9.8 11.5
Industry -1 -19 -18 11.7 12.2 14.0 13.0 16.5 16.3
Public Administration 2 5 -11 34.3 36.9 27.0 32.5 23.3 24.7
Trade, Tourism, Transport -8 -9 -10 24.3 23.5 26.5 27.6 29.3 31.6
Total -5 -13 -17 100.0 100.0 100.0 100.0 100.0 100.0
2007 to 2010 percent change Share in total employment (percent)
Iceland Ireland Latvia
Note: The peak of Icelandic construction employment was in 2008, which was followed by a 40 percent fall by 2010.
Source: European Commission (2011b).
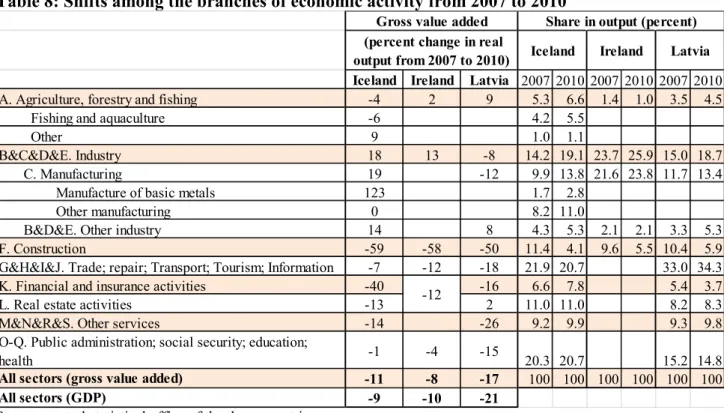
Table 8: Shifts among the branches of economic activity from 2007 to 2010
Iceland Ireland Latvia 2007 2010 2007 2010 2007 2010
A. Agriculture, forestry and fishing -4 2 9 5.3 6.6 1.4 1.0 3.5 4.5
Fishing and aquaculture -6 4.2 5.5
Other 9 1.0 1.1
B&C&D&E. Industry 18 13 -8 14.2 19.1 23.7 25.9 15.0 18.7
C. Manufacturing 19 -12 9.9 13.8 21.6 23.8 11.7 13.4
Manufacture of basic metals 123 1.7 2.8
Other manufacturing 0 8.2 11.0
B&D&E. Other industry 14 8 4.3 5.3 2.1 2.1 3.3 5.3
F. Construction -59 -58 -50 11.4 4.1 9.6 5.5 10.4 5.9
G&H&I&J. Trade; repair; Transport; Tourism; Information -7 -12 -18 21.9 20.7 33.0 34.3
K. Financial and insurance activities -40 -16 6.6 7.8 5.4 3.7
L. Real estate activities -13 2 11.0 11.0 8.2 8.3
M&N&R&S. Other services -14 -26 9.2 9.9 9.3 9.8
O-Q. Public administration; social security; education;
health -1 -4 -15
20.3 20.7 15.2 14.8
All sectors (gross value added) -11 -8 -17 100 100 100 100 100 100
All sectors (GDP) -9 -10 -21
Iceland Ireland Latvia Share in output (percent) Gross value added
(percent change in real output from 2007 to 2010)
-12
Source: central statistical office of the three countries.
Note: empty cells indicate non-available data. For Ireland, data for the branches K and L are not available separately, but only their aggregate. The peak of Irish construction output as a share of total output was 10.6 percent in 2006.
Looking at the shifts in economic activity (Table 8), the share of industry in total output has increased in all three countries, but while in Iceland and Ireland real industrial output has also increased, in Latvia real industrial output fell, though by a lesser magnitude (by 8 percent) than total output (17 percent).
Comparison of Tables 7 and 8 allows productivity developments to be inferred. Of particular
importance, industrial productivity has increased in all three countries – most rapidly in Ireland by 39 percent, followed by Iceland (19 percent) and Latvia (12 percent).
The differences between Iceland and Latvia in terms of output and employment are likely explained by real exchange rate developments, since both countries had to adjust massively their net external financing. The prompt and significant nominal and real exchange rate adjustment increased the revenue of exporting companies (even if the debt servicing burden went up for those with foreign
currency loans), while in Latvia the ULC-based real exchange rate depreciation was delayed, gradual and smaller in magnitude. It also seems reasonable to assume that the Irish output fall was less dramatic than in Latvia because of the smaller external adjustment need.
However, what is less clear is why Irish employment contracted much more than in Iceland given the broadly similar GDP developments and the fall in the share of construction in GDP. Construction employment fell more in Ireland than in Iceland, but this is just one and not the most important part of the difference, since Irish industrial employment was also dropped massively. Perhaps the major real exchange rate adjustment helped the Icelandic economy to shift from the non-tradable to the tradable sector faster, improving growth prospects, and this mitigated the employment impact, despite the broadly similar output development to date.
But it is also possible that corporate restructuring was delayed in Iceland. Several companies became insolvent due to sharp currency depreciation, because – as we have said earlier – most corporate loans were indexed to foreign currencies. But most of these companies were not closed down but passed into bank ownership – banks have become holding companies of a sort. Banks may have delayed the proper restructuring of these companies so far. Unfortunately we have no information about the speed of corporate restructuring in Ireland, but if this has been much slower in Iceland, it could explain some of the differences in employment developments.
What about public finances?
• Before the crisis, gross government debt was below 30 percent of GDP in all three countries, but started to balloon quickly (Figure 7). In addition to the fall in output and the large budget deficits, support to the banking sector has also contributed to the increase in public debt13. As said in section 2.2, bank support boosted Irish public debt by about 40 percent of GDP, Icelandic public debt by about 20 percent and Latvian public debt by about 7 percent. Since Iceland and Latvia gained better control over the budget deficit than Ireland – partly due to the difference in bank support – European Commission (2011b) forecasts stabilisation of the debt ratio in the two countries, but in Ireland a further 20 percentage points of GDP increase is expected till 2012 (Figure 7).
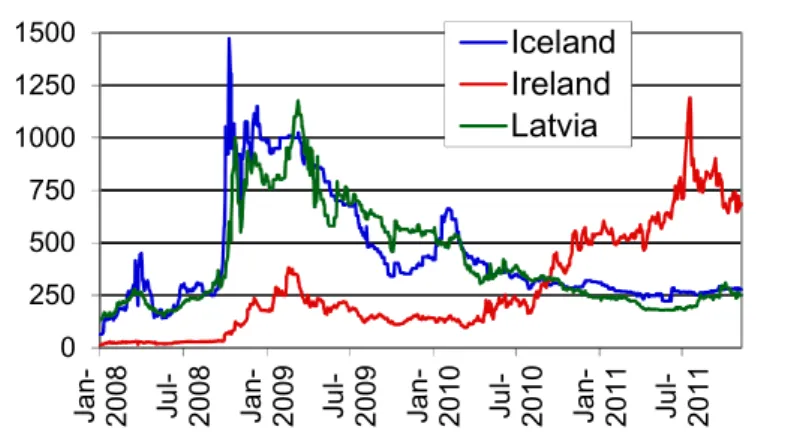
• The credit default swap (CDS) spread on the sovereign rose above 1000 basis points in Latvia and Iceland in late 2008 and early 2009, while staying at a level of about 250 basis points in Ireland (Figure 8). This situation has reversed since then, but Irish CDS spreads have also declined substantially since summer 2011 – despite the on-going euro-area sovereign debt and banking crisis.
• On 9 June 2011, for the first time since the crisis, the Icelandic and Latvian governments successfully issued bonds on the international bond markets (see details in Reuters, 2011).
This is especially remarkable for Iceland, a country that still maintains strict capital controls and let its banks default on their foreign liabilities. Also, both Iceland and Latvia could borrow in domestic currency from the start of the official assistance programme in late 2008 (IMF 2011b and 2011c). In contrast, the Irish government has stopped borrowing from markets since the start of its assistance programme in late November 2010 (IMF 2011a), though small-scale retail and commercial paper selling has continued.
13 Bank support is part of the reported budget deficit, yet it is important to highlight its impact separately.
Figure 7: General government gross debt (% GDP), 1990-2012
0 20 40 60 80 100 120
1990 1995 2000 2005 2010
Iceland Ireland Latvia
Source: European Commission (2011b).
Note: the shaded 2011-2012 values are forecasts.
Figure 8: 5-year credit default swap (CDS) spread on sovereigns, 2 January 2008 – 24 November, in basis points
0 250 500 750 1000 1250 1500
Jan- 2008 Jul- 2008 Jan- 2009 Jul- 2009 Jan- 2010 Jul- 2010 Jan- 2011 Jul- 2011
Iceland Ireland Latvia
Source: Datastream.
4. Conclusions
Iceland, Ireland and Latvia experienced similar developments before the crisis, in particular rapid increases in banks’ balance sheets and the expansion of the construction sector. But the the crisis hit the countries differently:
• Latvia was the world's hardest-hit country in terms of GDP decline. Employment also suffered massively (-17 percent) – more than in any other country for which Eurostat publishes data; the current level of employment is just slightly above the level in 2000. The already high level of poverty has increased further.
• Ireland was the world's fifth hardest hit country in terms of GDP decline from 2007 to 2010 (10 percent) and employment has also fallen significantly (-13 percent).
• Iceland, the world's seventh hardest hit country in terms of GDP decline (-9 percent), came out from the crisis with the smallest drop in employment (-5 percent) among the three countries, despite the greatest shock to its financial system.
In exiting the crisis, there are several encouraging signals for all three countries:
• First, recovery has started in all three countries – with the fastest pace in Latvia – though it has not yet brought many new jobs.