CORVINUS UNIVERSITY OF BUDAPEST
DEPARTMENT OF MATHEMATICAL ECONOMICS AND ECONOMIC ANALYSIS Fövám tér 8., 1093 Budapest, Hungary Phone: (+36-1) 482-5541, 482-5155 Fax: (+36-1) 482-5029 Email of corresponding author: zsolt.darvas@uni-corvinus.hu
Website: http://web.uni-corvinus.hu/matkg
W ORKING P APER
2011 / 1
A C OMPREHENSIVE A PPROACH TO THE E URO -A REA D EBT C RISIS
Zsolt Darvas & Jean Pisani-Ferry & André Sapir
February 2011
A comprehensive approach to the euro-area debt crisis
Zsolt Darvas, Jean Pisani-Ferry and André Sapir
February 2011
Abstract
The euro area‘s sovereign debt crisis continues though significant steps have been taken to resolve it. This paper proposes a comprehensive solution to the crisis based on three pillars: a plan to restore banking sector soundness in the whole euro area, a resolution of sovereign debt crisis -including a revision of EU assistance facilities and a reduction of the Greek public debt- and a strategy to foster growth and competitiveness. The paper provides novel estimates and analysis focusing on the current situation of Greece, Ireland, Portugal and Spain.
JEL: F34, E60, H63
Keywords: fiscal sustainability; euro-area crisis; financial interdependence
The authors are grateful to colleagues inside and outside of Bruegel for comments on earlier versions of this paper, and to Christophe Gouardo for excellent research assistance.
The main text of this paper was first published as Bruegel Policy Brief 2011/02 and the appendix as Bruegel Working Paper 2011/05.
Zsolt Darvas isResearch Fellow at Bruegel, Research Fellow at the Institute of Economics of the Hungarian Academy of Sciences, Associate Professor at Corvinus University of Budapest Jean Pisani-Ferry is Director of Bruegel, Professor of Economics at Université Paris- Dauphine
André Sapir is Senior Fellow at Bruegel, Professor of Economics at the Université Libre de Bruxelles
1. Introduction
More than a year after it started in Greece and later on spread to three other peripheral countries, Ireland, Portugal and Spain1, the sovereign debt crisis in the euro area still goes on.
True, significant steps have been taken to resolve the predicament. Crisis mechanisms have been set up by the EU (the European Financial Stability Mechanism - EFSM) and by the euro area (the European Financial Stability Facility - EFSF), and financial assistance has been provided to Greece and Ireland. Governments in these and other affected countries have implemented severe austerity measures and started to put in place structural reform programmes. And the European Central Bank (ECB) has embarked on a (controversial) peripheral sovereign debt purchase programme, while continuing its earlier support to euro- area banks with ample liquidity provision. But these measures have not been sufficient to restore calm in markets. In early February 2011, spreads on 10-year government bonds issued by Greece, Ireland, Portugal and Spain are all higher than they were in April 2010, before rescue measures started to be implemented.
There are three reasons why European policies have been insufficient to solve the problem:
First, they have failed to recognise the possibility of insolvency and have addressed all crises as if they were purely liquidity crises.
Second, they have failed to address in a systemic way the interdependence between banking and sovereign crises and the interdependence across countries.
Third, they have been mostly reactive rather than proactive, thereby squandering their initially strong credibility by a series of partial, inadequate and belated responses.
To restore market stability and regain credibility a swift, radical and comprehensive solution is now needed. Such a strategy must comprise of three components: fostering adjustment and growth by promoting budgetary consolidation and competitiveness-enhancing domestic reforms in peripheral countries; revising the conditions of EU assistance and restructuring of public debt where needed; and restructuring of banks where needed.
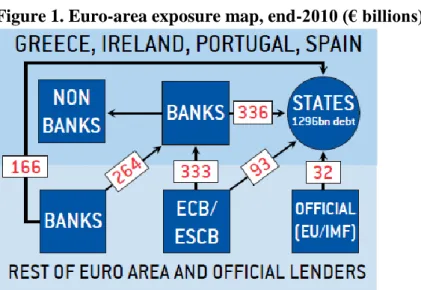
Figure 1. Euro-area exposure map, end-2010 (€ billions)
Sources and notes: see Appendix 2.
1 Our criterion for focusing on these countries is the level of interest-rate spreads on long-term government bonds. We call them ‗peripheral countries‘, because this is the standard expression used by others. We could have spoken of ‗high-spread countries‘.
2. The sovereign debt nexus
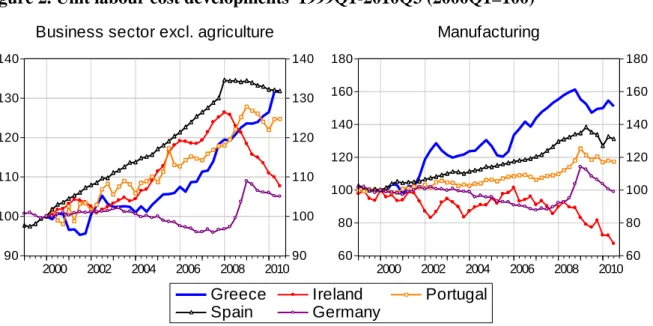
The countries most affected by the euro-area crisis – Greece, Ireland, Portugal and Spain – share many common traits. They have spent and lived beyond their means by accumulating private and/or public debt and running large current account deficits. Nominal wages have also grown beyond what is justified by productivity gains, resulting in prices growing too fast relative to the rest of the euro area (Figure 2). In some cases (Ireland) price divergence essentially took place in the non-traded sector – especially construction and services – whereas in other countries the traded sector – especially manufacturing – was also affected.
Such behaviour, and the policies that made it possible, was fundamentally at odds with euro participation.
In the last two years adjustment has started in these countries and major policy measures have been taken. Results are already visible in Ireland.
Figure 2. Unit labour cost developments 1999Q1-2010Q3 (2000Q1=100)
90 100 110 120 130 140
90 100 110 120 130 140
2000 2002 2004 2006 2008 2010
Greece Ireland Portugal
Spain Germany
Business sector excl. agriculture
60 80 100 120 140 160 180
60 80 100 120 140 160 180
2000 2002 2004 2006 2008 2010
Manufacturing
Source: Bruegel calculations with OECD data
However, as argued by Marzinotto et al (2010), the Greek crisis stands apart from those in the other peripheral countries. First, Greece's public debt predicament has arisen mainly because of public finance mismanagement, while banking problems have played a secondary role.
Second, with a debt-to-GDP ratio scheduled to exceed 150 percent, Greece is clearly on the verge of insolvency. By contrast, in Ireland and Spain, the public finance consequences of private-sector debt accumulation is the main reason for solvency concerns, not least because of the cost of rescuing insolvent banks. Public debt levels in Ireland, Portugal and Spain are more manageable than in Greece2.
This assessment is confirmed by a forward-looking evaluation of the public debt situation in the four countries (Box 1). Under Consensus Economics (2010) forecasts of GDP growth, and
2 Levels in 2011 are forecast to remain below 70, 90 and 110 percent of GDP, respectively, in Spain, Portugal and Ireland.
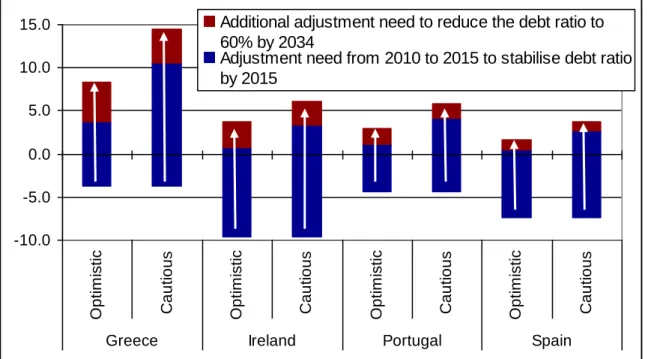
an optimistic evolution of market interest rates (in the case of Greece, a reduction of spreads vis-à-vis Germany from 970 basis points today to 350 in 2014), the adjustment needs are of a frightening magnitude, not only in Greece but also in Ireland. This is even truer under more cautious growth and interest rate assumptions (Figure 3).
Figure 3. Required improvement in the primary balance (% GDP) from its 2010 annual level to its 2015 annual level under different macroeconomic scenarios and different debt stabilisation objectives
-10.0 -5.0 0.0 5.0 10.0 15.0
Optimistic Cautious Optimistic Cautious Optimistic Cautious Optimistic Cautious
Greece Ireland Portugal Spain
Additional adjustment need to reduce the debt ratio to 60% by 2034
Adjustment need from 2010 to 2015 to stabilise debt ratio by 2015
Note: the bottom of the blue bar shows the 2010 primary balance (excluding bank support in the case of Ireland);
the top of the blue bar shows the debt stabilising level of primary balance in every year from 2015 onward; and the top of the dark red bar shows the debt reducing level of primary balance in every year from 2015 onward.
The stabilised levels of debts in the case of the adjustment indicated by the blue part of the bars are the following: 160% in Greece, 123% in Ireland, 98% in Portugal and 84% in Spain.
It is not only the size of the adjustment effort that matters. The key indicator of solvency is the size of the primary budget surplus. This needs to be maintained over a period of years to achieve, in the medium term, a gradual return to safe levels of public debt. Here Greece stands apart from the other countries. Even in the optimistic scenario, the primary surplus required to reduce the debt ratio to 60 percent of GDP by 2034 would be 8.4 percent of GDP. It would reach 14.5 percent of GDP under the cautious scenario. This implies devoting between one- fifth and one-third of tax revenues to interest payments on the public debt. Over the last 50 years, no OECD country (except Norway, thanks to oil surpluses) has sustained a primary surplus above six percent of GDP. Even less ambitious targets would require politically unrealistic surpluses3.
Our conclusion therefore is that Greece has become insolvent. Further lending without a large enough debt reduction is not viable. This does not apply to Ireland which also needs to carry
3 Like many countries the Greek state has assets, including significant holdings of land. These could potentially serve as collateral to guarantee loans but even a major divestiture of public property would be insufficient to modify the conclusion.
out a major budgetary adjustment, but where the primary surplus required to keep the debt ratio sustainable remains within the range of what has been achieved historically4.
However, the possibility of restructuring Greek sovereign debt has met with total opposition both from the Greek government and other euro-area countries. The main argument seems to be that it could create contagion effects and spillovers, since much Greek debt is held by euro- area banks (mainly French and German), which invested heavily in higher-yielding peripheral bonds.
There is also a ‗wait-and-see‘ attitude: it is hoped that Greek reforms will transform the economy, putting it on a faster-track growth path, thereby alleviating the situation. It is also hoped that time will help weaker euro-area banks to restore solvency, so that they are in better shape for restructuring at a later date.
History suggests, however, that a ‗wait-and-see‘ approach is a dubious strategy. Although clearly desirable, reforms and growth acceleration are difficult and time-consuming processes.
The lingering threat of restructuring is likely to be economically and financially damaging.
Moreover, as official creditors - EU partners and the International Monetary Fund (IMF) - are gradually substituting Greece's private creditors, postponement of restructuring would imply, to keep the debt ratio sustainable, either a restructuring of official loans, or a significantly higher eventual haircut on private claims.
BOX 1: SUSTAINABILITY ASSESSMENT We examine two scenarios:
Optimistic scenario:
• Interest rate spreads against German Bunds are optimistically assumed to fall by 2014 from the current high levels to 350 bps in Greece, 200 bps in Ireland, 150 bps in Portugal and 100 bps in Spain, and are assumed to stay at these levels.
• Consensus Economics GDP growth forecasts.
Cautious scenario:
• Expected interest rates are calculated using the expectation hypothesis of the term structure, leading to considerably higher interest rates than in the optimistic scenario.
• Lower growth and inflation compared to the optimistic scenario due to efforts to regain competitiveness, especially in Greece, Portugal and Spain.
In both scenarios we use estimates from Barclays Capital on potential additional bank recapitalisation by governments (for Ireland and Spain, their high-risk estimate): €10 billion in Greece, €31.5 billion in Ireland, €10 billion in Portugal and €75 billion in Spain. We take into account the €17.5 billion that the Irish government has put aside from its cash reserves and liquid assets to support banks. The Spanish value does not include government support already provided. We remain on the conservative side by not assuming any privatisation
4 Considering the current official lending rates to Ireland, a 3.7 percent persistent primary surplus would be needed from 2015 in the optimistic scenario, and 6.1 percent in the cautious scenario, to reduce the debt ratio to 60 percent between 2014 to 2034, according to our calculations. See Table 1 for the impact of possible policies and a fall in market interest rates on these results.
revenue.
The primary balance (in percentage of GDP) in Greece and Ireland is assumed to evolve according to the EU-IMF programme assumptions. For Portugal and Spain we use the European Commission's November 2010 forecast up to 2012, and assume that the primary balance will improve by 1.5 percent of GDP both in 2013 and 2014.
With the above assumptions, we calculated the persistent primary balance needed from 2015 onwards in order to
(a) stabilise the debt/GDP ratio at its 2015 level,
(b) reduce the debt/GDP ratio from its simulated 2014 level to 60 percent of GDP (the Maastricht criterion) by 2034.
The Appendix presents the detailed assumptions and calculations.
3. Assessing the soft options
To be fair, the EU has moved away from complete denial of the Greek debt situation to looking for a middle way between adjustment and debt restructuring. Table 1 gives for the peripheral countries an assessment of what the effects might be of three types of measures that are currently under consideration:
• A lowering of the interest rate charged on all official EU loans (IMF rates cannot be lowered) to 3.5 percent annually;
• An extension of the maturity of all official EU loans to 30 years, and the transformation of the Greek IMF Stand-by Agreement into an Extended Fund Facility (which would extend the repayment date from 2018 to 2023, as in Ireland);
• The purchase by the European Financial Stability Facility (EFSF) of all government bonds currently held by the European Central Bank within the framework of its Securities Market Programme and the retrocession of the corresponding haircut to the issuing country5.
We also provide an evaluation of the effect of a drop of 100 basis points in market yields, and the joint impact of the three policies and the drop in market yields, even though it is difficult to assess the expected market reaction to these measures6.
5 We only consider here buy-backs from the ECB, which is feasible without any market interference. Note also that as the current market value of ECB holdings is close to their value at the time of purchase, we consider this retrocession to be broadly neutral for the ECB profit-and-loss account.
6 Obviously calculations only apply to measures that are currently applicable. For example, we only consider maturity extension for the countries (Greece and Ireland) that benefit from financial assistance; for Portugal we only consider the buy-back of current ECB bond holdings from a 30-year 3.5 percent loan.
Source: Bruegel simulations.
Note: Column (d) is not the sum of columns (b) and (c) because the marginal impact of policy measures is smaller (in absolute terms) when market interest rates are lower.
Each measure would clearly help reduce Greece‘s debt burden both directly and indirectly via lower market interest rates. However, our calculations indicate that even if all the measures were applied it would still not be enough to return Greece to solvency. The primary budget surplus requirement would still be unrealistically high.
Furthermore, the current stance of ‗no default now, but possible default on bonds issued from 2013‘ is inconsistent and not credible. Up to 2012, markets will price in the default option, making it difficult for troubled governments to borrow. From 2013, if the stance is indeed maintained, the Greek government will be unable to issue bonds. However, a second official lending programme for Greece in 2013 would likely meet even more political resistance from euro-area partners and would further increase the share of official creditors in Greek debt.
A debt reduction is therefore necessary for Greece. We estimate that, in order to return to a sustainable path and reach a 60 percent debt-to-GDP ratio by 2034, Greece would need (in addition to the three measures in Table 1) a 30 percent haircut on the marketable public debt7.
7 This assumes that assistance loans will be exempt from restructuring and that market reaction to the debt reduction will result in a drop of the spread vis-àvis Germany to 200 basis points. Under these conditions, from 2015 a 6 percent persistent primary surplus (the programme assumption) is needed in our cautious scenario, with a 3.6 percent surplus in the optimistic scenario, to reach the 60 percent debt ratio by 2034.
4. Assessing potential spillovers
The main obstacle to a rapid resolution of the euro-area crisis is the difficulty policymakers have in tackling the spillover effects between banking and sovereign difficulties and across countries in the absence of European sovereign debt and banking crisis resolution mechanisms.
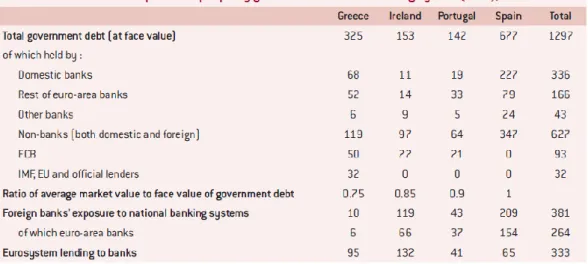
In order to assess what needs to be done, we start from a simplified map of bank and sovereign interdependence in the periphery countries, and between periphery banks and those elsewhere in the euro area (Figure 1 and Table 2). Although drawing up such a map involves a number of assumptions8, it provides a reasonably accurate representation of the actual situation.
Sources and notes: see Appendix 2.
Starting with Greece, our estimates indicate that the spillover from a sustainability-restoring haircut on sovereign debt would have a manageable impact on banks in the rest of the euro area. Some would no doubt need recapitalisation, but even assuming that recapitalisation would be borne by the public purse (a disputable choice and therefore an extreme assumption), the impact on the public finances of other euro-area countries would remain limited. The fear of a domino effect is understandable, but exaggerated.
Table 2 also shows that spillover effects from crises in other countries are clearly different.
The exposure of euro-area banks to Irish sovereign risk is small and it is really exposure to banks that matters. Exposure to Portugal is limited. Only Spain is really systemic, through both the sovereign and the banking channels.
8 See the appendix.
5. A comprehensive solution
A comprehensive solution to the crisis would have three planks:
• A plan to restore banking-sector soundness;
• Resolution of sovereign debt crises;
• A strategy to foster growth and competitiveness.
5.1 Strengthening the euro-area banking system
Our assumptions are deliberately cautious, but we still assess the spillover risks to be manageable and conclude that only Greece is in need of a public debt reduction. We are aware, however, that our information is incomplete.
Our estimates of financial interdependence in the euro area show the exposure of peripheral banks to peripheral sovereigns, and of non-peripheral banks to both peripheral banks and sovereigns. But what is missing from our mapping is the exposure of peripheral banks to potentially non-performing loans and the resulting risk for banks in the rest of the euro area, and for sovereigns in both peripheral and non-peripheral countries, should banks need to be recapitalised with public funds. This gap was supposed to have been filled by the European stress tests published in July 2010. Unfortunately the stress tests were totally discredited by subsequent developments in Irish banks, leading to market concerns that the position of euro- area banks may be far worse than currently admitted.
The implementation of rigorous and credible stress tests is therefore an absolute priority for the euro area. Because EU banking supervisors squandered credibility in the previous round of stress tests, we advocate involving the IMF and possibly the Bank for International Settlements, in the next round of tests. We suggest that the March 2011 European Council adopts the necessary measures to ensure that the forthcoming stress tests be as rigorous and credible as possible.
Once such tests have been carried out, euro-area countries must proceed immediately with bank restructuring where necessary, which should imply the recapitalisation of viable institutions and the closure of non-viable ones. To this end, EFSF funding should be made available to governments.
The restructuring of some banks in core countries is likely to be necessary, especially if bank losses turn out to be significant in Spain, the only peripheral country where restructuring would, according to our estimates, have a significant spillover effect on the rest of the euro area.
Bank restructuring would be accelerated if EU countries were to introduce special bank resolution mechanisms in their domestic legislation, as proposed by the European Commission. In line with the February 2011 German proposal9, we advocate that heads of
9 See, for example, the Financial Times of 3 February 2011, 'Eurozone members are negotiating a ―grand bargain‖ to tackle the bloc‘s debt crisis'.
state and government agree in March to put in place such mechanisms without delay. But beyond national efforts, there is a strong rationale for the creation of a temporary ‗European Bank Treuhand‘ (Posen and Véron, 2009), to catalyse recapitalisation and manage any distressed assets that may fall into public ownership, while keeping fiscal outlays in national hands.
Beyond the immediate short term, there is an obvious need to put in place a solid European banking supervision and resolution framework. One lesson from the crisis is that such a framework must go beyond coordination between national institutions. Nothing less than supranational banking supervision and resolution bodies can handle the kind of financial interdependence that now exists in Europe. Ideally, such bodies should cover all EU countries, since they all belong to a single financial market. However, in case this proves to be politically unrealistic, euro-area countries should create their own institutions.
Before the crisis, the creation of EU- or euro-area banking supervision and resolution institutions was considered unacceptable by European countries because it would amount to the pooling of risks associated with bank failures. The crisis has shown that the absence of such institutions imposes even greater burden-sharing on countries, especially within the euro area, where the ECB has been forced to act as the lender of last resort to banks that may turn out to be insolvent.
5.2 Resolution of sovereign debt crises
Our calculations have shown that it is preferable to implement a significant reduction of Greek debt sooner rather than later.
It would clearly be less disruptive financially to achieve a reduction in the debt level through voluntary exchanges rather than through across-the-board debt restructuring. This justifies giving the EFSF the mission and the financial means to carry out such operations on a significant scale. Euro area leaders should agree to this at the March European Council, as part of the overall package under consideration. The EFSF should immediately buy from the ECB debt securities purchased within the framework of the Sovereign Market Programme.
A debt exchange however is not without problems. In particular, a voluntary exchange will only be marginally effective as long as the EU sticks to its no-restructuring commitment because, if credible, this commitment is an incentive to hold rather than sell the asset. In order to make debt-exchange schemes effective, public authorities would need to convey to markets their determination to achieve a reduction of public debt to a sustainable level. This requires on their part a recognition of the unsustainable character of the present course, and a joint evaluation by the Commission, the ECB and the IMF of the amount of debt reduction needed.
Restructuring would not be easy either, both because of its impact on financial institutions that have not marked debt securities to market (which is the case for many banks) and because of the seniority issue. Currently, bilateral government loans and EFSF loans do not enjoy formal seniority status. Yet it would be unthinkable to bail in those EU members who came to the rescue of their ailing partners, especially since the IMF, which provided parallel loans, enjoys senior creditor status. If formal restructuring is needed, we advocate that it takes
inspiration from the mechanism presented in Gianviti et al (2010).
In both cases, the burden of adjustment should not fall only on private bondholders. First, investors should be offered a variety of new, guaranteed instruments (eg Delpla and von Weizsäcker, 2011). Second, investors should be able to benefit from an upturn in economic conditions through eg GDP-indexed bonds. Third, Greece should post collateral to guarantee the new debt instruments.
Furthermore, Greece and Ireland currently benefit from loans from EU states or the EFSM/EFSF at relatively high interest rates compared to the rates at which these countries or institutions are able to borrow. This was intended to signal that these loans should not be regarded as concessionary, partly in response to fear of recourse to the German constitutional court for breach of the EU treaty‘s no bail-out clause. However, high interest rates have caused political tensions in the borrowing countries and reduced the domestic ownership of the programmes. High rates have also weakened the credibility of these programmes by aggravating somewhat the Greek and Irish sustainability problem. Interest rates on official loans should correspond to the lender's borrowing cost, plus an operational margin, in line with EU assistance to Hungary, Latvia and Romania. The experience of the three countries suggests that countries may be willing not to draw the full amount of the preferential-rate assistance when reasonable market borrowing conditions are restored, in order to boost market confidence10. Longer maturity EU assistance would also reduce the magnitude of haircut on marketable Greek debt and improve the sustainability of other countries receiving assistance.
5.3 Fostering growth in the peripheral countries
Given the size of public and private debt in the peripheral countries, regaining sustainability will mean a combination of lower living standards and higher production, especially in the tradable sector. Economic policy should be geared, first and foremost, towards implementing domestic reforms to increase employment and productivity. However, even if successful, these will take time to produce results. In the meantime, growth will remain subdued and debt, though reduced, will remain high. Private and public sector efforts to pay off their debts will have a negative impact on growth, and low growth will it make more difficult to reduce debt levels. These countries are also confronted with the risk of debt deflation, because restoring competitiveness in the tradable sector will require low price increases and perhaps even deflation.
In order to break this vicious circle, peripheral countries need to first stabilise and then reduce their debt levels while accelerating the pace of economic reform. The EU can and should help with this by fostering reforms and growth in these countries.
We have already emphasised the potential role of better terms for conditional financial assistance and the implementation of comprehensive measures to exit the debt deadlock.
10 The Hungarian government launched in July 2009 a five-year euro-denominated bond with a coupon of 6.75 percent. Following the success of this issuance it has not drawn anything from the remaining portion of the assistance programmes. The Latvian and Romanian governments have also not drawn the full available amounts.
Currently, private investment is being held back and public borrowing costs are high due to lingering uncertainty about banking sector resolution and sovereign defaults.
But the EU should also do more with the instruments at its disposal. We strongly advocate a temporary refocusing of the structural funds earmarked for the peripheral countries, with monies mobilised to support new growth strategies. As argued in Marzinotto (2011), this requires front-loading EU structural spending (without changing its distribution by country), so that it can contribute to fostering reform and growth during the most acute phase of the adjustment. This also requires a joined-up, coordinated approach, including with the EU-IMF programme, instead of the current silo approach. We suggest the March 2011 European Council adopts a programme along these lines.
In the longer term the EU can also help by making better use of its budget. The discussion on the next 2014-20 multiannual financial framework is an opportunity for fresh thinking about new ways to foster investment in the four countries and other crisis-affected countries, especially in central and eastern Europe.
6. Conclusion
For several weeks there has been an expectation among political observers and market participants that the March European Council will deliver measures amounting to a comprehensive solution to the euro-area crisis. This expectation was reinforced by the 4 February 2011 European Council, where euro-area heads of state and government announced their intention to finalise in March a ‗comprehensive strategy to preserve financial stability‘.
We argue that a comprehensive approach must start by recognising two basic facts. First, peripheral countries face a huge challenge in adjusting their weak economies and avoiding a vicious circle of high private and public debt and low growth. Second, banks and sovereigns throughout the euro area are closely interdependent.
Starting from these two facts, which we have documented in this policy brief, we propose a comprehensive strategy comprising three components: the cleaning up of banks, wherever needed and simultaneously throughout the euro area, based on the results of a rigorous stress test given added credibility by the involvement of the IMF and possibly the BIS; revision of the conditions of EU assistance programmes, further empowering the EFSF and the reduction of the public debt in Greece, the only euro-area country which has become insolvent;
fostering adjustment and growth in peripheral countries through budgetary consolidation and competitiveness-enhancing measures, and through mobilisation and better implementation of EU structural funds.
Too much time has been lost, too much confidence has been dented and too much credibility has been squandered in the past year. Building on important decisions already taken, EU leaders should move decisively and agree on a comprehensive package along these lines at the March 2011 summit. This would be a major contribution to the cohesion and the revival of the euro area.
Appendix
11The first part of this appendix describes our sustainability analysis. The second part discusses our euro-area exposure calculations.
A1. Fiscal sustainability assessment
Fiscal sustainability depends on several medium- and long-term factors. In this paper we leave to one side the longer-term issues12 and concentrate on the medium term (up to 2020), as this is the relevant horizon in the current debates about the euro-area sovereign-debt crisis.
Apart from the initial level of debt, fiscal sustainability depends on:
a. borrowing costs, b. GDP growth,
c. ‗non-standard‘ revenues and expenditures (such as bank bail-outs or privatisation revenues),
d. primary balance apart from ‗non-standard‘ operations.
After outlining our two scenarios in section A1.1, we discuss these four aspects in sections A1.2 to A1.5; section A1.5 also includes our baseline simulation results. Section A1.6 details the calculations behind the assessment of the three types of measures that are currently under consideration (lowering the interest rate on EU loans; extending the maturity of official loans;
debt buy-back from the ECB). Section A1.7 describes the calculation behind the haircut needed to restore fiscal sustainability in Greece. Section A1.8 provides a sensitivity analysis to the underlying assumptions.
A1.1 Overview of scenarios
Since official programme assumptions about growth and interest rates are widely viewed with scepticism, we use market information whenever available. We describe two scenarios:
‗optimistic‘ and ‗cautious‘, which differ only in terms of interest rate and growth assumptions. The first scenario is optimistic in the sense that it assumes a significant fall in the market interest rates for Greece, Ireland, Portugal and Spain compared to current and expected future market interest rates.
Borrowing cost:
We take official lending rates as given and adopt assumptions concerning future market interest rates, as follows:
Optimistic scenario: Interest rate spreads against German Bunds are optimistically assumed to fall from the current high levels to 350 bps in Greece, 200 bps in Ireland, 150 bps in Portugal and 100 bps in Spain by 2013/14 and are assumed to stay at these levels;
Cautious scenario: Expected future interest rates are calculated using the expectation
11 This appendix was jointly written with Christophe Gouardo.
12 Every third year, the European Commission performs a sustainability assessment with a 50-year horizon, placing special emphasis on the consequences of ageing. See the latest assessment in European Commission (2009).
hypothesis of the term structure of interest rates (which leads to considerably higher expected future interest rates than in the optimistic scenario).
GDP growth:
Optimistic scenario: Consensus Economics (2010);
Cautious scenario: Lower GDP growth is assumed than in the optimistic scenario, because, especially in the case of Greece, Portugal and Spain, where the business climate is weak and where we see serious competitiveness problems, efforts to regain competitiveness are assumed to impact growth and inflation negatively compared to the previous scenario.
The two scenarios are identical in all other aspects.
Potential additional bank recapitalisation by governments: estimates from Barclays Capital.
Primary balance in 2011-14:
Greece and Ireland: we use the EU-IMF programme assumptions, as indicated in the IMF country reports published in December 2010 (see IMF 2010a and IMF 2010b).
Portugal and Spain: November 2010 forecast of the European Commission up to 2012, and 1.5 percentage points of GDP additional improvement in both 2013 and 2014.
With the above assumptions, we calculate the persistent primary balance needed from 2015 onwards in order to (a) stabilise the debt/GDP ratio at its 2015 level, (b) reduce the debt/GDP ratio from its simulated 2014 level to a level in 2020 that is consistent with a further fall to 60 percent of GDP (the Maastricht criterion) by 2034. For simplicity, we refer to the second case as the case in which the debt ratio is reduced to 60 percent by 2034.
A1.2 Borrowing costs
A1.2.1 Official lending rates
Table A1 shows the composition of financial assistance to Greece and Ireland, which needs to be considered for the overview of official lending rates.
Table A1: Composition of financial assistance programmes (€ billion, unless otherwise indicated)
Contributor Greece Ireland
IMF 30 22.5
Euro-area bilateral lenders * 80 -
Non-euro-area bilateral lenders
UK
Sweden
Denmark
- 4.8
3.8 0.6 0.4
European Financial Stability Facility (EFSF) - 17.7
European Financial Stability Mechanism (EFSM) - 22.5
Irish government - 17.5
Total 110 85.0
Percent of 2010 GDP 48% 54%
Total excluding own contribution 110 67.5
Percent of 2010 GDP 48% 42%
Projected public debt in 2013 (according to IMF baseline scenario)**
374 211
Percent of projected official lending in 2013 public debt 29% 32%
Sources: for Greece IMF Country Report No. 10/372 IMF and European Economy Occasional Paper No. 68; for Ireland IMF Country Report No. 10/366 and European Economy Occasional Paper No. 76.
Note: * The shares of participating member states in the total loan are calculated using the adjusted ECB paid capital key. ** IMF presents baseline scenario on the debt/GDP ratio and on nominal GDP growth. We have used these figures and 2010 nominal GDP data to calculate projected public debt in €.
IMF arrangements
Greece has received a ‗Stand-By Arrangement‘ (SBA), while Ireland has received an
‗Extended Fund Facility‘ (EFF)13. The SBA is of shorter duration (typically 12-24 months, though the Greek programme is for three years, similarly to the Irish programme), with a repayment period of 3¼–5 years, while the EFF is typically three years in duration, with a longer repayment period, between 4½–10 years.
The facilities have identical lending rates, tied to the IMF‘s market-related interest rate (the SDR interest rate, which is a weighted average of euro-area, Japan, UK and US 3-month interest rates; see Table A2). Large loans carry a surcharge of 200 basis points, paid on the amount of credit outstanding above 300 percent of quota. If credit remains above 300 percent of quota after three years, this surcharge rises to 300 basis points14. A service charge of 50 basis points is applied on each amount drawn. There is also a 15-30 basis points commitment fee on amounts that could be drawn in the period, but this fee is refunded if the amounts are borrowed during the relevant period.
13 See at: http://www.imf.org/external/np/exr/facts/sba.htm and http://www.imf.org/external/np/exr/facts/eff.htm
14 Committed IMF lending to Greece amounts to 3,212 percent of Greece‘s quota, while in the case of Ireland 2,322 percent of Ireland‘s quota.
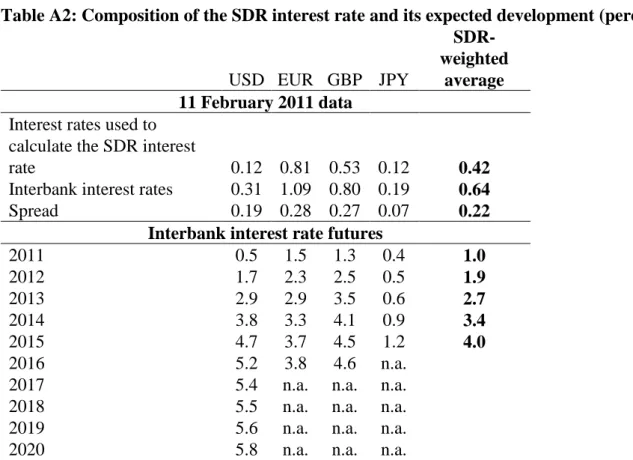
Table A2: Composition of the SDR interest rate and its expected development (percent)
USD EUR GBP JPY
SDR- weighted
average 11 February 2011 data
Interest rates used to calculate the SDR interest
rate 0.12 0.81 0.53 0.12 0.42
Interbank interest rates 0.31 1.09 0.80 0.19 0.64
Spread 0.19 0.28 0.27 0.07 0.22
Interbank interest rate futures
2011 0.5 1.5 1.3 0.4 1.0
2012 1.7 2.3 2.5 0.5 1.9
2013 2.9 2.9 3.5 0.6 2.7
2014 3.8 3.3 4.1 0.9 3.4
2015 4.7 3.7 4.5 1.2 4.0
2016 5.2 3.8 4.6 n.a.
2017 5.4 n.a. n.a. n.a.
2018 5.5 n.a. n.a. n.a.
2019 5.6 n.a. n.a. n.a.
2020 5.8 n.a. n.a. n.a.
Source: Bloomberg and IMF (http://www.imf.org/external/np/fin/data/sdr_ir.aspx).
Note: The following interest rates are used to calculate the SDR interest rate: three-month Eurepo rate; three- month Japanese Treasury Discount bills; three-month UK Treasury bills; and three-month US Treasury bills. The Eurepo is the rate at which one prime bank offers funds in euro to another prime bank if in exchange the former receives from the latter the best collateral in terms of rating and liquidity. Futures are not available for the interest rates used to calculate the SDR interest rate, but available for interbank interest rates. The included interbank interest rates: EURIBOR for the euro and LIBOR for the other three currencies. The difference between the LIBOR rate and the Treasury bill yield is called the TED spread, which is a frequently used measure of liquidity. In the long run the TED spread will likely normalise close to zero. The annual interbank interest rate futures shown are the averages of the implied futures for the middle of March, June, September and December of each year.
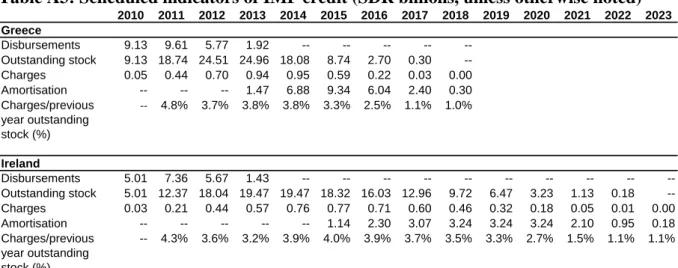
Table A3 shows the scheduled disbursements, repayments and proximate interest rate according to December 2010 information.
Table A3: Scheduled indicators of IMF credit (SDR billions, unless otherwise noted)
2010 2011 2012 2013 2014 2015 2016 2017 2018 2019 2020 2021 2022 2023 Greece
Disbursements 9.13 9.61 5.77 1.92 -- -- -- -- --
Outstanding stock 9.13 18.74 24.51 24.96 18.08 8.74 2.70 0.30 --
Charges 0.05 0.44 0.70 0.94 0.95 0.59 0.22 0.03 0.00
Amortisation -- -- -- 1.47 6.88 9.34 6.04 2.40 0.30
Charges/previous year outstanding stock (%)
-- 4.8% 3.7% 3.8% 3.8% 3.3% 2.5% 1.1% 1.0%
Ireland
Disbursements 5.01 7.36 5.67 1.43 -- -- -- -- -- -- -- -- -- --
Outstanding stock 5.01 12.37 18.04 19.47 19.47 18.32 16.03 12.96 9.72 6.47 3.23 1.13 0.18 -- Charges 0.03 0.21 0.44 0.57 0.76 0.77 0.71 0.60 0.46 0.32 0.18 0.05 0.01 0.00
Amortisation -- -- -- -- -- 1.14 2.30 3.07 3.24 3.24 3.24 2.10 0.95 0.18
Charges/previous year outstanding stock (%)
-- 4.3% 3.6% 3.2% 3.9% 4.0% 3.9% 3.7% 3.5% 3.3% 2.7% 1.5% 1.1% 1.1%
Source: First four rows of each block: Table 22 in IMF (2010a) and Table 9 in IMF (2010b). Bruegel calculation for the fifth rows.
Note: The values shown are December 2010 projections. Ireland did not draw from the facility in 2010; the first disbursement (in parallel with the first EU disbursement) was on 18 January 2011 (see IMF, 2011).
Charges/previous year outstanding stock is an imperfect measure of the interest rate, because part of the charges are related to current year disbursements.
Since IMF lending is disbursed in SDRs and the loan is a floating interest rate arrangement tied to the SDR interest rate, it can be wise to hedge the exchange rate and interest rate risks.
Indeed, Table A2 indicates that all components of the SDR interest rate are forecast to increase according to exchange-traded futures contracts. The SDR interest rate may increase from the current 0.42 percent to around 4 percent by 2015 and by even more thereafter.
Therefore, the proximate interest rates for the coming years reported in Table A3 may prove to be too optimistic. The Irish National Treasury Management Agency (2010) argues that IMF lending could be swapped into a 5.7 percent fixed euro lending rate with a 7.5-year maturity, which is in line with the expected rise in the components of the SDR interest rate. In our calculations we have used this equivalent. For Greece, such a calculation is not available. As the Greek programme is shorter, its fixed-rate euro equivalent is likely to be lower and therefore we assumed 5.0 percent.
EU arrangements
EU funding for Greece is organised through bilateral loans from the participating member states. The loans are centrally pooled by the Commission, which transforms the bilateral loans into a single loan to Greece, conceptually similar to loan syndication. The interest is calculated on the basis of a floating rate (3-month Euribor) with a margin of 300 basis points for the first three years, and 400 basis points thereafter, for each disbursement, plus an up- front service charge of 50 basis points (see European Commission, 2010).
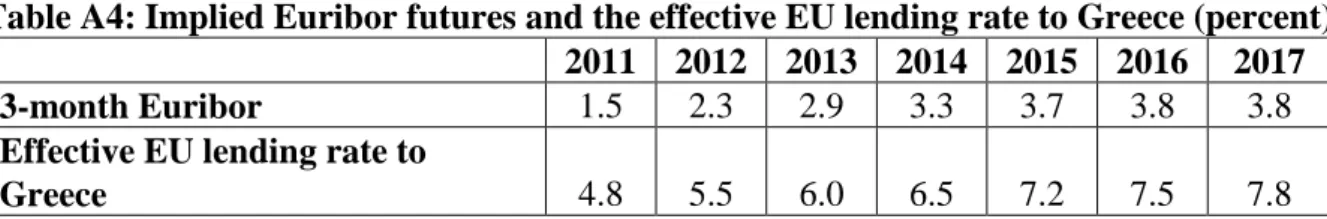
In order to project the EU‘s effective lending rate, we used the implied Euribor rates from the London International Financial Futures and Options Exchange (LIFFE) Euribor futures contracts curve, which is available up to 2016 (we assumed that Euribor stays constant in later years). The derived effective lending rate in Table A4 takes into account the different annual vintages of EU lending and the up-front service charge:
Table A4: Implied Euribor futures and the effective EU lending rate to Greece (percent) 2011 2012 2013 2014 2015 2016 2017
3-month Euribor 1.5 2.3 2.9 3.3 3.7 3.8 3.8
Effective EU lending rate to
Greece 4.8 5.5 6.0 6.5 7.2 7.5 7.8
Source: LIFFE (Euribor 2011-16), Bruegel assumption (Euribor 2017) and Bruegel calculations (effective EU lending rate).
According to the Irish National Treasury Management Agency (2010), the European Financial Stability Mechanism (EFSM) lending rate to Ireland is 5.7 percent, while the lending rate of European Financial Stability (EFSF) is 6.05 percent15. The interest rate on the loans from the three non-euro area countries was not yet set at the time of publication of Irish National Treasury Management Agency (2010); the technical assumption was made that the bilateral loans from the three EU member states will be on the same terms as the funds from the EFSF, ie at 6.05 percent16.
A1.2.2 Market rates
For market borrowing up to 2010 we have used the average coupon value of fixed interest rate bonds, which are (in percent) 3.53 percent in Germany, 4.97 in Greece, 4.64 in Ireland, 4.39 in Portugal and 4.35 in Spain. For simplicity we assumed that these average interest rates apply to all pre-2010 borrowing, but we track different yearly vintages and phase them out according to expiry17.
There are two main possibilities for incorporating new market borrowing into our calculations:
1. making assumptions concerning different maturity borrowing in each year and using their maturity-specific interest rates,
2. assuming that the maturity of all new borrowing equals the average maturity and using the average interest rate across all maturities.
Implementing the first choice would be cumbersome and in our view the simplification
15 See information about the EFSF at http://www.efsf.europa.eu/. We could not find an official website for the EFSM. See Box 10 of European Commission (2011) for details about the EFSF and EFSM financing to Ireland.
16 While we used the 6.05 percent rate for the bilateral loans according to the technical assumption provided in Irish National Treasury Management Agency (2010), more recent information suggested that bilateral lending of UK to Ireland was provided at the 5.9 percent, see http://debates.oireachtas.ie/dail/2010/12/16/00115.asp .The difference in interest rate (0.15 percentage points) is very small on an otherwise relative small portion of assistance loans and therefore our result would not change much by using this somewhat lower interest rate.
17 To be more precise, we had information on the maturity structure of about 85/95 percent of tradable securities, which constitute 56 percent of total borrowing in Germany, and 95 percent in Greece, 61 percent in Ireland, 81 percent in Spain and 89 percent in Portugal. The large discrepancy in the case of Germany is primarily due to state and local level government borrowing, which took the form of loans. We assumed that the remaining tradable securities and all loans have the very same maturity structure as the tradable securities for which we have information.
incorporated in the second assumption does not distort the calculations; therefore, we use this second option. Since the current average maturity in the four countries ranges from 6.5-7.7 years, we assume that new debt issuances will have a 7-year maturity and will carry the average interest rate across all maturities.
The most difficult assumption concerns the future development of interest rates on newly issued debt. One obvious choice is the expected interest rate derived on the basis of the expectations hypothesis of the term structure of interest rates (EHTS, see Box 1). However, it can be argued that trading volume in peripheral bond markets is low, and thus current interest rates may not properly reflect expectations, or that the term premium of longer maturity bonds is sizeable. Furthermore, the probability of default and the implied losses are likely priced in current market yields (especially for Greece). However, market yields will fall if the adjustment programmes succeed and the countries concerned avoid default.
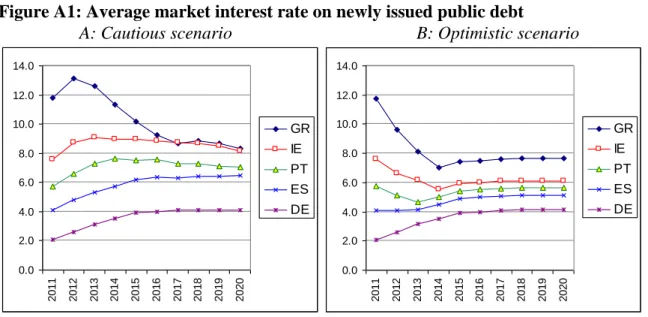
Therefore, in our optimistic scenario, we assume much lower interest rates (especially for Greece and Ireland) than those implied by the EHTS18. We make spread assumptions compared to German Bunds, which are optimistically assumed to fall from the current high levels. We emphasise that our spread assumptions apply to the average interest rate (according to our choice made above), ie the average over various maturities and not just the spread over the 10-year interest rate, which is the most closely watched indicator. For example, using our January 2010 data, the Greek spread over 10-year German Bunds was about 800 basis points, while the spread over 3-year German Bunds was about 1150 basis points. Using the maturity structure of the debt to calculate weights, the average spread over German Bunds was 970 basis points in Greece, 550 basis points in Ireland, 370 basis points in Portugal and 200 basis points in Spain. Using EHTS, these spreads would stay broadly stable in the next few years in Ireland, Portugal and Spain, while in Greece the spread would fall to about 780 basis points by 2014. But in our optimistic scenario we assume a more significant fall of the spread in Greece and also falls in the other three countries: we assume that these spreads will gradually fall to 350 basis points in Greece by 2014, 200 basis points in Ireland by 2014, 150 basis points in Portugal by 2013 and 100 basis points in Spain by 2013. They will then stay at these levels.
Figure A1 shows the average market interest rate on newly issued public debt in the two scenarios, relative to Germany. It is interesting to note that, while not deliberate, in the optimistic scenario, the market rate for Ireland in the second half of the decade – close to 6 percent – is quite close to the EU lending rates to Ireland, while the rate in Greece – close to 8 percent – is also very close to the expected cost of EU lending to Greece (see Table A4).
18 Yet we use the EHTS to proximate future German interest rates, because the concerns mentioned above do not apply to Germany. Consensus Economics (2010) – which was based on an October 2010 survey of professional forecasters – included forecast for the German 10-year bond for 2016-2020, which was 4.1 percent. Our calculation based on EHTS – using January 2011 data – indicated 4.2 percent for the same period.
Figure A1: Average market interest rate on newly issued public debt
A: Cautious scenario B: Optimistic scenario
0.0 2.0 4.0 6.0 8.0 10.0 12.0 14.0
2011 2012 2013 2014 2015 2016 2017 2018 2019 2020
GR IE PT ES DE
0.0 2.0 4.0 6.0 8.0 10.0 12.0 14.0
2011 2012 2013 2014 2015 2016 2017 2018 2019 2020
GR IE PT ES DE
Source: Bruegel calculations.
Box 1: Using EHTS to calculate expected future interest rates
The expectation hypothesis of the term structure of interest rates (EHTS) states that yield on a long maturity bond equals the average of the current and the expected future short maturity yields, plus possibly a term premium, which can compensate for risk related to liquidity for instance, or to the segmented nature of short and long maturity bond markets. For example, the (annualised) yield on a 2-year bond is the average of the current yield on a 1-year bond and the expected 1-year yield one year from now, plus possibly a term premium. By assuming that the term premium is negligible, one can calculate the expected future interest rates using current interest rates. For example, let it(1) denote the current 1-year yield, it(2) the current 2- year yield and E
it(1)1 expected 1-year yield one year from now (all measured in percent per year). Then, taking aside the term premium,
(1)1
) 1 ( )
2
( 1 1
1it it Eit, which allows the calculation of E
it(1)1 from the currently observed it(1) and it(2). The empirical results on EHTS are mixed: some papers reject the hypothesis while some others find support, using various currencies and time periods. In their seminal work Bekaert and Hodrick (2001) find more support for EHTS; see also the recent paper of Bulkley et al (2011) and references therein for similar results.Ideally, zero coupon yields would be needed for using the EHTS, but we could acquire only benchmark yields for the four countries. However, for Germany both zero coupon and benchmark yields are available which are quite similar. We have calculated the implied expected future interest rates for all maturities between 1-year and 10-year up to 2020 (assumed that within year bills pay the 1-year rate and over-10-year bonds pay the 10-year rate). EHTS allows us to derive expected future interest rates for each maturity. But to calculate an average over all maturities we need to make an assumption concerning the future maturity structure of public debt. Lacking a better benchmark, we assumed that the current maturity structure will not change. Consequently, we have then weighted these expected 1, 2,
…, 10-year rates (in every year between 2011 and 2020) with the assumed constant maturity structure of the debt to arrive at the average interest rate of newly issued debt in each year.
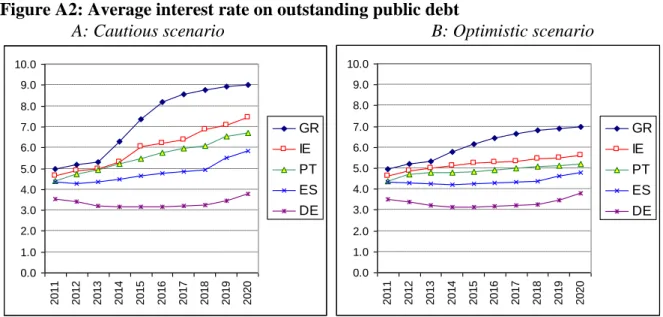
A1.2.3 Average interest rate on outstanding public debt
The volume of newly issued market securities is calculated as the total debt minus the stock of official lending (in Greece and Ireland) minus the stock of pre-2011 market debt. Total debt is determined by debt dynamics and therefore the average interest rate on outstanding debt (Figure A2) depends on the particular scenario used to calculate debt dynamics. Figure A2 is based on our benchmark scenario, though the average interest rate is only slightly different in other scenarios.
For both market and official lending we track their annual vintages19 and calculate the actual interest to be paid (in euros) in a given year as the product of the interest rate and the debt stock of the particular vintage at the end of the previous year. Dividing total interest payments in a year with the total stock of debt at the end of the previous year provides a measure of the average interest rate on outstanding public debt. The results are shown in Figure A2.
Figure A2: Average interest rate on outstanding public debt
A: Cautious scenario B: Optimistic scenario
0.0 1.0 2.0 3.0 4.0 5.0 6.0 7.0 8.0 9.0 10.0
2011 2012 2013 2014 2015 2016 2017 2018 2019 2020
GR IE PT ES DE
0.0 1.0 2.0 3.0 4.0 5.0 6.0 7.0 8.0 9.0 10.0
2011 2012 2013 2014 2015 2016 2017 2018 2019 2020
GR IE PT ES DE
Source: Bruegel calculations.
A1.3 GDP Growth
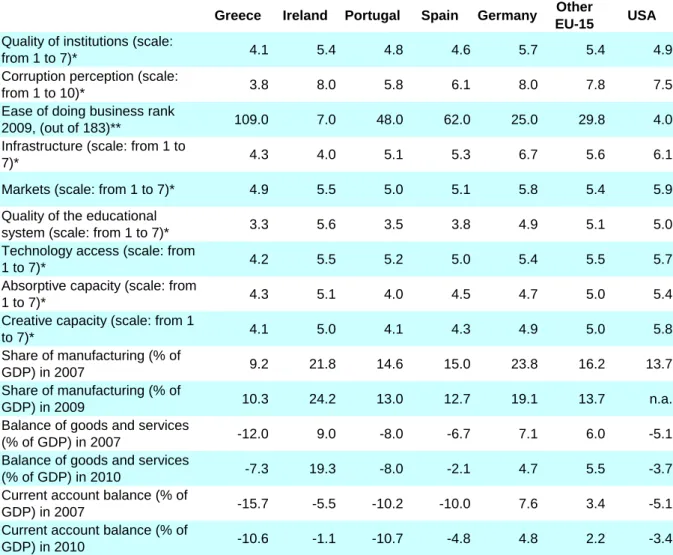
The four countries have different growth outlooks; in particular, Ireland has better growth prospects than Greece, Portugal and Spain.
Table A5 presents some structural indicators for Greece, Ireland, Portugal and Spain in comparison to Germany, the average of the other ten EU15 countries, and the USA. Ireland clearly stands out in almost every respect: it has an excellent business environment, institutions, educational system and technological capacity. In the latter aspect, it even has a better score than Germany and has scores comparable to those of the USA for a couple of other aspects. Towards the end of the pre-crisis boom, by 2007, Ireland had the third highest share of manufacturing in GDP of all EU15 countries (after Finland and Germany), a share
19 While interest rates vary within year as well, we treat all borrowing in a given year as paying the same interest rate.
that had risen to the highest level within the whole EU by 2009. It had a significant surplus (9 percent of GDP) in the external balance of goods and services in 2007, which has even expanded to 19 percent of GDP in 2010. All of these are indication of a strong Irish tradable sector and an excellent business climate. However, the three Mediterranean countries, and especially Greece, are weaker in all these dimensions when compared to Ireland, Germany and other EU15 countries, and the data suggests that their tradable sectors are weak.
Table A5: Some structural indicators
Greece Ireland Portugal Spain Germany Other
EU-15 USA Quality of institutions (scale:
from 1 to 7)* 4.1 5.4 4.8 4.6 5.7 5.4 4.9
Corruption perception (scale:
from 1 to 10)* 3.8 8.0 5.8 6.1 8.0 7.8 7.5
Ease of doing business rank
2009, (out of 183)** 109.0 7.0 48.0 62.0 25.0 29.8 4.0
Infrastructure (scale: from 1 to
7)* 4.3 4.0 5.1 5.3 6.7 5.6 6.1
Markets (scale: from 1 to 7)* 4.9 5.5 5.0 5.1 5.8 5.4 5.9
Quality of the educational
system (scale: from 1 to 7)* 3.3 5.6 3.5 3.8 4.9 5.1 5.0
Technology access (scale: from
1 to 7)* 4.2 5.5 5.2 5.0 5.4 5.5 5.7
Absorptive capacity (scale: from
1 to 7)* 4.3 5.1 4.0 4.5 4.7 5.0 5.4
Creative capacity (scale: from 1
to 7)* 4.1 5.0 4.1 4.3 4.9 5.0 5.8
Share of manufacturing (% of
GDP) in 2007 9.2 21.8 14.6 15.0 23.8 16.2 13.7
Share of manufacturing (% of
GDP) in 2009 10.3 24.2 13.0 12.7 19.1 13.7 n.a.
Balance of goods and services
(% of GDP) in 2007 -12.0 9.0 -8.0 -6.7 7.1 6.0 -5.1
Balance of goods and services
(% of GDP) in 2010 -7.3 19.3 -8.0 -2.1 4.7 5.5 -3.7
Current account balance (% of
GDP) in 2007 -15.7 -5.5 -10.2 -10.0 7.6 3.4 -5.1
Current account balance (% of
GDP) in 2010 -10.6 -1.1 -10.7 -4.8 4.8 2.2 -3.4
Sources: World Economic Forum‘s Global Competitiveness Report (Quality of institutions, Infrastructure, and Quality of the educational system), Transparency International (Corruption perception), World Bank (Ease of doing business), AMECO (share of manufacturing, balance of goods and services, current account balance) and the various sources indicated in Veugelers (2010) for Markets, Technology access, Absorptive capacity and Creative capacity using her methodology.
Note: Other EU-15 is the un-weighted average of the ten other EU-15 countries (EU-15 excluding Greece, Ireland, Portugal, Spain and Germany). *: the higher the better; **: the lower the better
Figure 2 of the main text, showing unit labour cost developments, suggests that Ireland did not have a competitiveness problem in the manufacturing sector even during the boom years20 and total economy unit labour costs have started to decline substantially since 2008. But Greece, Portugal and Spain need to gain price competitiveness, which will likely lead to a long period of low inflation and growth.
20 See Darvas (2010b) for further details on sectoral unit labour costs developments in euro-area countries.