By
H. A. LAITINEN
Department of Chemistry, University of Illinois, Urbana, Illinois CONTENTS
Page
1. Introduction 106 2. Fundamental Principles 106
2.1. The Relation between Activity and Concentration 106
2.2. Electrical Potential 108 2.3. Phase Boundary Potential Difference 109
2.4. Electrode Potential. The Nernst Equation 109
2.5. Cell E.M.F I l l 2.6. Liquid Junction Potential 112
2.7. Applications of the Nernst Equation 112 2.7.1. The Hydrogen Electrode 112 2.7.2. The Quinhydrone Electrode 113 2.7.3. The Calomel Electrode 113 2.7.4. The Metal-Metal Oxide Electrode 114
2.8. Concentration Cells.. 114 2.9. Membrane Potentials 115 2.10. The Glass Electrode 116 2.11. The Potentiometric Titration Curve 118
2.11.1. Precipitation Reactions 118 2.11.2. Neutralization Reactions 120 2.11.3. Complex Formation Reactions 124 2.11.4. Oxidation-Reduction (Redox) Reactions 125
3. Apparatus and Technique 126 3.1. Potential Measurements 126
3.1.1. The Potentiometer 127 3.1.2. Vacuum Tube Voltmeters and Amplifiers 128
3.2. Reference Electrodes and Salt Bridges 129 3.3. Methods of End Point Detection 131
3.3.1. The Classical Method 131 3.3.2. Titration to Equivalence Potential 132
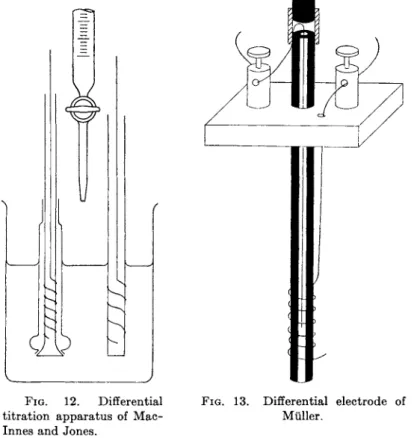
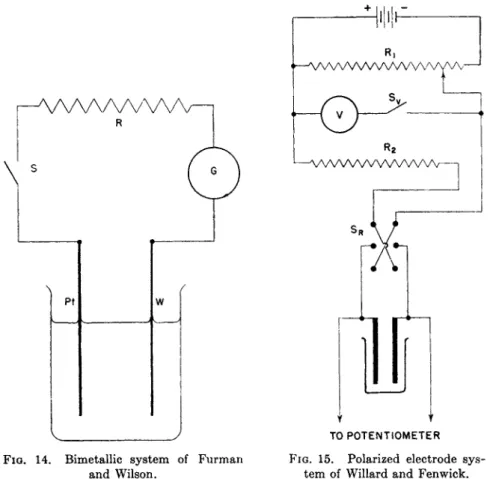
3.3.3. Differential Titrations 134 3.3.4. Bimetallic Electrodes 135 3.3.5. Polarized Electrode Systems 135
4. Practical Applications 138 4.1. pH Measurements 138
4.1.1. The Hydrogen Electrode 138 4.1.2. The Quinhydrone Electrode 140 4.1.3. The Glass Electrode 141 4.1.4. The Antimony Electrode 142
105
References
4.2. Concentration Cells
4.3. Membrane Potential Measurements 4.4. Potentiometric Titrations
4.4.1. Acid-Base Reactions 4.4.2. Precipitation Reactions 4.4.3. Complex-formation Reactions.
4.4.4. Oxidation-reduction Reactions
Page 142 143 144 144 145 146 146 150
1. I N T R O D U C T I O N
T h e term potentiometric analysis includes t h e measurement of con
centration (or activity) b y a single measurement of cell e.m.f. or electrode potential, as well as t h e potentiometric titration. T h e most i m p o r t a n t t y p e of potentiometric analysis based upon a single measurement is t h e determination of p H . Other types of measurement, based on m e m b r a n e potential determinations, concentration cells, a n d changes of cell e.m.f.
b y complex formation are also of analytical interest.
I n t h e usual potentiometric titration, t h e potential of one electrode is k e p t constant (reference electrode), while t h e other electrode (the indicator electrode) varies in accordance with t h e change in concentration or activity of t h e substance being titrated. T h e end point, taken as t h e point of m a x i m u m slope of t h e titration curve, m a y or m a y n o t coincide exactly with t h e equivalence point, a t which t h e substance being t i t r a t e d a n d reagent are present in equivalent a m o u n t s . T h e difference between t h e end point a n d t h e equivalence point (titration error) m a y b e an inherent property of t h e titration system or it m a y be caused b y non- stoichiometry due t o side reactions, coprecipitation phenomena, slow reaction, etc. or b y improper functioning of t h e electrodes. T h e cause, t h e magnitude a n d t h e correction of titration errors are of u t m o s t practical importance.
T h e present discussion is intended t o describe t h e fundamental theory underlying potentiometric methods, a n d t o present examples of their use. A n exhaustive t r e a t m e n t of practical applications lies beyond t h e scope of this work. Likewise, specialized m e t h o d s of end-point detection, automatic recording of potentials, a n d special titration cells can be discussed only very briefly. F o r details, t h e reader is referred to t h e monographs listed a t t h e end of t h e chapter.
2.1. The Relation between Activity and Concentration
Since t h e potential of a n electrode is dependent upon t h e activities of t h e potential-determining substances involved, while potentiometric
2. F U N D A M E N T A L P R I N C I P L E S
measurements are often m a d e for the purpose of determining (at least approximately) concentrations, t h e relationship between these quantities is b o t h of theoretical a n d practical interest.
T h e activity, α», of a substance is defined by the relation
Mi = ki + RT In m (1)
where μ; is the chemical potential or partial molar free energy of t h e sub
stance, R is t h e gas constant, Τ is t h e absolute temperature, a n d ki is a constant for a given substance a t a given t e m p e r a t u r e . T h e constant ki m a y be interpreted as the value of μ; when the substance is in an activ
i t y s t a t e of unity.
B u t a s t a t e of unit activity is purely arbitrary. W e m a y say, as often is done, t h a t a pure substance is in a state of unit activity a t a given t e m p e r a t u r e if it is in the most stable modification of its normal physical state. This definition of a unit activity state is most convenient if we wish to use the mole fraction as the unit of concentration. T h e n for a pure substance, b o t h mole fraction and activity become unity, and t h e value of ki would be t h e free energy of the pure substance.
However, the absolute value of the free energy of a pure substance is indeterminate (the free energy of a pure element is arbitrarily t a k e n as zero), a n d t h e value of λ;» is indeterminate. We are only able to determine experimentally the change of chemical potential, which a t constant t e m p e r a t u r e and pressure, from eq. (1) is
άμί = RTd In ai = RT—ai ( 2 )
Any q u a n t i t y proportional to at would show the same relative change,
—> a n d therefore could be used as a measure of activity.
a{
I n analytical chemistry, t h e most convenient choice of a unit activity s t a t e in solution is based upon t h e concept t h a t in all solutions t h e behavior of t h e solute approaches ideality a t infinite dilution. T h u s activity is a q u a n t i t y which approaches molar concentration a t infinite dilution. A t finite concentrations the activity a n d concentration are not equal, b u t are related b y the equation a = yC, which serves to define the activity coefficient, 7 . T h e activity coefficient approaches u n i t y a t infinite dilution, a n d as a rough approximation the concentration and activity are often considered t o be equal in dilute solution.
For a better estimate, it is very convenient to be able to calculate approximate values of the activity coefficient. Strictly speaking, it is impossible to determine t h e activity coefficient of a single species of ion in a solution of an electrolyte, whereas the activity coefficient of a salt
can often be determined accurately. F o r example, the activity coefficient 7 , for K C l can be experimentally measured, a n d is equal to
Y» - VT K+7 C T
b u t the individual activity coefficients of the ions cannot be evaluated experimentally.
T h e theory of Debye and Hlickel (16), based upon a consideration of electrostatic attraction and repulsion between ions in solution, predicts t h a t in very dilute solutions the activity coefficient of an ionic species depends only on the charge t y p e of the ionic species and the total ionic strength of the solution. Mathematically, t h e Debye-Huckel limiting law is
- log Ύ ί = AZs VS (3)
where A is a constant for a given solvent a t a given temperature, Zt is the charge of the ion, a n d S in the ionic strength, defined b y the expression
8 _ < W + W + · · • = ι £ C i Z < 2 ( 4 )
E q u a t i o n (3), while valid only for very dilute solutions, is useful as a first approximation in t h e calculation of ionic activity coefficients. I n a n y given dilute solution, the activity coefficients of all univalent ions are equal, b u t closer to u n i t y t h a n those of divalent ions. F o r example, in 0.0001 Μ K2S 04, the ionic strength S = 0.0003. F o r water a t room temperature, A is very nearly 0.5. T h e n y is 0.98 for the potassium ions and 0.92 for the sulfate ions.
Uncharged molecules would h a v e activity coefficients of u n i t y according to eq. (3). I n actual practice, deviations from ideality can ordinarily be neglected for nonelectrolytes in moderate concentrations.
I n potentiometric titrations, the ionic strength usually changes very little in the region of the end point where the electrode potential is changing most rapidly. I t is therefore valid in this region t o neglect changes in activity coefficients when calculating the equation of the titration curve.
2.2. Electrical Potential
T h e difference in electrical potential between two points in space is defined as t h e work required to transport a unit positive electric charge from one point t o t h e other. T h e point of higher (more positive) poten
tial is t h a t a t which a positive charge has a higher potential energy, and from which a positive charge will spontaneously move. T h e absolute electrical potential of a point has no meaning unless a reference point, say a t infinity, is taken arbitrarily as having zero potential.
2.8. Phase Boundary Potential Difference
If t w o dissimilar phases, for example t w o metals or a metal a n d a solution, are b r o u g h t into contact, a difference of potential in general exists between t h e two phases. This phase b o u n d a r y potential differ
ence, frequently called a phase b o u n d a r y potential, is incapable of exact measurement. T h e algebraic sum of two or more such potential differ
ences can be measured.
2.4. Electrode Potential. The Nernst Equation
If a metal Μ is immersed in a solution containing its ions Mn+, t h e metal in general will be a t a different electrical potential t h a n the solu
tion. T h e ions of inactive metals tend t o transfer from the solution t o t h e metal, carrying a positive charge t o t h e metal. An active metal has a tendency t o undergo oxidation, transferring its ions from the metal t o t h e solution. T h e valence electrons of t h e metal cannot be transferred t o t h e solution unless a reaction such as t h e evolution of hydrogen occurs.
T h u s as metal ions are transferred to t h e solution, t h e metal acquires a negative charge which hinders a further transfer. E v e n t u a l l y a state of equilibrium is reached where metal ions are being transferred a t equal rates in t h e two directions across t h e boundary. W i t h increasing con
centration of metal ions originally in solution, the transfer of metal ions to t h e solution is hindered or even reversed. T h u s t h e potential of t h e metal a t equilibrium becomes more positive with increasing metal ion concentration in solution.
E v e n though t h e absolute potential difference between t h e metal a n d the solution is unknown, changes in the potential of a single electrode with changes in solution composition can be measured a n d can often be calculated thermodynamically.
F o r a metal-metal ion electrode, it m a y be assumed t h a t a distribution equilibrium of metal ions between the two phases is established.
Let ψ μ be t h e electrical potential of t h e metal a n d ψ8 t h a t of the solu
tion. T h e n t h e electrical work per mole necessary for t h e transfer of metal ions from metal t o solution is given b y nF(\p8 — Ψμ), where η is the charge of the ion a n d F is the faraday of electricity. T h e chemical work per mole is t h e difference in partial molar free energies or chemical potentials in t h e two phases, namely μ8 — MM. At equilibrium, t h e total free energy change for t h e transfer is zero, a n d
nFty, - ψΜ) + μ* ~ μΜ = 0 ( 5 )
or
μ. + n/ty. = μΜ + nF*M (6;
E q u a t i o n (6) states t h a t t h e electrochemical potential (μ + nF\p) of the
solute is equal in the two phases a t equilibrium. If the solute were uncharged, t h e chemical potential μ would be equal in the two phases.
Introducing t h e definition of activity (eq. 1), applying it to the metal ions in both phases and substituting in eq. (6), we have
μ8 — μΜ k8 — JCM . RT . (aMn + )s
nF~ = ~W~ +-nFLNTA-^u ( 7 )
where (aMn+)8 is the activity of metal ions Mn+ in solution, and ( aMN+) M
k — kv
represents their activity in the metal. T h e q u a n t i t y 8 is constant a t a constant temperature, a n d for a pure metal a t constant t e m p e r a t u r e the activity (aMN+)M is constant. Therefore for a pure metal in equilib
rium with a solution containing its ions, we m a y write RT
ΨΜ — ψβ = Constant + -—ρ In (α,ΜΗ+)8 (8) T h e phase b o u n d a r y potential difference ψ Μ — ψ8 cannot be measured,
b u t eq. (8) shows how it varies with the activity of the metal ion in solution.
I t is possible t o measure t h e difference in potential between two differ
ent metals in contact with the same solution. B y assigning a value of zero at every t e m p e r a t u r e to the potential of t h e hydrogen electrode in a solution of unit hydrogen ion activity a n d a t a hydrogen gas pressure of one atmosphere, the potential of another electrode m a y be measured with reference to the hydrogen electrode. T h e normal potential E° is t h e potential, referred to hydrogen, a t a unit activity of metal ions in solution.
F r o m eq. (8), the electrode potential Ε in general is given b y
Ε = E° + 5 1 η ( a M n + )* ( 9 )
E q u a t i o n (9), commonly called t h e N e r n s t equation, m a y be written in a more general form b y considering an oxidation-reduction half reaction
Ox + rle-τ± Red (10) where the oxidant Ox is reduced b y η electrons to form, its reduced form
Red. T h e reduction of a metal ion t o the free metal is a special case of reaction ( 1 0 ) .
T h e electrode potential corresponding t o this reaction has t h e same form as eq. (7), in which the activities of metal ions in t h e two phases are replaced in general by the activities of the oxidized a n d reduced forms of the potential-determining substance, or
If hydrogen ions or other substances of variable activity are involved in the electrode reaction without being oxidized or reduced, their activities m u s t also be included in t h e equation. F o r example, if t h e electrode reaction is
Ox + ne~ + m H+ ^± Red + ^ H20 (12)
the electrode potential varies with hydrogen ion activity,
Ε =E° + ^ \ nnF aa0 x'aHRed + m (13)
T h e activity of water remains essentially constant, a n d is omitted from t h e equation. Several i m p o r t a n t examples of t h e N e r n s t equation are given below.
2.5. Cell E.M.F.
T h e electromotive force of a cell composed of t w o electrodes without liquid junction is numerically equal t o t h e algebraic difference of t h e potentials of t h e t w o electrodes. T o relate t h e cell e.m.f. t o t h e free energy change of t h e cell reaction it is necessary t o a d o p t conventions as t o t h e direction of writing t h e cell reaction, t h e direction of writing t h e corresponding cell, a n d t h e sign of t h e e.m.f. I n general, if t h e cell reaction proceeds spontaneously from left t o right, t h e free energy charge is negative, a n d t h e cell e.m.f. is given a positive sign. If t h e cell is t o have a positive e.m.f., it is written so t h a t negative electricity flows spontaneously from right t o left inside t h e cell as written. Electrons t h e n spontaneously leave t h e left h a n d electrode. T h e right h a n d electrode then is positively charged with respect t o t h e left h a n d electrode.
In other words, the sign of the cell e.m.f. is the same as the charge of the right hand electrode -with respect to the left hand electrode regardless of the direction in which the cell was written. T o calculate t h e cell e.m.f. from the electrode potentials, one simply s u b t r a c t s (algebraically) t h e potential of t h e left h a n d electrode of t h e cell as written from t h a t of t h e right hand electrode, or
Ε cell = bright — E\eft (14)
If t h e electrode potentials are known, t h e spontaneous cell reaction can immediately be written in t h e proper direction, because t h e electrode of more positive potential will act as the oxidizing agent. T h e free energy change of t h e cell reaction m a y be calculated from t h e cell e.m.f. b y t h e equation
AF = -nFEvell (15)
I t should be stressed t h a t it is unnecessary t o a d o p t a convention as to the direction of t h e electrode half-reaction if t h e potential is always given a sign corresponding t o its electrostatic charge with respect t o t h e hydrogen electrode. T h u s t h e zinc electrode will always be given a negative electrode potential, since its charge is negative regardless of whether it is right- or left-hand electrode, and regardless of whether zinc is dissolving or zinc ions are plating out during t h e cell reaction.
2.6. Liquid Junction Potential
If two solutions of different composition are brought into contact, a phase b o u n d a r y potential difference called t h e diffusion potential or liquid junction potential in general exists, owing t o t h e tendency of ions of different mobility t o diffuse a n d migrate a t different r a t e s across t h e boundary. I n simple cases t h e liquid junction potential m a y be cal
culated thermodynamically, and included in t h e expression for t h e cell e.m.f.
I n practical potentiometric analysis t h e liquid junction potential between two solutions m a y be minimized b y t h e use of a salt bridge con
taining an electrolyte composed of ions of nearly equal mobility, e.g., potassium chloride or a m m o n i u m nitrate. B y this means t h e liquid junction potential can be lowered t o a few millivolts for aqueous salt solutions. If should be remembered, however, t h a t if t h e acidities of the two solutions t o be connected are widely different, an appreciable liquid junction potential exists even with a potassium chloride salt bridge, because of t h e abnormal mobilities of t h e hydrogen and hydroxyl ions in water. A junction between an aqueous a n d nonaqueous solution introduces in general an uncertain liquid junction potential.
2.7. Applications of the Nernst Equation
2.7.1. The Hydrogen Electrode. T h e reversible electrode reaction
2H+ + 2e" ^ H2 (gas) (16)
occurs a t noble metal surfaces of large area, such as platinized platinum, freshly plated palladium, or finely divided gold prepared b y decom
posing auric chloride on a gold surface. T h e metal acts as an elec
tronic conductor a n d as a catalyst for t h e electrode reaction.
E q u a t i o n (11) can be directly applied, using for t h e activity of t h e reduced form t h e partial pressure of t h e hydrogen gas. Since hydrogen is very nearly an ideal gas a t room temperature, t h e pressure and activity are very nearly equal. F r o m eq. (11)
(17)
b u t b y arbitrary convention, E° is t a k e n a s zero a n d
C o n v e r t i n g t o ordinary logarithms,
Ε - ψ · 2.303 log αΗ+ - § r 2.303 log PH 2
A t 2 5 ° C , t h e q u a n t i t y 2.303 RT/F h a s t h e value 0.05912, a n d a t 30°C.
it h a s t h e value 0.06006.
Defining t h e q u a n t i t y p H = — log aH+, t h e hydrogen electrode equation a t 25°C. becomes
Ε = - 0 . 0 5 9 1 3 pH - 0.02956 log PH*
where PH 2 represents t h e partial pressure of hydrogen, corrected for water vapor pressure, expressed in atmospheres.
I t is evident t h a t t h e potential of a hydrogen electrode is a linear function of t h e p H , changing 59.13 m v . for a p H change of 1 unit a t 25°.
2.7.2. The Quinhydrone Electrode. Quinhydrone is a n equimolecular compound of benzoquinone, abbreviated Q, a n d hydroquinone, abbre
viated QH2. T h e compound is sparingly soluble in water, t o yield a solution of equal concentrations of Q a n d QH2. A t a n inert electrode such as platinum or gold t h e following electrode reaction occurs:
Q + 2 H+ + 2e" ^± QH2 (19)
Applying t h e generalized N e r n s t equation (eq. 13) we have
£ = 2? ° + § | ΐ η - ^ - . α Η +2 (20)
T h e activities of Q a n d QH2 are very nearly equal since t h e concentrations are equal a n d t h e activity coefficients of t h e uncharged molecules are very nearly u n i t y in salt solutions.
Ε - E° + | J l n aH+* - E° + ^ l n aH+ (21)
F r o m eq. (18) a n d (20) it is a p p a r e n t t h a t t h e potential of t h e quin
hydrone electrode varies in t h e same w a y as t h a t of t h e hydrogen electrode with changes in hydrogen-ion activity.
2.7.3. The Calomel Electrode. A calomel electrode consists of a layer of mercury in contact with a s a t u r a t e d solution of calomel in a solution containing chloride ions, usually in t h e form of potassium chloride. T h e electrode reaction is
H g2C l2 + 2 e - ^ 2Hg + 2C1" (22)
and the potential is given by
Ε = Ε"
+ U
In = Ε" +dug · Q<ci~ rψ
In aCr (23)since t h e activities of solid calomel and mercury are unity. T h e calomel electrode is a mercury-mercurous ion electrode, in which the activity of mercurous ion is determined by t h e activity of chloride ion in t h e solution, in accordance with t h e law of mass action, and therefore it behaves as a chloride ion electrode.
2.7.4- The Metal-Metal Oxide Electrode. T h e A n t i m o n y Electrode.
If a metal Μ forms an insoluble hydroxide Af(OH)n, t h e theoretical electrode reaction of t h e metal in a solution saturated with its hydroxide
M(OH)n + ne^ τ± Μ + nOH" (24)
and the potential is given by
Ε = Ε» + 5 l n ^ = Ε- - ψ ΐ η ΟΟΗ- (25)
or since αΗ+ * αΟΗ- = kw = constant
Ε = Ε° +ψ\ηα,Η+ (26) T h u s a reversible metal-metal hydroxide (or oxide) electrode changes
its potential in t h e same way as t h e hydrogen electrode does.
T h e a n t i m o n y electrode is a common example of an electrode of this type. Practical limitations which govern t h e applicability of the anti
mony electrode for p H measurements are discussed below.
2.8. Concentration Cells
Two types of concentration cell could be considered, namely, those with and without liquid junction.
A concentration cell with liquid junction m a y be m a d e using two metallic electrodes in solutions of t h e metal salt in different concentrations
M\Mn+(C1)\\Mn+(C2)\M (27)
An example of this t y p e of cell is one composed of two hydrogen electrodes in hydrochloric acid solutions of different concentration con
nected by means of a salt bridge. T h e e.m.f. of t h e cell is given by t h e difference of potential of the two electrodes, if t h e liquid junction potential is neglected. F r o m the Nernst equation
= Er - E, = E° + ^ In C m -(e° + ^ In C m ) (28)
= 5 Jl ng ^=^ i n^ n ( 2 9 )
nF C i 7 i nF ax K 1
I t should not be implied t h a t t h e activity of a single species of ion can accurately be measured b y a concentration cell, because the liquid junc
tion potential cannot b e entirely eliminated or accurately estimated in general.
An anion concentration cell with liquid junction can be m a d e in a similar way b y using electrodes of the second class. F o r example, two calomel electrodes of different potassium chloride concentrations con
nected through a salt bridge comprise a cell with a n e.m.f. given b y RT a
Ε = -FT In — if the liquid junction potential is neglected.
A concentration cell without liquid junction m a y be m a d e by a system of two hydrogen electrodes and two calomel electrodes,
H2, Pt|HCl(aO, Hg2Cl2|Hg|Hg 2Cl2, HCl(a2)|Pt, H2 (30)
It m a y be easily shown t h a t the cell e.m.f. is given b y
Ε = —\n (A H + A C 1" )2 = El\n ( C H + ' C c i~h · ( T H + - T C I - ) » (31)
F ( aH +aCi - ) i F ( CH +- C c i - ) i ( T H+- T C I - ) I
= RT (C2HCI)2 (T2HCI)2 2RT ( CHc i )2 (THCI)2
F (C2HCI)I ' (72HCI)I F M (CHCI)I' (7HCI)I K }
since the activity coefficient of HC1 is defined b y
72HCI = 7 H+ · 7 c r (33)
and since the concentrations of chloride and hydrogen ion are equal,
C2HCI = CH+ · Cci- (34)
A concentration cell without liquid junction m a y be used t o measure accurately t h e ratio of activities of a given electrolyte in two solutions.
Strictly speaking, t h e m e a n activity of t h e ions of t h e electrolyte is measured. According t o t h e Debye-Huckel theory, t h e activity coeffi
cient of t h e hydrogen and chloride ions are equal in dilute solutions, so t h a t t o a close approximation, t h e ratio of activities of t h e individual ions can also be measured.
2.9. Membrane Potentials Consider a galvanic cell of the t y p e
Reference electrode
M+A~ Membrane M+B~ Reference electrode
in which solutions of two salts of t h e same metal ion M+ are separated by a m e m b r a n e a n d are connected b y m e a n s of salt bridges t o t w o identical reference electrodes. If t h e m e m b r a n e is impervious t o t h e anions A~
and jB~, b u t permits t h e passage of cations M+ from one solution t o t h e other, t h e n e t cell reaction is
Μ+(αι) M+(a2) (35)
Neglecting liquid junction potentials, t h e cell e.m.f. is given b y a N e r n s t expression
* - τ τ * £ ( 3 6 )
I n practice, this simple relationship is fulfilled only when t h e higher activity (αϊ) is less t h a n of t h e order of 0.01 ilf, t h e limit being determined b y t h e n a t u r e of t h e m e m b r a n e a n d t h e metal ion. T h e more complete theoretical relationship is more involved, as a consequence of t h e fact t h a t a single species of ion cannot freely diffuse t h r o u g h a semipermeable membrane, upsetting t h e condition of electroneutrality of t h e solutions.
T h e theory, based upon t h e D o n n a n m e m b r a n e theory a n d t h e Henderson equation for liquid junction potentials, was suggested independently b y Meyer a n d Sievers (82) a n d b y Teorell (118).
2.10. The Glass Electrode
I t was first shown b y H a b e r a n d Klemensiewicz (38) t h a t a cell of t h e t y p e
Reference
electrode Solution 1 Glass i Solution 2 Reference electrode
consisting of t w o solutions with reference electrode, separated b y a glass membrane, behaves as a hydrogen ion concentration cell. Over a fairly wide p H range, t h e potential difference between t h e t w o surfaces of t h e m e m b r a n e is determined b y t h e ratio of hydrogen ion activities on t h e two sides of t h e m e m b r a n e .
T o account for t h e e.m.f. behavior, t h e glass m a y be assumed t o a c t as a m e m b r a n e permeable only t o hydrogen ions a n d n o t t o acid anions.
A N e r n s t behavior similar t o t h a t for other m e m b r a n e systems should t h e n be observed,
Ε = constant + .0591 (pHi - p H2) (at 25°C.). (37) Therefore, if t h e composition of t h e solution on one side of t h e glass is
kept constant, t h e e.m.f. of t h e cell should be a linear function of t h e p H of t h e solution on t h e other side of t h e glass m e m b r a n e .
Actually, according t o Dole (17), t h e glass does n o t a c t as a semi
permeable m e m b r a n e . E a c h surface of t h e glass acts as a separate phase
boundary, with a potential difference not dependent on the composition of t h e solution on t h e other side. T h e transfer of ions between glass and solution m u s t be considered a t b o t h surfaces with the glass acting as a separate phase. If t h e current across b o t h phase boundaries is carried entirely b y hydrogen ions (transference n u m b e r equal to unity) t h e net result is a transfer of hydrogen ions from one solution t o t h e other, and the e.m.f. is t h e same as t h a t produced by an ideal semipermeable membrane.
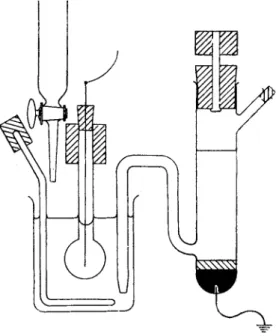
FIG. 1. Glass electrode of Haber.
I t h a s long been recognized t h a t a t high p H values the glass electrode potential is no longer linear with p H (17). T h e magnitude of t h e error increases with increasing p H , with increasing concentration of alkali metal ions. I t depends markedly on t h e composition of t h e glass and varies with t h e t e m p e r a t u r e . A mathematical theory t o account for t h e alkaline error was developed by Dole (20). I t is based upon t h e concept t h a t in highly alkaline solutions t h e concentration of hydrogen ion becomes almost vanishingly small compared t o t h e concentration of other cations, with t h e result t h a t an increasing fraction of t h e current is carried across t h e solution-glass b o u n d a r y b y metal ions. However, the n a t u r e of t h e metal ions is very i m p o r t a n t . T h e largest effect is noted with the small univalent cations such as lithium and sodium ions,
which can readily occupy spaces in t h e distorted silicate lattice of t h e glass. W i t h increasing p H , or with increasing alkali metal ion concen
tration a t a constant p H value, t h e glass assumes in effect an alkali metal m e m b r a n e function t o an increasing extent, a n d t h e measured p H value is low b y an increasing a m o u n t . Electrodes of special composition t o minimize t h e alkaline error are commercially available.
Buchboch (8) a n d M a c l n n e s a n d Belcher (75) first showed t h a t t h e glass electrode is also in error in very acid solutions ( p H below 2). Dole (19) pointed out t h a t t h e same t y p e of error is encountered in very con
centrated salt solutions and in alcoholic solutions even a t intermediate p H values. H e explained t h e effect b y t a k i n g into account t h e transfer of water molecules as well as hydrogen ions (protons) through t h e glass.
I n solutions of very low p H t h e activity of w a t e r is appreciably less t h a n in pure water, and in effect t h e glass electrode behaves as a m e m b r a n e transferring water from one activity state t o another, with a correspond
ing e.m.f. High concentrations of salt or alcohol likewise act t o decrease the activity of water in t h e solution. E v e n in 9 8 % ethanol, t h e effect could be calculated b y taking into account t h e diminished activity of t h e water. F r o m a theoretical point of view it is a p p a r e n t t h a t t h e transfer of solvent imposes a serious limitation on t h e use of t h e glass electrode in mixed or nonaqueous solvents.
T o develop t h e theory of t h e potentiometric curve it is necessary first to consider t h e m a n n e r in which t h e concentration of t h e potential-deter
mining substance or substances varies during t h e titration, next to express the variation of electrode potential with concentration, a n d finally t o find t h e potentiometric end point a n d its relationship t o t h e t r u e equiva
lence point. T h e method will be illustrated b y simple cases which can be extended t o more complicated situations without t h e addition of new principles.
2.11.1. Precipitation Reactions. Consider a positive ion M+ which undergoes a precipitation reaction upon t h e addition of reagent A~, t h e metal ion being t h e potential-determining substance. L e t C be t h e original concentration of M+, y t h e equivalents of A~ added per liter a t a n y point, and χ t h e solubility of MA a t a n y point, in moles per liter.
T h e n neglecting change of activity coefficients, a n d for simplicity assum
ing t h a t the volume remains constant,
2.11. The Potentiometric Titration Curve
and
[£+] = C - y + χ [A-] = χ [B+][A-] = ( C - y +x)(x) = S
(38) (39) where S is the solubility product of MA.
F r o m t h e N e r n s t equation
Ε = E° + ψ In = E° +ψ\η(0 - y + x) (40)
T h e slope of t h e potentiometric titration curve is
dE _ RT ( dx\ u u
dy F(C - y +x)\ + dy) K*L)
E v a l u a t i n g dx/dy b y differentiating eq. (39) we h a v e
4E =
(42)
dy F(C - y + 2x) ^ I t is of interest t o determine t h e point a t which t h e slope is a maxi
m u m . Here t h e second derivative is zero.
<PE _ -RT(C - y) _
dy2 F{C - y + 2x)* U (*d)
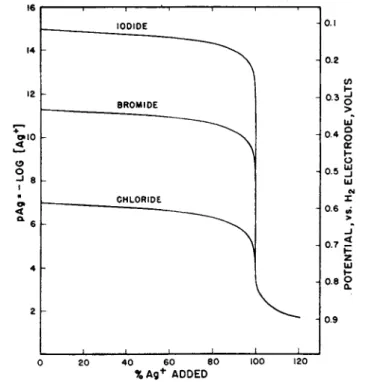
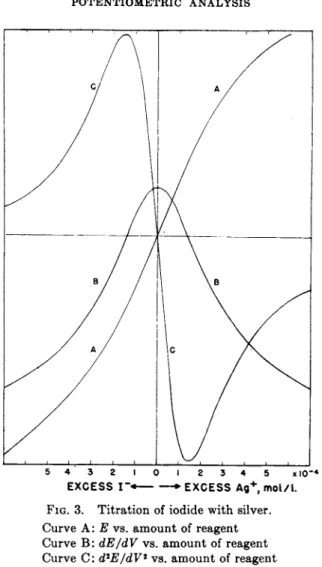
F r o m eq. (43), t h e equivalence point (C = y) is reached when t h e second derivative is zero, or when t h e slope of t h e titration curve is a t a maximum. I n Fig. 2, titration curves are shown plotted for titration of 0.1 Ν solutions of iodide, bromide a n d chloride with silver ion. I t is a p p a r e n t t h a t t h e m a g n i t u d e of t h e potential break a t t h e end point decreases with increasing solubility of t h e salt. A p a r t of t h e silver iodide titration curve in t h e vicinity of t h e end point is shown on a greatly enlarged scale in Fig. 3. T h e slope a n d second derivative, cal
culated from eqs. (42) a n d (43) are shown plotted on t h e same abscissa scale. T h e calculations are idealized in neglecting adsorption effects which in practice distort t h e curves in t h e immediate vicinity of t h e equivalence point (61).
For more complex precipitation reactions, in which precipitate of t h e types M2A, MA2, etc. are formed t h e titration curve in general is n o t symmetrical a b o u t t h e equivalence point. If t h e end point is t a k e n as t h e point of m a x i m u m slope (second derivative equal t o zero) a theoretical titration error exists. T h e error increases with increasing solubility of t h e precipitate a n d with increasing dilution.
Le Blanc and H a r n a p p (68) have developed t h e theory for " electrodes of t h e third class'' t o be used as indicator electrodes for t h e ions of metals for which no convenient solid electrodes are available. F o r example, in t h e determination of calcium, an electrode system such as
A g | A g2C204, C a C204, C a+ +
m a y be used (128), taking a d v a n t a g e of t h e easily prepared silver elec
trode.
I n t h e case of two insoluble salts, BiA a n d B2A, with solubility prod
ucts Si and Sif LeBlanc and H a r n a p p (68) have shown t h a t t h e ideal choice of salts is such t h a t
2Si
+
S%2(5i + A) = 0 . 5
to minimize changes in cation concentration by precipitation or dis
solution processes.
mo ο ο
20
I00IDE
BROMIDE
CHLORIDE
0.1
0.2
0.3 Ο
>
Id a or ο h- o UJ - I UJ Ν 0.6 X
0.8 Ο
0.9
40 60 80
%Ag+ ADDED
100
FIG. 2 . Titration curves of titration of 0 . 1 Ν iodide, bromide, and chloride with silver.
2.11.2. Neutralization Reactions. T h e potentiometric titration curve of a strong acid with a strong base is identical with t h a t of a precipitation reaction in which S = Kw = 10~~14. T h e point of m a x i m u m slope is t h a t a t which t h e hydrogen and hydroxyl ion concentrations are equal, namely a t a p H value of 7.
This situation is no longer true in the titration of weak acids with strong bases or t h e reverse. Here t h e hydrolysis of t h e salt a t t h e equivalence point leads t o a p H value greater or less t h a n 7 depending upon whether t h e acid or base was weak. I t is of interest t o determine whether t h e point of m a x i m u m slope in these cases coincides with the
5 4 3 2 1 0 1 2 3 4 5 χ Ι Ο "4
E X C E SS I ~ « • E X C E S S A g + mol/l.
FIG. 3. Titration of iodide with silver.
Curve A: Ε vs. amount of reagent Curve B: dE/dV vs. amount of reagent Curve C: d2E/dV* vs. amount of reagent
equivalence point. As a first approximation, activities and concentra
tions will be considered identical.
Using the same notation as above, for the titration of a weak acid of ionization constant Ka, we h a v e
C - [HA] + [A-] (44) y + [H+] = A" + [OH"] (from electroneutrality) (45)
and
[H+MA-l
[HA] (46)
F o r any hydrogen ion indicating electrode we m a y write t h e Nernst equation
Ε = E° +
ψ\η
[H+J (47)which gives t h e first and second derivative dE = RT d[K+]
dy F[H+] dy and
dm = RT d*lK+] _ RT (d[K+])*
dy' F[H+]" dy' F[H+]* (dy)
At the point of m a x i m u m slope, t h e second derivative is zero, so t h a t rf2[H+] _ 1 (ri[H+])»
(48)
(49)
dy2 [H+] (dy) Combining eqs. (44), (45), a n d (46) we h a v e
(50)
which m a y be differentiated twice and substituted into eq. (50) giving
([H+] + *.)» = Cka[K+]2 [H+p Ζ <52>
If t h e acid is not extremely weak, we m a y neglect [ H+] a t t h e end point in comparison with ka, and simplify eq. (52) t o give, after clearing fractions,
[ H + ] = V F C 7 T ^ = ^ ( 5 3 )
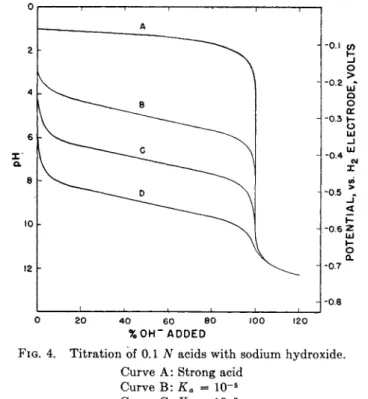
which is identical with equation obtained for t h e hydrolysis of a salt solution of concentration C. T h u s t h e inflection point is identical with t h e equivalence point for moderately weak acids. Titration curves for the titration of 0.1 Ν solutions of a strong acid and for weak acids of ionization constant ka = 10~5, 10~7, and 10~9 respectively, are shown in Fig. 4.
F o r very weak acids, t h e inflection point becomes less pronounced a n d differs somewhat from t h e end point. Roller (102) h a s calculated a theoretical titration error of 0.3 % if t h e product of t h e ionization constant Ka and t h e concentration C of t h e acid is equal t o 1 0 ~n. If t h e product is 10~1 0, t h e theoretical error is only 0 . 0 3 % .
I n practice t h e titration error for very weak acids is of no consequence because t h e slope of t h e titration curve becomes so low t h a t t h e end point cannot be determined with a precision comparable t o t h e titration error.
I n fact E a s t m a n (22) and Roller (102) h a v e shown t h a t no inflection point occurs a t all if C · Κa is of t h e order of 10~1 2 or 10~1 3. T h e limiting factor is t h e ionization constant of t h e solvent {Kw for water), which determines t h e degree of hydrolysis of t h e salt. This limitation can
be overcome in certain instances b y titrations in nonaqueous solvent systems (103, 123).
Polybasic acids m a y be considered as a special case of mixtures of acids in which t h e concentrations are equal. F r o m t h e analytical point of view, t h e first end point cannot be detected with an accuracy of 0 . 5 % unless t h e first dissociation constant is of t h e order of 104 times t h e second dissociation constant. T h e second end point for a dibasic acid simply represents t h e titration of t h e weaker acid, a n d t h e same limitations hold
ι I'
0 8O 20 40 60 80 100 120
% O H " A D D ED
FIG. 4. Titration of 0.1 Ν acids with sodium hydroxide.
Curve A: Strong acid Curve Β: Ka = 10"5
Curve C: Ka = 10"7
Curve D : Ka = 10"9
as for weak acids in general. Carbonic acid is one of special interest (Ki = 3 X 1 0 -7, Z2 = 6 X ΙΟ"1 1) because t h e ratio of KuK2y a n d t h e value of K2 are such t h a t b o t h end points m a y be determined poten- tiometrically with an accuracy of t h e order of 1 %.
T h e titration curves of polybasic acids a n d of mixtures of weak acids are often of interest from a n o t h e r point of view, even t h o u g h t h e end points are n o t accurate enough t o be of analytical value. Michaelis (85) has shown t h a t t h e ionization constants of a dibasic acid m a y be evaluated from t h e titration curve if t h e first a n d second ionization con
s t a n t s differ b y as m u c h as sixteen fold.
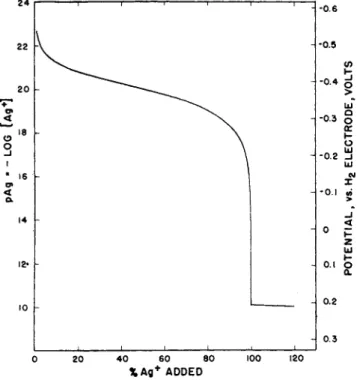
2.11.8. Complex Formation Reactions. T h e formation of a stable soluble complex of a metal ion can often be m a d e t h e basis of a poten- tiometric titration of the metal ion or of t h e complex forming substance.
T h e simplest situation is one in which a single t y p e of complex stable over a wide range of concentration of complexing anion, for example t h e formation of A g ( C N )2~ from t h e silver ion and t h e cyanide ion. E v e n this case is m a d e more complicated by t h e fact t h a t t h e silver salt of t h e complex, Ag[Ag(CN)2] is slightly soluble.
24
ι
, , , , , r — - _σ622 -0.5
Ο Ο
<
α.
- 0 . 4 ^
>
u f
-0.3 §
ϋ UJ -0.2 _j
UJ Σ -0.1 w
-1 UJ Ζ 0.1 ο
Q.
•o h 0.2
20 40 60 80
% A g* ADDE D
100 120
FIG. 5. Titration of 0.1 Ν cyanide with silver.
Starting with a solution containing the cyanide ion, the complex ion A g ( C N )2~ is formed until the solubility product of the salt has been reached, after which the silver ion concentration is practically constant for the points immediately following t h e end point. T h e resulting curve (92) shown in Fig. 5, has an increasing slope until t h e end point, where a discontinuous break occurs upon precipitation. A second end point, corresponding t o t h e complete precipitation of silver argenti- cyanide, very similar to t h a t obtained with chloride, is t h e n obtained.
More involved situations in which a series of complexes of varying composition are encountered are less i m p o r t a n t from an analytical point
of view, b u t t h e titration curves are often extremely useful in t h e evalua
tion of equilibrium constants for t h e stepwise formation of t h e various complexes. Bjerrum (5) h a s succeeded in evaluating equilibrium con
stants and formulating t h e composition of a m m o n i a complexes of various metal ions b y interpreting t h e potentiometric titration curves using the glass electrode. Similar situations of stepwise formation of complexes are often encountered in t h e halide ion complexes of various metal ions.
2.II.4. Oxidation-Reduction (Redox) Reactions. Consider t h e titra
tion of an oxidant Ox, with a r e d u c t a n t Red2. Suppose t h a t a molecule of t h e oxidant requires b electrons for its reduction,
Ox 1 + b e-^±Redi (54) and a molecule of t h e r e d u c t a n t loses a electrons upon its oxidation,
Red2 ^ 0x2 + a e~ (55)
T h e reaction then m a y be written
α Οχι -f b Redi -> a Redx + b Ox2 (56)
Before t h e equivalence point, if half-reaction (56) is reversible, t h e potential varies in accordance with t h e N e r n s t equation,
* = * ' °
+f
l nI S ,
( 5 7 )writing concentrations in place of activities for sake of simplicity.
After t h e equivalence point, t h e potential is most conveniently cal
culated from t h e excess concentration of r e d u c t a n t Red2 and t h e con
centration of its oxidation product, 0x2)
A point of special interest is t h e equivalence point, where t h e con
centrations of oxidant remaining unreduced, Ox\, and the concentration of r e d u c t a n t remaining unoxidized, Red2, m u s t be in t h e stoichiometric ratio a:b. T h u s
[Οχι] [Red!] a
[Red2] [Ox2] b (59)
, , . , [Ozi] [Red2] /ΛΛ\
f r o m w m c h ( M ]=! O S ( 6 0 ) T o calculate t h e potential a t t h e equivalence point (the equivalence
potential), we m a y t a k e a d v a n t a g e of t h e fact t h a t whenever two oxida
tion-reduction systems are in equilibrium, t h e potentials of t h e two systems are equal. Applying this principle t o t h e equivalence point,
Η. Α . L A I T I N E N we m a y write
EEq-Ex + _ l n { g 5 - ] - f t + _ l n [ g S 3 a (61)
Using t h e relationship given in eq. (60), it is readily seen t h a t
E»*
-
α + 6 (62 )F r o m eq. (62) it is evident t h a t in t h e simple case where a = 6, t h e equivalence potential is t h e arithmetic m e a n of t h e two normal potentials.
If a and b are not equal, t h e curve is unsymmetrical a b o u t t h e equivalence point.
An i m p o r t a n t characteristic of redox titration curves is t h a t t h e shape is generally independent of t h e concentration of t h e substance being titrated, in contrast t o precipitation a n d neutralization reactions. This*
behavior follows from t h e fact t h a t t h e potential is determined b y t h e ratio of concentrations of oxidant t o r e d u c t a n t r a t h e r t h a n t h e absolute value of either concentration.
T h e evaluation of t h e slope of t h e titration curves in t h e vicinity of t h e equivalence point becomes quite involved for redox titrations ( 3 5 , 3 9 , 40, 64). I n general, there exists a small t i t r a t i o n error which h a s h a r d l y a n y practical significance because it is negligibly small in those cases where a sufficient difference exists between t h e oxidation potentials of the two systems t o m a k e a t i t r a t i o n feasible in practice.
T h e detailed m a t h e m a t i c a l analysis of t i t r a t i o n curves is of value in evaluating equilibrium constants of reactions (42) a n d t o prove t h e existence of intermediate oxidation products ( 8 3 , 8 5 ) .
An i m p o r t a n t practical limitation t o t h e exact interpretation of titration curves lies in t h e irreversibility of electrode behavior. M a n y electrodes, especially those involving complex oxidation-reduction half reactions do n o t behave reversibly a n d therefore t h e potential does n o t vary exactly in accordance with t h e N e r n s t equation. Often a very exact titration end point is obtained b u t no d a t a of t h e r m o d y n a m i c significance can be calculated from t h e shape of t h e curve.
3 . A P P A R A T US A N D T E C H N I Q UE
3.1. Potential Measurements
T o measure accurately t h e e.m.f. of a cell, it is necessary t o avoid t h e passage of an appreciable current t h r o u g h t h e cell, because t h e passage of current would cause polarization effects due t o chemical reactions a t t h e electrodes, with a consequent change in t h e e.m.f. T w o general
techniques of e.m.f. m e a s u r e m e n t m a y b e recognized: t h e potentiometric compensation uechnique, a n d v a c u u m - t u b e techniques.
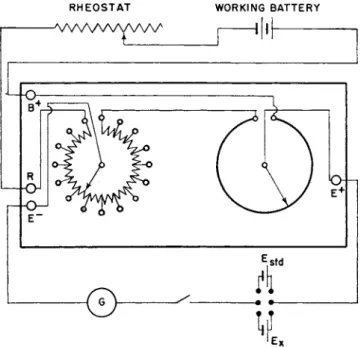
8.1.1. The Potentiometer. T h e m o s t commonly used m e t h o d of e.m.f.
measurement is based u p o n t h e compensation technique, in which t h e u n k n o w n cell e.m.f. is opposed b y a variable e.m.f. from a potentiometer, adjusted until n o current flows in t h e u n k n o w n cell circuit. T h e cell e.m.f. is t h e n equal t o t h e e.m.f. impressed b y t h e potentiometer. T o calibrate t h e potentiometer reading, a s t a n d a r d cell of k n o w n e.m.f. is used.
R H E O S T AT WORKIN G BATTER Y
FIG. 6. Student potentiometer with accessories.
A simplified circuit diagram of t h e Leeds a n d N o r t h r u p student potentiometer is shown in Fig. 6. T h e circuit inside t h e box consists of a series of 15 coils of equal resistance t o represent 0.1-volt settings, a n d a continuous slide-wire of resistance equal t o t h a t of one coil t o represent 0-0.1 volt. T h e total voltage t h r o u g h t h e coils a n d slide-wire is m a d e exactly equal t o 1.6 volts b y adjusting t h e rheostat in series with t h e working b a t t e r y . This is done b y setting t h e dial readings exactly equal t o t h e e.m.f. of a s t a n d a r d cell, a n d balancing t o zero current a s indicated b y t h e galvanometer. T o measure t h e e.m.f. of a n u n k n o w n cell, t h e rheostat is left unaltered, a n d t h e potentiometer dials t h e n read t h e e.m.f. directly in volts when a state of balance is indicated b y a zero
Η. Α. LAITINEN
deflection of t h e galvanometer. I t is advisable to balance against t h e standard cell a t t h e beginning and end of each set of readings, t o guard against a n y change in the voltage of the working b a t t e r y .
T h e working b a t t e r y m a y consist of two d r y cells in series, a single lead storage cell, or a lead storage b a t t e r y . Some of t h e older s t u d e n t potentiometers were made with a range of 0-2.3 volts, in which case a single lead storage cell could not be used. A freshly charged lead storage cell shows a decreasing voltage during the first portion of its discharge, and for t h a t reason it should be connected into the potentiometer circuit and allowed to operate until a constant reading is observed.
T h e usual standard cell which is commercially available is the " u n s a t u r a t e d " Weston cell consisting of a mercury-mercurous sulfate electrode in a solution of cadmium sulfate s a t u r a t e d a t 4°C. and a cadmium amal
gam electrode in contact with the same solution. T h e s t a n d a r d cell must never be short-circuited, and only a very small current should be drawn from the cell during t h e instantaneous depression of the tapping key in t h e potentiometer circuit.
T h e sensitivity of the galvanometer to be chosen depends upon t h e internal resistance of the unknown cell a n d t h e desired sensitivity of the measurement. For most practical work, a current sensitivity of 0 . 0 1 - 0.05 m i c r o a m p e r e / m m . is entirely adequate. This range of sensitivity is available in small enclosed and scale t y p e galvanometers. A gal
vanometer of short period with a shunt circuit of proper resistance t o provide critical d a m p i n g is ideal.
Several commercial types of portable potentiometers are available.
T h e principle is identical with t h a t outlined above, b u t t h e galvanometer, tapping key, standard cell, working b a t t e r y and rheostat are built into a compact unit.
3.1.2. Vacuum Tube Voltmeters and Amplifiers. V a c u u m t u b e tech
niques h a v e proved to be of especial value in t h e measurement of p H with t h e glass electrode, which has an extremely high electrical resistance if t h e thickness of t h e glass wall is great enough t o afford mechanical ruggedness. Several types of commercial p H meters h a v e reached an advanced state of development, using circuits which are simple, s t u r d y and stable. B o t h b a t t e r y and A.C. line-operated i n s t r u m e n t s of various makes are available. A discussion of various t y p e s of amplifier circuits suitable for use with t h e glass electrode h a s been presented b y Dole (18).
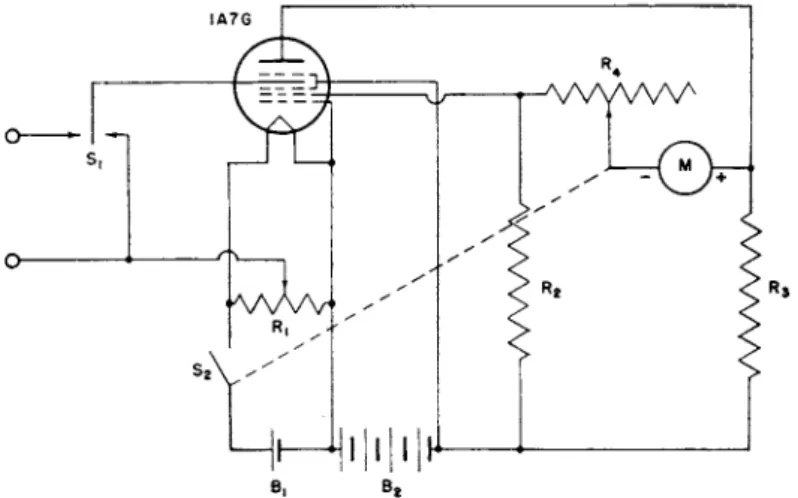
For potentiometric titrations, direct-reading v a c u u m t u b e voltmeters are becoming increasingly popular. T h e circuit diagram of a simple battery-operated instrument, designed b y G a r m a n a n d Droz (34) and introduced commercially as t h e Leitz " E l e c t r o t i t r a t o r , " is shown in Fig. 7. T h e resistors R 2 and R3 are t w o a r m s of a W h e a t s t o n e bridge,
the other two a r m s being t h e effective resistance from t h e cathode t o t h e plate a n d from t h e cathode t o grid-2. T h e microammeter Μ indicates the degree of unbalance of t h e bridge, in such a way t h a t the meter reading is directly proportional t o t h e u n k n o w n e.m.f. a t t h e terminals 1 and 2.
T h e sensitivity of t h e i n s t r u m e n t m a y be adjusted by resistor R4. In this way t h e meter m a y be m a d e to show a full-range deflection over t h e course of a titration.
IA7G
FIG. 7. Electronic circuit of Garmon and Iroz.
Titrimeters using a visual tuning t u b e instead of a microammeter or galvanometer have been introduced b y S m i t h a n d Sullivan (109) and later in a somewhat simplified circuit b y Serfass (104).
3.2. Reference Electrodes and Salt Bridges
Calomel half-cells are very widely used as reference electrodes, both for p H measurements a n d for potentiometric titrations. A potassium chloride solution of definite concentration, s a t u r a t e d with calomel, is placed in contact with mercury a n d solid calomel. Generally t h e calomel is added in t h e form of a paste m a d e b y grinding mercury a n d calomel together in a m o r t a r a n d washing several times by decantation with t h e potassium chloride solution t o be used.
Several types of calomel electrodes are recognized, according t o the concentration of potassium chloride solution used. T h e most common are the 0.1 N, the 1 N, and t h e s a t u r a t e d calomel electrode, corresponding to a 0.1 Ν, 1 N, or saturated solution of potassium chloride.
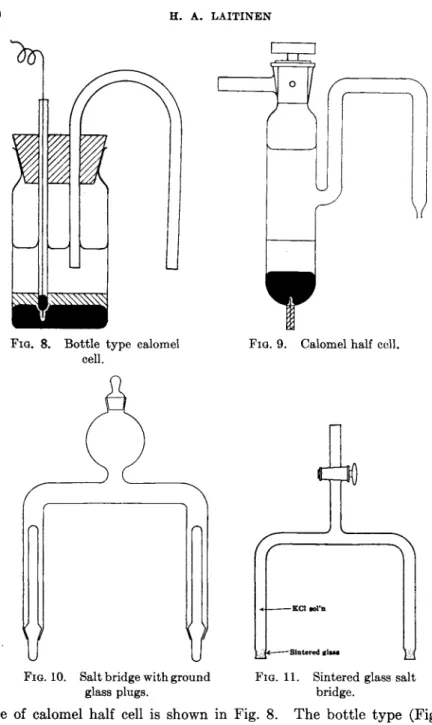
T h e t y p e of electrode vessel and salt bridge varies widely according to the particular use and preference of t h e investigator. A common
Η. Α. LAITINBN
τ V
FIG. 8. Bottle type calomel cell.
FIG. 9. Calomel half cell.
FIG. 10. Salt bridge with ground glass plugs.
—Sintered glass
FIG. 11. Sintered glass salt bridge.
type of calomel half cell is shown in Fig. 8. T h e bottle t y p e (Fig. 9) is convenient for potentiometric titrations. An inverted U-tube filled with saturated potassium chloride-agar gel serves as a salt bridge. H u m e and Harris (57) suggested using a long rubber t u b e with s a t u r a t e d potas
sium chloride, ending in an agar plug, as a convenient salt bridge.
Salt bridges which avoid t h e use of agar, a n d therefore are recom
mended for titrations a t elevated t e m p e r a t u r e s h a v e been described by Irving a n d Smith (58) (Fig. 10) a n d Laitinen (66) (Fig. 11). T h e former uses ground glass plugs a t b o t h ends, while t h e l a t t e r uses sintered glass ends.
Commercially available calomel electrodes which h a v e been developed for p H measurements a n d use either ground glass plugs or fiber salt bridges are convenient reference electrodes, particularly when using v a c u u m t u b e voltmeters or titrimeters where t h e cell resistance is u n i m p o r t a n t .
Other t y p e s of reference electrodes which should be mentioned are t h e silver-silver chloride electrode electrode (126) a n d t h e glass electrode (52, 74).
3.3. Methods of End Point Detection
3.3.1. The Classical Method. T h e classical method of detecting a potentiometric end point is based u p o n t h e fact t h a t a potentiometric titration curve of t h e symmetrical t y p e theoretically shows a point of inflection a t t h e equivalence point. T h e end point m a y be determined b y plotting t h e titration d a t a a n d finding t h e point of inflection, b y calculating t h e slope (dE/dv) of t h e titration curve as a function of volume and finding t h e volume corresponding t o t h e m a x i m u m slope, or b y cal
culating t h e second derivative (d2E/dv2) a n d determining t h e volume corresponding t o a zero value. F o r asymmetrical curves t h e end point is likewise t a k e n as t h e point of m a x i m u m slope, t h e titration error being neglected. An examination of Fig. 3 shows clearly t h a t for a given titra
tion t h e second derivative curve shows an a b r u p t change in sign a t t h e end point and therefore lends itself best t o an interpolation between experimentally determined points. F o r t h e most accurate results and convenient calculations, t h e increments of reagent should be m a d e small a n d equal in t h e immediate vicinity of t h e end point (23, 43, 44, 64).
Such equal additions of reagent can readily be m a d e b y a dropwise addition of reagent near t h e end point, with a calibration of t h e drop size for t h e particular b u r e t a n d reagent being used.
T o illustrate t h e application of t h e classical method, t h e following experimental results are presented in Table I for t h e t i t r a t i o n of potassium iodide with 0.01 Ν potassium p e r m a n g a n a t e in sulfuric acid solution.
I n this experiment, t h e buret reading was t a k e n at an a r b i t r a r y location near t h e end point (volume 1.67 ml.) and t h e n dropwise increments of reagent were added. Another b u r e t reading after 4 drops served t o determine t h e drop volume a n d t o establish another reference point very near t h e end point. I n this way, an end point as precise as t h e b u r e t