An incremental GraphBLAS solution for the 2018 TTC Social Media case study
M´arton Elekes
Budapest University of Technology and Economics Department of Measurement and Information Systems
Email: elekes@mit.bme.hu
G´abor Sz´arnyas
Budapest University of Technology and Economics Department of Measurement and Information Systems MTA-BME Lend¨ulet Research Group on Cyber-Physical Systems
Email: szarnyas@mit.bme.hu
Abstract—Graphs are increasingly important for modelling and analysing connected data sets. Traditionally, graph an- alytical tools targeted global fixed-point computations, while graph databases focused on simpler transactional read operations such as retrieving the neighbours of a node. However, recent applications of graph processing (such as financial fraud detection and serving personalized recommendations) often necessitate a mix of the two workload profiles. A potential approach to tackle these complex workloads is to formulate graph algorithms in the language of linear algebra. To this end, the recent GraphBLAS standard defines a linear algebraic graph computational model and an API for implementing such algorithms. To investigate its usability and efficiency, we have implemented a GraphBLAS solution for the “Social Media” case study of the 2018 Transfor- mation Tool Contest. This paper presents our solution along with an incrementalized variant to improve its runtime for repeated evaluations. Preliminary results show that the GraphBLAS-based solution is competitive but implementing it requires significant development efforts.
I. CASE STUDY
This paper presents a GraphBLAS [8] solution for the
“Social Media” case study of the 2018 Transformation Tool Contest [7]. The case study is defined using a familiar social network-like data model (Fig. 1), based on the schema of the LDBC Social Network Benchmark [5], and consists ofUsers and their Submissions. These submissions form a tree where the root node is aPostand the rest of the nodes areComments.
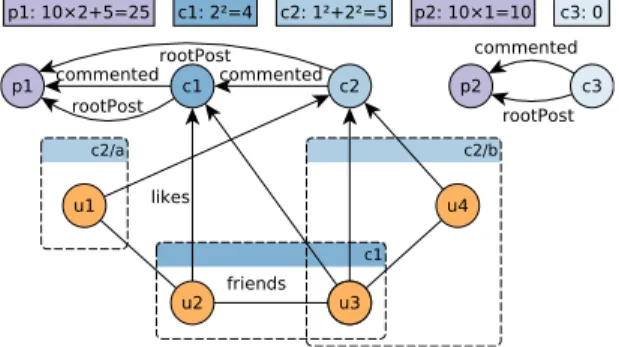
Users can like Comments and form “friends” relations with each other. Additionally, Comments have a direct pointer to the rootPostto allow quick lookups. Fig. 3a shows an example graph with two Posts (p1, p2), three Comments (c1, c2, c3) and four Users (u1, . . . , u4). Solutions are required to compute two queries, denoted as Q1 and Q2.
Fig. 1: Graph schema of the case study.
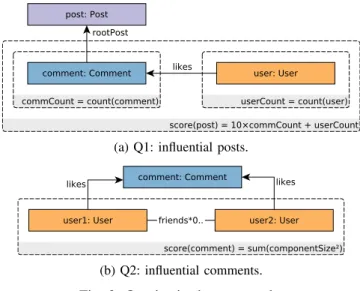
(a) Q1: influential posts.
(b) Q2: influential comments.
Fig. 2: Queries in the case study.
Q1: influential posts. Assign a score to each Post, defined as 10 times the number of their (direct or indirect)Comments plus the number of Users liking those Comments (Fig. 2a).
SortPosts according to their score and return the top 3.
Q2: influential comments.Assign a score to eachComment, based on the friendships of the Users who like that Comment(Fig. 2b). Based on the graph formed by the User nodes and their friends edges, for every comment we define an induced subgraph which contains the Users who like the Commentand their “friends” relations. The subgraph contains connected components, i.e. groups of users who know each other directly or via friends. The score is defined as the sum of squared component sizes.
Updating the graph. The case study requires solutions to perform a number of inserts in the graph and return the results of the queries on the updated graph. Insertions are performed repeatedly, which favours solutions that use incremental main- tenance techniques and avoid full recomputations.
Fig. 3 shows the initial graph and the updated graph with the result scores of Q1 and Q2.
II. THEGRAPHBLAS
A directed graph can be stored as a square adjacency matrix A∈Nn×n, where rows and columns both represent nodes of
(a) Initial graph and scores.Commentc2has two components:c2/a consists of Useru1, whilec2/b consists ofUsersu3and u4. Its total score is the sum of the component sizes, i.e.12+ 22= 5.
(b) Graph after performing an update that inserted six entities: (1) a friends edge between Users u1 and u4, (2) a likes edge from User u2 to Comment c2, (3) a Comment node c4 with (4) an outgoing rootPost edge to Post p1, (5) an outgoing commented edge to Comment c1, and (6) an incoming likes edge from User u4. The changes have increased the score ofPostp1 and resulted in Comment c2 having a single component of size 4, therefore receiving a score of 42 = 16.Commentc4got a score of12= 1.
Fig. 3: Example graphs: initial and updated versions.
the graph and cell Aij contains the number of edges from node i to node j. If the graph is undirected, the matrix is symmetric. If the graph nodes and edges have type constraints, edges are stored per type, and the rows and columns of the matrix can represent source and target nodes of edges (resp.), whose number can differ.
An undirected graph can be stored as an incidence matrix B∈ {0,1}n×m, where rows and columns represent nodes and edges (resp.). Each column contains 1 for the source and the target vertex of the edge, otherwise0.
GraphBLAS is a recently proposed standard built on the theoretical framework of matrix operations on arbitrary semir- ings [8], which allows defining graph algorithms in the lan- guage of linear algebra. The goal of GraphBLAS is to create a layer of abstraction between the graph algorithms and the graph analytics framework, separating the concerns of the algorithm developers from those of the framework developers and hardware designers. The GraphBLAS standard defines a C API that can be implemented on a variety of hardware components (including GPUs and FPGAs).
GraphBLAS stores graphs as sparse matrices which contain
GraphBLAS method name notation
GrB_mxm matrix-matrix multiplication ChMi=A⊕.⊗B GrB_vxm vector-matrix multiplication wThmTi=uT⊕.⊗A GrB_mxv matrix-vector multiplication whmi=A⊕.⊗u GrB_eWiseAdd element-wise, ChMi=A⊕B
set union whmi=u⊕v
GrB_eWiseMult element-wise, ChMi=A⊗B
set intersection whmi=u⊗v
GrB_extract extract submatrix ChMi=A(I,J) extract subvector whmi=u(I) GrB_apply apply unary operator ChMi=f(A)
whmi=f(u) GxB_select apply select operator ChMi=f(A, k)
whmi=f(u, k) GrB_reduce reduce to vector whmi= [⊕jA(:, j)]
reduce to scalar s= [⊕ijA(i, j)]
GrB_transpose transpose ChMi=AT GrB_build matrix from tuples C 7→ {hi, j, Ciji}
vector from tuples w 7→ {hi, wii}
GrB_extractTuples extracthi, j, Aijituples {hi, j, Aiji} 7→ A extracthi, uiituples {hi, uii} 7→ u
TABLE I: Notation of the GraphBLAS operations used in this paper (based on [3]). MatrixAcontains scalar elementsAij, vector u contains scalar elements ui, i and j are row and column indices,I andJ are subset of indices, ⊕ and⊗are addition and multiplication operators of an arbitrary semiring, maskhMiis used to selectively write to the result.
elements as hi, j, Aiji tuples. An optional mask can be used for operations, which limits the evaluation to the non-empty positions of the mask. Table I contains the list of GraphBLAS operations used in this paper.
III. SOLUTION
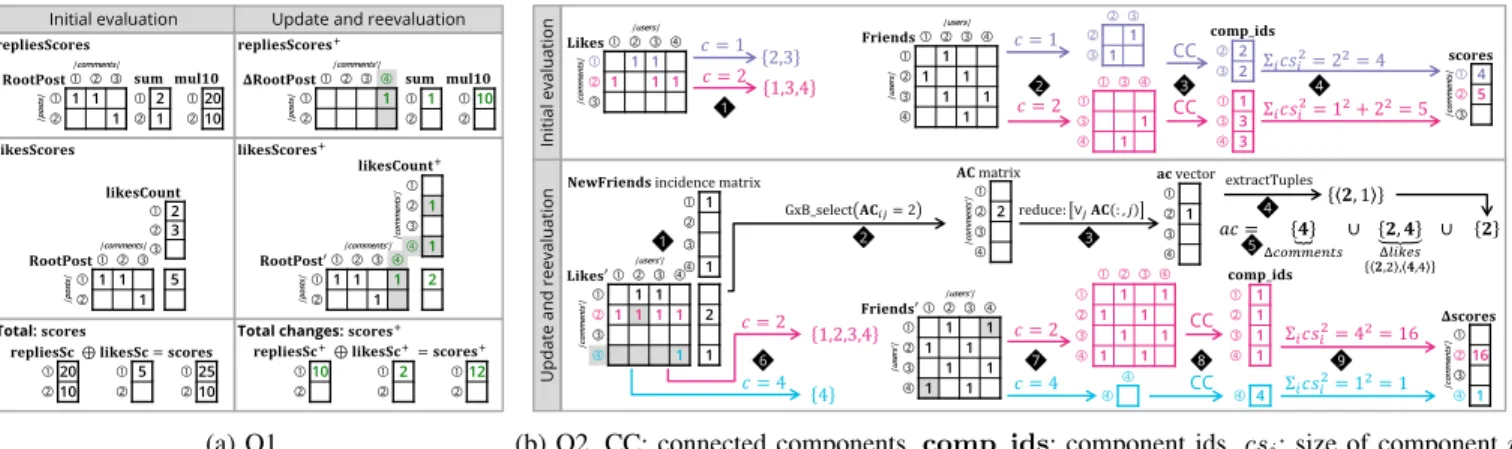
Q1 Batch. Alg. 1 computes the score for every post, then selects the top 3 posts. In Line 6 row-wise summation of RootPostmatrix produces the number of comments per post, then aGrB_apply operation multiplies the vector elements by 10. Line 8 sums up the number of likes the post has via its comments. For each post, theRootPostadjacency matrix selects the cells oflikesCount vector corresponding to the comments of the post, then sums up the values. The score for each post is the element-wise sum of the vectors (Line 9).
Fig. 4a shows an example calculation.
Algorithm 1 Calculate scores of query 1
1: Input
2: RootPost∈B|posts|×|comments| .adjacency matrix 3: likesCount∈N|comments| .# of incominglikes 4: Output
5: scores∈N|posts|
6: sum←
⊕jRootPost(:, j)
.row-wise sum 7: repliesScores←10×sum .apply mul-by-10 op.
8: likesScore←RootPost⊕.⊗likesCount 9: scores←repliesScores⊕likesScore 10: returnscores
Q1 Incremental.To incrementally evaluate Q1, Alg. 2 updates the scores for next evaluations and returns the posts with new scores. Merging the previous top 3 scores and the new ones yields the new result (new scores overwrite existing ones).
Lines 9 and 10 compute the increment of the score induced by new comments. In Line 11 the number of likes the comments
𝐑𝐨𝐨𝐭𝐏𝐨𝐬𝐭 |comments|
|posts|1 1
1
𝐥𝐢𝐤𝐞𝐬𝐂𝐨𝐮𝐧𝐭
2
3
𝐑𝐨𝐨𝐭𝐏𝐨𝐬𝐭′ |comments’|
|posts|1 1 1
1
𝐬𝐮𝐦
2
1 𝐦𝐮𝐥𝟏𝟎
20
10
𝐑𝐨𝐨𝐭𝐏𝐨𝐬𝐭 |comments|
|posts|1 1
1 5
𝐥𝐢𝐤𝐞𝐬𝐂𝐨𝐮𝐧𝐭+
|comments’|
1
1 2
𝐦𝐮𝐥𝟏𝟎
10
𝐬𝐮𝐦
1
𝚫𝐑𝐨𝐨𝐭𝐏𝐨𝐬𝐭 |comments’|
|posts| 1
𝐫𝐞𝐩𝐥𝐢𝐞𝐬𝐒𝐜 ⊕ 𝐥𝐢𝐤𝐞𝐬𝐒𝐜 = 𝐬𝐜𝐨𝐫𝐞𝐬
20 5 25
10 10 Initial evaluation 𝐫𝐞𝐩𝐥𝐢𝐞𝐬𝐒𝐜𝐨𝐫𝐞𝐬
𝐥𝐢𝐤𝐞𝐬𝐒𝐜𝐨𝐫𝐞𝐬
Total: 𝐬𝐜𝐨𝐫𝐞𝐬
𝐫𝐞𝐩𝐥𝐢𝐞𝐬𝐒𝐜+⊕ 𝐥𝐢𝐤𝐞𝐬𝐒𝐜+= 𝐬𝐜𝐨𝐫𝐞𝐬+
10 2 12
Update and reevaluation 𝐫𝐞𝐩𝐥𝐢𝐞𝐬𝐒𝐜𝐨𝐫𝐞𝐬+
𝐥𝐢𝐤𝐞𝐬𝐒𝐜𝐨𝐫𝐞𝐬+
Total changes: 𝐬𝐜𝐨𝐫𝐞𝐬+
(a) Q1.
Initial evaluation 𝐋𝐢𝐤𝐞𝐬
|users|
|comments| 1 1
1 1 1
2,3 1,3,4 𝑐 = 1 𝑐 = 2
𝐅𝐫𝐢𝐞𝐧𝐝𝐬 |users|
|users|
1
1 1
1 1
1
1
1
1
1 𝑐 = 1 𝑐 = 2
𝐜𝐨𝐦𝐩_𝐢𝐝𝐬
2
2
1
3
3 CC CC
Σ𝑖𝑐𝑠𝑖2= 22= 4 Σ𝑖𝑐𝑠𝑖2= 12+ 22= 5
𝐬𝐜𝐨𝐫𝐞𝐬
|comments|4
5
𝐋𝐢𝐤𝐞𝐬′ |users’|
|comments’| 1 1
1 1 1 1
1
2 1 𝐍𝐞𝐰𝐅𝐫𝐢𝐞𝐧𝐝𝐬 incidence matrix
1
1
GxB_select 𝐀𝐂𝑖𝑗= 2
𝐚𝐜 vector
1
reduce: ∨𝑗𝐀𝐂 : , 𝑗
extractTuples 𝟐, 1
𝑐 = 4 𝑐 = 2 𝐅𝐫𝐢𝐞𝐧𝐝𝐬′ |users’|
|users’|
1 1
1 1
1 1
1 1
1 1
1 1
1 1
1 1 CC
CC
4
Σ𝑖𝑐𝑠𝑖2= 42= 16 Σ𝑖𝑐𝑠𝑖2= 12= 1
𝚫𝐬𝐜𝐨𝐫𝐞𝐬
|comments’|
16
1 𝐜𝐨𝐦𝐩_𝐢𝐝𝐬
1
1
1
1
Update and reevaluation
𝐀𝐂 matrix
|comments’|
2
1,2,3,4 4 𝑐 = 2 𝑐 = 4
𝑎𝑐 = ด𝟒
Δ𝑐𝑜𝑚𝑚𝑒𝑛𝑡𝑠
∪ 𝟐, 𝟒
Δ𝑙𝑖𝑘𝑒𝑠 𝟐,2 , 𝟒,4
∪ 𝟐
1 2 3
4 5
6 7 8 9
1
2 3 4
(b) Q2. CC: connected components,comp ids: component ids,csi: size of componenti.
Fig. 4: Execution of the algorithms on the example graph: initial evaluation and incremental maintenance. Recall that the update in the example inserts the following relevant entities (highlighted with grey background): a friendsedge betweenUsers u1 and u4, a likes edge fromUser u2 toComment c2, a Comment nodec4 with an outgoing rootPost edge toPost p1 and an incominglikes edge from Useru4.
newly received are summed up per post. Two types of incre- ments are summed up in Line 12. For subsequent evaluations the scores are updated using the increment vector (Line 13). To find the top 3 scores only the previous maximum values and the posts with updated scores are considered. Line 14 yields the score values which changed by assigning the scores0 vector via the scores+ increment vector as a mask, which allows values in the result only if the mask has a value at the corresponding position. Fig. 4a shows an example calculation.
Algorithm 2 Update scores of query 1
1: Input
2: scores∈N|posts
0| .previous scores
3: likesCount+∈N|comments
0| .new incominglikes 4: ∆RootPost∈B|posts
0|×|comments0| .newrootPostedges
5: RootPost0∈B|posts
0|×|comments0| .allrootPostedges
6: Output
7: ∆scores∈N|posts
0| .only changed scores
8: scores0∈N|posts
0| .all scores
9: sum←
⊕j∆RootPost(:, j)
.# of new comments 10: repliesScores+←10×sum
11: likesScore+←RootPost0⊕.⊗likesCount+
12: scores+←repliesScores+⊕likesScore+ .score increment 13: scores0←scores⊕scores+ .update scores 14: ∆scoreshscores+i ←scores0 .updated scores where changed 15: return∆scores,scores0
Q2 Batch.The batch evaluation of Q2 is depicted in the upper part of Fig. 4b. The algorithm computes the score for every comment, then selects the top 3 comments. To collect the users of each subgraph, Step 1 extracts the elements of Likes matrix as hc, u,1i tuples and collects them into sets of user IDs (u) per comment (c). To produce the subgraph, for each comment Step 2 extracts a submatrix based on the users selected. Step 3 finds connected components in the subgraph using the FastSV algorithm [11] of the LAGraph library [9].
This produces a vector containing the component id for every user. Step 4 yields the squared sum of component sizes, i.e.
the score for each comment.
Q2 Incremental. The incremental evaluation of Q2 is de- picted in the lower part of Fig. 4b. The algorithm returns the comments with new scores (∆scores) by reevaluating the comments which the updates might impact on. Merging the previous top 3 scores and the new ones yields the new result (new scores overwrite existing ones). The first phase of the algorithm (Steps 1 – 5 ) collects the comments which might be affected by the updates (ac set), then the second phase (Steps 6 – 9 ) computes the new scores of these comments using the batch algorithm already mentioned.
A comment might be affected by an update if (1) it is a new comment, (2) the comment receives a new incoming likes edge from a user, resulting in a new component or the expansion of an existing one, or (3) two users who like the comment become friends, which merges the components the users belong to (if the components differ). Step 5 collects the IDs of these comments.
Steps 1 – 4 compute the comments which might be affected by newfriendsedges.NewFriendsincidence matrix represents each new friendship by a column having two 1-valued cells for the two users. For every new friendship (i.e.
pair of users) Step 1 computes how many user of the pair likes each comment (0, 1, or 2). During the matrix-matrix multiplication each new column of friendships selects two columns ofLikes0 matrix and sums them up intoACmatrix.
Step 2 keeps only 2-valued cells, i.e. where both users of a friendship liked the comment, so they are present in the subgraph and the new friendship might merge components.
Then Step 3 produces a row-wise sum usingbinary oroper- ation. Step 4 extractshc,1ituples from the result vector and collects the comment IDs from these tuples. Step 5 collects all the comments which might be affected by the update. The next steps reevaluate the scores of these comments.
IV. EVALUATION
To evaluate the performance and scalability of our solution, we have used the benchmark framework of the case study [7].
Q1 Q2
Load and initial evaluationUpdate and reevaluation
1 2 4 8 16 32 64 128 256 5121024 1 2 4 8 16 32 64 128 256 5121024 0.01
0.1 1 10 100
0.001 0.01 0.1 1 10 100
Graph size
Execution time [s]
Tool GraphBLAS Batch GraphBLAS Incremental
GraphBLAS Batch (8 threads) GraphBLAS Incremental (8 threads)
NMF Batch NMF Incremental
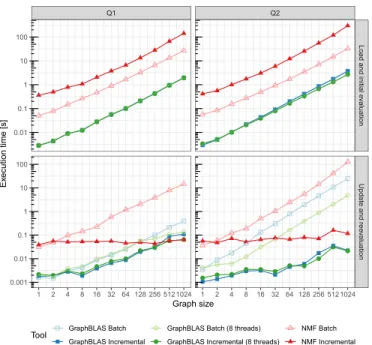
Fig. 5: Execution times of the queries with respect to the graph sizes in the load and initial evaluation, and the update and reevaluationphases. Both axes are logarithmic.
1 2 4 8 16 32 64 128 256 512 1024
#nodes 1274 2071 4350 7530 15k 30k 58k 115k 225k 443k 859k
#edges 2533 4207 9118 18k 35k 71k 143k 287k 568k 1.1M 2.3M
#inserts 67 120 132 104 110 117 68 86 45 112 74
TABLE II: Graph sizes w.r.t. to the scale factor.
Our GraphBLAS solution was implemented using Suite- Sparse:GraphBLAS [3]. The complete solution consists of approx. 1100 lines of C++ of code and is available open- source1. As a performance baseline, we used the reference implementation of the case study, written in the .NET Model- ing Framework [6] (NMF Batch) and its incremental version (NMF Incremental). As described in Sec. III, we have imple- mented two variants: GraphBLAS Batch always performs a full evaluation, whileGraphBLAS Incrementalperforms a full evaluation during the first step, then switches to incremental maintenance for the subsequent steps. We compared single- and multi-threaded performance of our GraphBLAS solution using 8 threads for the latter. The GraphBLAS implementation we used has built-in parallelization of the operators [1], addi- tionally, we parallelized Q2 using OpenMP constructs at the granularity of comments. We ran the benchmark on synthetic graphs of increasing sizes following powers of 2. The elements in the graphs follow the Facebook-like distribution enforced by the LDBC Datagen [5]). For each graph, the number of nodes/edges and the number of inserted elements are shown in Table II. We ran the computation on each graph size 5 times and report the geometric mean value of these runs.
1https://github.com/TransformationToolContest/ttc2018liveContest/
We executed the benchmark on a cloud virtual machine with a 24-core IntelR XeonR Platinum 8167M CPU with Hyper Threading at 2.00 GHz, 320 GB RAM, and HDD storage.
The machine was running the Ubuntu 18.04 operating system, and the .NET Core 3.1.100 runtime. The GraphBLAS solu- tion was using SuiteSparse:GraphBLAS 3.2.0draft20 compiled with GCC/G++ 7.4.0.
The execution times are shown in Fig. 5. Both tools scale similarly for the load and initial evaluation phase. Graph- BLAS is the fastest, while the incremental NMF variant is the slowest as it initially builds a dependency graph from the query to assist incremental change propagatation. During theupdate and reevaluation, both tools gain significant performance benefits from incrementalization as they scale better for large graph sizes. GraphBLAS has similar execution times for Q1 as NMF, and outperforms NMF for Q2. Parallel processing of updates in GraphBLAS has a small performance gain for the incremental version as the updates are small. However, for GraphBLAS Batch, the difference is half of an order of magnitude in favour of the parallel version as it requires a costly recomputation over the whole graph, which negates the parallelization overhead.
V. CONCLUSION ANDFUTUREWORK
This paper presented a linear algebraic solution for the
“Social Media” case study of the 2018 Transformation Tool Contest. While the presented solution already exhibits good performance and scalability compared to the reference im- plementation, a number of optimizations could be applied as future work: (1) using updatable compressed matrix rep- resentation formats such as faimGraph [10] or Hornet [2]
and (2) running an incremental connected components al- gorithm [4] in Step 8 of Q2. Additionally, it would be interesting to investigate the performance of the solution in the presence of more realistic update operations, including both insertions and removals.
REFERENCES
[1] M. Aznaveh et al. Parallel GraphBLAS with OpenMP. InCSC at PP.
SIAM, 2020.
[2] F. Busato et al. Hornet: An efficient data structure for dynamic sparse graphs and matrices on GPUs. InHPEC. IEEE, 2018.
[3] T. A. Davis. Algorithm 1000: SuiteSparse:GraphBLAS: Graph algo- rithms in the language of sparse linear algebra. ACM TOMS, 2019.
[4] D. Ediger et al. Tracking structure of streaming social networks. In IPDPS, pages 1691–1699. IEEE, 2011.
[5] O. Erling et al. The LDBC Social Network Benchmark: Interactive workload. InSIGMOD, pages 619–630, 2015.
[6] G. Hinkel. NMF: A multi-platform modeling framework. InICMT, 2018.
[7] G. Hinkel. The TTC 2018 Social Media case. InTTC at STAF, 2018.
[8] J. Kepner et al. Mathematical foundations of the GraphBLAS. InHPEC, 2016.
[9] T. Mattson et al. LAGraph: A community effort to collect graph algorithms built on top of the GraphBLAS. InGrAPL at IPDPS, 2019.
[10] M. Winter et al. faimGraph: High performance management of fully- dynamic graphs under tight memory constraints on the GPU. In SC.
IEEE / ACM, 2018.
[11] Y. Zhang, A. Azad, and Z. Hu. FastSV: A distributed-memory connected component algorithm with fast convergence. InPP. SIAM, 2020.