https://doi.org/10.24867/GRID-2018-p16 Original scientific paper
QUALITY PERFORMANCE TESTING FOR BASE PAPER OF CORRUGATED PAPERBOARD BY DSC METHOD
Barnabás Tóth
1, László Koltai
2, Péter Böröcz
31
Óbuda University, Doctoral School on Materials Sciences and Technologies, Hungary
2
Óbuda University, Rejtő Sándor Faculty of Light Industry and Environmental Protection Engineering, Budapest, Hungary
3
Széchenyi István University, Department of Logistics and Forwarding,
Győr, Hungary Abstract: Using a suitable paper quality of packaging structures is an element process in the packaging industry, mainly on producing corrugated paperboards. (Robertson, 2012) The base-papers are the most significant constituent of Corrugated Cardboards, contain mainly organic substances (e.g. cellulose, hemicellulose and lignin etc.) which are appropriate for thermo-analytical studies. The quality of the base-papers mainly defined by the primer cellulose, recycled paper and other incrust materials content. At the same time, it is difficult for users to precisely separate base papers that exhibit differences in mechanical and quality properties, as their ulterior identification is virtually impossible. (Holmberg et al, 1995) The testing methods such as CCT, RCT, FCT, COBB, bursting etc. are supported by statistical technique, but do not provide perfectly accurate results. (Caulfield et al, 1988) The reason is the deviation of testing results.In this paper, we publish the primary results of the thermoanalytical research for determination of different paper types. Applying a Differental Scanning Calorimetries (DSC) method, it is possible to study endotherm and exotherm spectrums of paper’s raw materials. During a heating process each component react in different ways, both of their physical and chemical characteristic. Due to their various organic substances content, these values are different referring for similar results of the finished products, which determines their mechanical and quality properties during their use (Soares et al, 1995). The results show that this method on the one hand can be helpful to testing the paper during packaging producing process on the other hand after using as a packaging. Using a DSC apparatus helps showing the differences between the various organic substances, which allow to measure obvious and exact results for each base-paper. This test method can help classify base paper types in a simple and transparent manner and be of use in tracing quality problems of papers.
Key words: corrugated cardboard, base-paper, cellulose, thermo-analytical technique, heatflow, DSC
1. INTRODUCTION
The main chemical components of the base papers using for corrugated board are cellulose, hemicellulose and lignin. This finished material involves other incrust materials and extenders which constitute a complex chemical system (Soares et al, 1995). Knowing the exact components of corrugated cardboard papers are elementary for industrial processes and for consumers, because the mechanical and physical properties of these paper-based packaging, based on the chemical structure of it (Robertson, 2012). The thermo- analytical scanning calorimetry (DSC) analysers allows the identification of each substances according to it’s natural origins which behaves on different ways during the test. Physical and chemical properties of each component can paraphrase accurately the investigated paper, independently from the condition of papers and effects of the environment on it. Contrary to currently used test methods (CCT, RCT, FCT, COBB etc.) can provide reproducible test results from the same samples (Caulfield et al, 1988).
2. THERMO-ANALYTICAL DSC METHOD
Using a DSC (Differential Scanning Calorimetry) apparatus is type of the Thermo-analytical test methods.
The DSC measures the physical and chemical changes as a function of temperature. The thermal analysis provides information for the typify temperature peaks, which refer to characterization changes for each components. On the other hand derivative values proportional to the quantity of the transformed material, can be obtained (Haines, 2012). The method based on energy changes which can be monitored occurring in a given component during the heating and temperature keeping or cooling period. The test can measure the heat flow differences between the sample and the reference jars due to absorbed and released heat in function of temperature. In the most widespread DSC equipment a constant heating rate is used, and the
heat flow differential between the sample and the reference material is registered as a temperature differential ratio. The formula for the measure heat flow is shown below:
𝑑𝑑𝑑𝑑
𝑑𝑑𝑑𝑑 = 𝐶𝐶𝑝𝑝𝑑𝑑𝑇𝑇
𝑑𝑑𝑑𝑑 +𝑓𝑓(𝑇𝑇,𝑡𝑡) (1)
where dH/dt is DSC heat flow signal
Cp is a sample heat capacity (heat specific x weight) dT/dt is heating rate
f (T,t) is heat flow that function of time at an absolute temperature (kinetic)
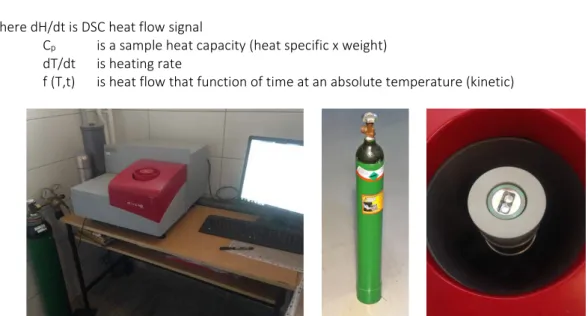
Figure 1: DSC equipment apparatus, its test cell and nitrogen tank
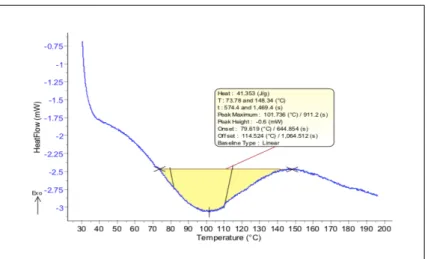
During the test a differential thermal analysis curve of the sample is recorded, where the abscissa represents temperature or time, with the heat flow (set according to the exothermic or endothermic nature of the change) shown on the ordinate. For example, Figure 2 shows the characteristic curve of a high cellulose content paper’s examination result.
The temperature at which a transformation takes place (initial temperature) is shown by the intersection of the extension of the base line and the tangent to the inflexion point. The conclusion of the temperature dependent transformation is shown by the peak of the curve.
Figure 2: DSC curves of pure cellulose
The enthalpy of the transformation is proportional to the area between the curve and the baseline (the correct ratio can be defined through measuring a known material). Through the post-measurement analysis the temperature interval, peak temperature, heat flow, and heat in ratio of mass for the transformation can be expressed.
Figure 3: A sample DSC curve at the measurement of a paper sample
3. MEASUREMENT AND ANALYSIS
For the series of measurements 5 different materials are tested, pure cotton, soft wood sulphite pulp, “Kraft liner” base paper, filler material I., filler material II.
Table 1: Tested materials list with specific properties.
Tested material Source Content
Pure Cotton
Natural cotton treated with
NaOH Cellulose
Soft wood Sulphite pulp
Pine treated by sulphite
method
Cellulose, hemicellulose, lignin
“Kraft liner” base paper
Pine treated by sulphate method
Cellulose, hemicellulose, lignin & inorganic
components Filler material I. Mined
minerals Kaolin
Filler material II. Mined
Minerals CaCO3
3.1 Test procedure
1. Preparation of test samples 8-20 mg sample take place in 30 μl jar, which exact weight measure with precision mg weight measurement apparatus.
2. A reference jar and a jar filled with the sample have to be placed into the Setaram DSC measuring device.
3. A predefined test program have to be performed.
4. Using nitrogen purge during examination.
a. Heating the test chamber of the measuring device to 30°C and keeping it at this temperature
for 10 minutes.
b. Heating the test chamber up to 540°C at a rate of 10K/min.
c. Recording temperature differentials between the sample to be examined and the reference jar.
d. Analysing the data on the basis of peak temperatures and heat flow.
5. Performing the measurement on 5 samples per base paper and presenting the results obtained and their averages graphically.
4. RESULTS AND DISCUSSION
Table 2: DSC results of the tested materials
Tested materials Avg. T max [°C]
endothermic T max [°C]
exothermic Heatflow
[mW] Mass
[mg]
Pure Cotton Avg. 350 400 38 9,8
Soft wood
Sulphite pulp Avg. 275 400 65 12
“Kraft liner” base
paper Avg. 325 370 20 11
Filler material I. Avg. 500 - - 20,24
Filler material II. Avg. 490 - - 20,24
As the results show in Table 2. Most measured temperature peaks belong to endotherm and exothermal processes refer to the tested materials. In case of pure cotton shows accurate temperature peak at 350 °C as a specific endotherm peak and shows another peak at 400 °C as an exothermal. The Soft wood Sulphite pulp behave under the test nearly identically, produced same peaks endo- and exothermal at 275°C and 400°C. The examination adverts to “Kraft liner” base paper at 325°C as an exothermal and 370°C as a endotherm result. In the table are several dates are missing because it was not detected any exothermic maximum and heat flow value. The tested material with a higher cellulose content resolved on higher temperature on about 400°C and its thermal degradation starts at a higher temperature than the hemicellulose and lignin contain pulp. Results can be explained the structural different between the cellulose and hemicellulose. The cellulose it is a longer and more pure polysaccharide chain molecule than the hemicellulose which is a shorter polysaccharide and it is contained different hexoses and pentoses. And The studied extenders mined minerals (kaolin & CaCO3) show no significant temperature peaks or thermal degradation in this examination range.
5. CONCLUSIONS
Table 3: Test zones with temperature range, peaks and reaction types Zones Temperature range
[°C] Temperature peaks
[°C] Reaction types
I. 0-100°C 100°C Chemically bound
water leaving
II. 100-250°C 250°C
Decomposition of extractable
materials
III. 250-350°C 275°C Decomposition
IV. 350-550°C 325°C & 350°C;
400°C Decomposition
V. Over 550°C Decomposition
Results can be explained that at lower temperature, the samples behave on similar way, mainly the chemically bonded water leave from each materials (Saher et al, 2011; Yang, Yan, Chen Et al, 2006). At higher temperature between 200 to 400 °C decomposition of extractable materials shown due to weight loss processes with different temperature peaks (Saher et al, 2011). In case of “Kraft liner” base paper the decomposition starts at 250°C and has its temperature peak at 325°C. Pure cellulose starts to decompose at 275°C and lasts until 350°C. The soft wood sulphite pulp starts decomposition at 220°C and it has its own temperature peak at 400°C hemicellulose and lignin behave nearly similar way in the examined temperature range. Extenders show no significant endotherm or exothermal changes under the test (Haiping et al, 2006).
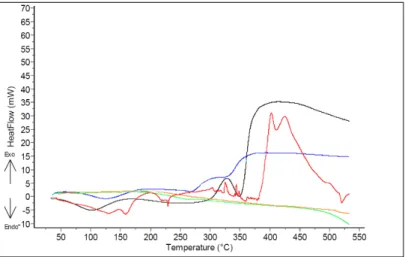
Figure 4: DSC curves of pure cotton-black, Soft wood sulphite pulp-red, Kraft liner base paper-blue, kaolin-green and CaCO3 with brown colour
Table 4 shows the various DSC curves summarize on which the differences between the results of tested materials are shown. The reactions based on the content of cellulose. Materials which contain greater amount of cellulose, their cellulose molecules start its decomposition under a shorter range of the test-in opposite of lower cellulose content-and shown their typify temperature peaks by the results of the end of an exothermal reaction chain, which lead to its total charring. (Haiping et al, 2006; Yang et al, 2006).
This conclusion can explain the results of the examined materials and shown its main differences and coherences in substances, which can be used for an accurate thermo-analytical identification independently from its multiple chemical components.
7. REFERENCES
[1] Caulfield, D. F., Gunderson, D. E.: "Paper testing and strength characteristics", The 1988 paper preservation symposium, 1988 October 19-21 (Wahsington, DC. Atlanta, GA, 1988), pages 31-40.
[2] Haines, P. J.: “Thermal methods of analysis, principles, applications and problems”, Journal of Thermal Analysis, 45(1-2), 1995. doi: 10.1007/BF02548698
[3] Haiping, Y., Hanping, C., Chuguang, Z.: “Characteristics of hemicellulose, cellulose and lignin pyrolysis”, Fuel, 86(12-13), 1781-1788, 2007. doi: 10.1016/j.fuel.2006.12.013
[4] Holmberg, M., Winquist, F., Lundström, I., Gardner, J. W., & Hines, E. L.,: “Identification of paper quality using a hybrid electronic nose”, Sensors and Actuators B Chemical, 27(1-3), 246- 249, 1995.
doi: 10.1016/0925-4005(94)01595-9
[5] Robertson, G. L.: "Paper and paper-based packaging materials. Food packaging, principles and practice”, 3rd ed, (CRC Press, Boca Raton, 2012).
[6] Saher, F. I., El-Amoudy, E. S., Shady, K. E.: “Thermal Analysis and Characterization of some Cellulosic Fabrics Dyed by a New Natrual Dye and Mordanted with Different Mordants”, International Journal of Chemistry, 3(2), 40-54, 2011. doi: 10.5539/ijc.v3n2p40
[7] Soares, S., Camino, G., Levchik, S.,: “Comparative study of the thermal decomposition of pure cellulose and pulp paper”, Polymer Degradation and Stability, 49(2), 275-283, 1995.
doi: 10.1016/0141-3910(95)87009-1
[8] Tsujiyama, S., Miyamori, A.: “Assignment of DSC thermograms of wood and its components”, Thermochimica Acta, 351(1-2), 177-181, 2000. doi: 10.1016/S0040-6031(00)00429-9 [9] Yang, H., Yan, R., Chen H., Zheng, C., Lee, D.H., Liang, D.T.: “In-depth investigation of biomass
pyrolysis based on three major components: hemicellulose, cellulose and lignin”, Energy & Fuels, 20(1), 2005. doi: 10.1021/ef0580117
© 2018 Authors. Published by the University of Novi Sad, Faculty of Technical Sciences, Department of Graphic Engineering and Design. This article is an open access article distributed under the terms and conditions of the Creative Commons Attribution license 3.0 Serbia
(http://creativecommons.org/licenses/by/3.0/rs/).