Constraining the Primordial Lithium Abundance: New Cross Section Measurement of the
7Be + n Reactions Updates the Total
7Be Destruction Rate
S. Hayakawa1 , M. La Cognata2 , L. Lamia2,3,4 , H. Yamaguchi1,5 , D. Kahl6,19 , K. Abe1, H. Shimizu1, L. Yang1,20, O. Beliuskina1,21, S. M. Cha7,22, K. Y. Chae7, S. Cherubini2,3, P. Figuera2, Z. Ge8,21, M. Gulino2,9, J. Hu10, A. Inoue11, N. Iwasa12 , A. Kim13, D. Kim13,22, G. Kiss8,23, S. Kubono1,8,10 , M. La Commara14,15, M. Lattuada2,3, E. J. Lee7, J. Y. Moon16, S. Palmerini17,18 , C. Parascandolo15, S. Y. Park13,24, V. H. Phong8,25, D. Pierroutsakou15, R. G. Pizzone2 , G. G. Rapisarda2,
S. Romano2,3,4, C. Spitaleri2,3, X. D. Tang10, O. Trippella17,18, A. Tumino2,9, and N. T. Zhang10
1Center for Nuclear Study, University of Tokyo, RIKEN Campus, 2-1 Hirosawa, Wako, Saitama 351-0198, Japan;hayakawa@cns.s.u-tokyo.ac.jp
2Istituto Nazionale di Fisica Nucleare—Laboratori Nazionali del Sud, Via S. Sofia 62, I-95123 Catania, Italy
3Department of Physics and Astronomy“Ettore Majorana,”University of Catania, Via S. Sofia 64, I-95123 Catania, Italy
4Centro Siciliano di Fisica Nucleare e Struttura della Materia, CSFNSM, Catania, Italy
5National Astronomical Observatory of Japan, Mitaka, 181-8588 Tokyo, Japan
6School of Physics and Astronomy, University of Edinburgh, J.C. Maxwell Bldg., P.G. Tait Rd., Edinburgh EH9 3FD, UK
7Department of Physics, Sungkyunkwan University, 2066, Seobu-ro, Jangan-gu, Suwon 16419, Republic of Korea
8RIKEN Nishina Center, 2-1 Hirosawa, Wako, Saitama 351-0198, Japan
9Faculty of Engineering and Architecture, Kore University of Enna, Cittadella Universitaria, I-94100 Enna, Italy
10Institute of Modern Physics, Chinese Academy of Sciences, Nanchang Road 509, Lanzhou 730000, Peopleʼs Republic of China
11Research Center for Nuclear Physics, Osaka University, 10-1 Mihogaoka, Ibaraki, Osaka 567-0047, Japan
12Department of Physics, Tohoku University, 6-3 Aramaki-Aza-Aoba, Aoba, Sendai, Miyagi 980-8578, Japan
13Department of Physics, Ewha Womans University, 52, Ewhayeodae-gil, Seodaemun-gu, Seoul 03760, Republic of Korea
14Department of Physics’E. Pancini’, University of Naples Federico II, Complesso Universitario di Monte S. Angelo, Via Cintia, 21-80126 Naples, Italy
15Istituto Nazionale di Fisica Nucleare—Section of Naples, Complesso Universitario di Monte S. Angelo, ed. 6, Via Cintia, I-80126 Naples, Italy
16Rare Isotope Science Project, Institute for Basic Science, 70, Yuseong-daero 1689-gil, Yuseong-gu, Daejeon 305-811, Republic of Korea
17Istituto Nazionale di Fisica Nucleare—Section of Perugia, Via A. Pascoli, I-06123 Perugia, Italy
18Department of Physics and Geology, University of Perugia, Via A. Pascoli, I-06123 Perugia, Italy Received 2021 March 22; revised 2021 May 14; accepted 2021 May 27; published 2021 July 1
Abstract
The cosmological lithium problem(CLP)stems from the outstanding discrepancy between theoretical predictions and astronomical observations of primordial lithium abundances. For the radiogenic production of7Li,7Be plays a pivotal role in the Big Bang nucleosynthesis (BBN). Nevertheless, the data for neutron-induced 7Be destruction processes were still sparse, and especially lacked information on the contributions of transitions to the7Li excited states. In this work, we have determined the7Be(n p, 0)7Li,7Be(n p, 1)7Li*, and7Be(n,a)4He reaction cross sections by means of the Trojan Horse method. The present and the previous data were analyzed together by a multichannel R-matrixfit, providing an improved uncertainty evaluation of the(n p, 0)channel and thefirst-ever quantification of the(n p, 1)contribution in the BBN-relevant energy range. We implemented the revised total reaction rate summing both the(n p, 0)and(n p, 1)contributions in a state-of-the-art BBN codePRIMAT. As a consequence, the present nuclear-physics data offers a reduction of the predicted7Li abundance by about one-tenth, which would impose a stricter constraint on BBN and head us in the correct direction to the CLP solution.
Unified Astronomy Thesaurus concepts:Big Bang nucleosynthesis(151);Nuclear reaction cross sections(2087); Nuclear abundances(1128)
1. Introduction
Big Bang nucleosynthesis(BBN; Cyburt et al.2016; Coc &
Vangioni 2017; Pitrou et al. 2018) is a critical probe to understand the early universe, describing the primordial production of light nuclides such as 4He, D, 3He, and 7Li.
The global agreement between the BBN predictions at the known baryon-to-photon number ratio(Ade et al.2016; Pitrou et al. 2018) and the observations of galactic halo objects (Cyburt et al.2016)is one of the few crucial pieces of evidence of the Big Bang. Nevertheless, the7Li/H abundance remains overestimated by a factor of 3–4, known as the cosmological lithium problem (CLP), which is still an open issue to be challenged by astronomy, nuclear physics, and nonstandard cosmology (Fields 2011). From the nuclear-physics point of view, the primordial radiogenic 7Li abundance strongly depends on the 7Be production and destruction process since
7Li formed during BBN may easily be destroyed by the 7Li p,a4
( ) He reaction, while 7Be will eventually decay into 7Li
© 2021. The American Astronomical Society. All rights reserved.
19Present address: Extreme Light Infrastructure–Nuclear Physics, Horia Hulubei National Institute for R&D in Physics and Nuclear Engineering (IFIN-HH), 077125 Bucharest-Măgurele, Romania.
20Present address: China Institute of Atomic Energy, P.O. Box 275(10), Beijing 102413, China.
21Present address: Department of Physics, University of Jyväskylä, P.O. Box 35, FI-40014 University of Jyväskylä, Finland.
22Present address: Center for Exotic Nuclear Studies, Institute for Basic Science, 55, Expo-ro, Doryong-dong, Yuseong-gu, Daejeon 34126, Republic of Korea.
23Present address: Institute for Nuclear Research(Atomki), H-4032 Debrecen, Bem ter 18/c, Hungary.
24Present address: Center for Underground Physics, Institute for Basic Science, 55, Expo-ro, Doryong-dong, Yuseong-gu, Daejeon 34126, Republic of Korea.
25Present address: Faculty of Physics, VNU University of Science, 334 Nguyen Trai, Thanh Xuan, 120062 Hanoi, Vietnam.
via the electron capture after BBN ends. A nuclear-physics solution to the CLP is, however, considered to have little hope (Coc & Vangioni 2017)—as long as the relevant nuclear data are valid.
There is indeed a new discovery by Damone et al. (2018) that a direct measurement of the main7Be destruction process
7Be(n p, )7Li with a wide-spectrum neutron beam revised the cross sections upward from the previous direct data by Koehler et al.(1988), which were widely used in BBN calculations, and thus led the 7Li/H value downward. Another direct measure- ment by Tomandl et al. (2019) was performed only with a thermal neutron beam but achieved higher precision than Damone et al. (2018), providing an intermediate cross section value between the two previous studies (Damone et al.2018;
Koehler et al.1988). Tomandl et al.(2019)also determined the cross section ratios s1 0 of the transitions to the first excited state7Be(n p, 1)7Li*and to the ground state7Be(n p, 0)7Li to be 1.2%±0.6%, which is consistent with the value from Koehler et al. (1988). Contrarily, Damone et al. (2018) did not report any(n p, 1)yield, apparently because the proton kinetic energies of the(n p, 1)channel were too low to observe this channel with theirDE-Esilicon telescope(Barbagallo et al.2018). de Souza et al. (2020) compiled the available 7Be(n p, )7Li data by a hierarchical Bayesian model, and an R-matrix fit derived a reaction rate with an evaluated uncertainty(∼2%)that is much smaller than the discrepancy among the different data sets (∼30%)they adopted. However, the contribution of the(n p, 1) channel was not taken into account in their R-matrix analysis since there were no(n p, 1)data available except at the thermal neutron energy. Therefore, thes s1 0ratio at the BBN energies was still unknown, which will be quantitatively evaluated in this Letter.
Another important neutron-induced reaction, 7Be(n,a)4He, has contained large uncertainties until recently, but there have been also several experiments and reevaluations. These studies rely on some hypothesis or partial measurements, namely, the charge symmetry hypothesis (Hou et al. 2015; Lamia et al.
2017), the measurement of the7Be(n,γα)decays from limited excited states (Barbagallo et al. 2016), or the time-reversal reaction measurement at higher energies (Kawabata et al.
2017). Thus the data quality at the BBN energies is expected to be improved upon. The latest measurement by Lamia et al.
(2019) performed at the EXOTIC radioactive-ion (RI) beam separator (Farinon et al. 2008) of Istituto Nazionale di Fisica Nucleare—Laboratori Nazionali di Legnaro serves as the basis of the present work with a common experimental technique, covering the BBN energies yet with limited statistics.
Therefore, we aimed at further validation of both reactions at the relevant energies that still have disagreements or large uncertainties for more precise BBN investigations.
2. Method
Our basic idea is to avoid experimental difficulties in direct use of a7Be target and a neutron beam by means of the Trojan Horse Method (THM; see Baur 1986; Tribble et al. 2014;
Spitaleri et al. 2016 for general and practical instructions). THM has been known for its accessibility to a two-body reaction at astrophysical thermonuclear energies via a two-to- three-body reaction in a quasi-free(QF)kinematics condition.
In practice, the triple differential cross section of the QF reaction is measured that is proportional to the half-off-energy- shell (HOES) differential cross section of the two-body
process, and corrections by a proper penetration factor and normalization may deduce the on-energy-shell (OES) cross section of interest. This principle is applicable to reactions induced not only by charged particles but also by neutrons (Gulino et al.2010,2013)and with RI beams(Cherubini et al.
2015; Pizzone et al. 2016), as the former work(Lamia et al.
2019)mentioned above established the7Be(n,a)4He reaction measurement via2H(7Be,aa)1H.
3. Experiment
The present experimental setup has an expanded capability to detect 7Li recoils, enabling the 7Be(n p, )7Li reaction measurement via 2H(7Be, Li7 p)1H. We employed a 64μg cm−2thick deuterated polyethylene(CD2)target irradiated by a
7Be RI beam at 3.16 MeV nucleon−1with a typical intensity of 1 ´106 pps produced by Center-for-Nuclear-Study RI Beam separator(CRIB; Kubono et al.2002; Yanagisawa et al.2005;
Yamaguchi et al.2020)of the University of Tokyo, located at the RI Beam Factory, RIKEN. Two parallel plate avalanche counters(PPACs; Kumagai et al.2001)installed in front of the target enabled event-by-event beam tracking. We mounted six DE-E silicon telescopes having charge-division position- sensitive detectors with 45×45 mm2active areas, surrounding the target at distances of 20cm symmetrically to the beam axis at forward angles±12°,±34° and±56°. The telescopes at±34° and±56° with 300μm thick DE layers were optimized for light-particle detection(pandα), while the ones at±12°with 20μm thickDE layers newly enabled the heavy ion7Li identification from the scattered7Be. The coincidence measurement well suppressed the background events, which were checked with a CH2 target. The present setup improved the angular and energy resolutions from those in Lamia et al.
(2019)thanks to using the PPACs, the thinner CD2target, and finer position resolutions of the silicon detectors. The typical center-of-mass energy resolutions for the7Be(n p, )7Li and the
7Be(n,a)4He reaction channels were estimated to be 50keV and 180keV, respectively.
4. Results
The reconstructed three-body Q-value spectra (Costanzo et al. 1990) from the observed coincidences 7Li-p and α-α were consistent with the known Q values of the
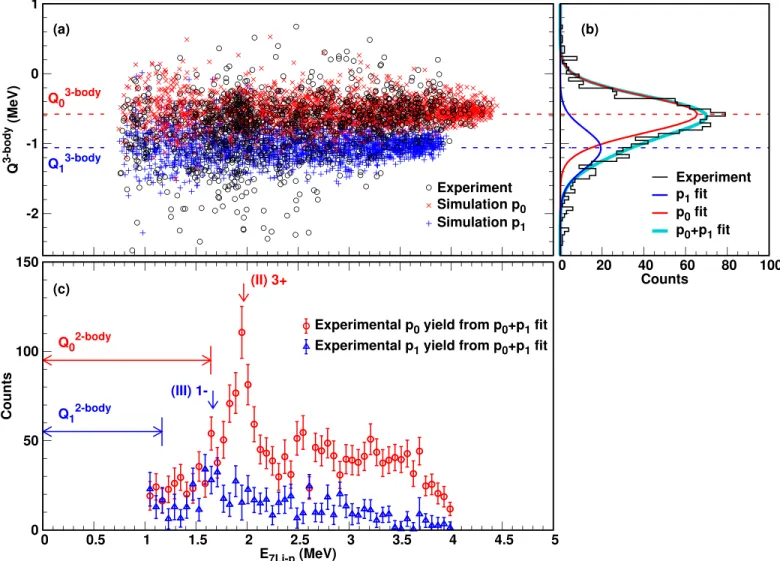
7Be(d, Li7 p0)1H(−0.580 MeV),7Be(d, Li7 *p1)1H(−1.058 MeV), and 7Be(d,aa)1H (16.766 MeV) channels (Wang et al.2017). Figure 1(a) shows the three-body Q-value distribution from the 7Li-p observation versus their relative energy E7Li‐p. The experimental distribution (black dots) and the Monte Carlo simulations based on the experimental resolutions(red and blue crosses) have a fairly good agreement in the Q-value peak energies(red and blue dashed lines)as well as their broadenings.
This is more clearly recognized in Figure1(b), a projection of the data in Figure1(a)to theQ-value axis,fitted by two overlapping Gaussian functions and their sum with peaks and widths representing the experimental dependency onE7Li‐p. In practice, such afit process was applied at eachE7Li‐pbin with theQ-value peak positions and widths determined from the experimental data themselves of whichE7Li‐p dependency was confirmed by the simulation, then we extracted E7Li‐p excitation functions separately for p0 and p1 as shown in Figure 1(c). A more quantitative discussion on validity of the “p0 +p1”model is given in Appendix A. The horizontal arrows in Figure 1(c)
represent theQvalues of the two-body reactions7Be(n p, 0)7Li and
7Be(n p, 1)7Li*, corresponding to the onset of center-of-mass energy defined by Ec.m.ºE7Li‐p-Q2 body‐ . The vertical arrows in Figure1(c)indicate characteristic resonances to be discussed later.
We confirmed the predominance of the QF mechanism by analyzing the shape of the observed p-n momentum distribu- tions for both three-body reaction channels. From their consistency with the analytical Hulthén wave functions for deuteron, we selected the data below 60 MeV c−1as true QF events for the further analysis. We assumed the differential cross section is isotropic owing to the limited statistics and angular coverage. Compared to the calculated angular distribution with the resonance parameters (see Section 5), we estimated the associated uncertainties as 10% and 40% for the 7Be(n,p) and 7Be(n,a) channels, respectively. The obtained HOES cross sections were corrected with the most dominant partial waves in the relevant energy ranges. As is clearer in Section5, the 7Be(n p, 0)excitation function in the relevant energy range is mainly characterized by the s-and p-wave resonances, but the latter is dominant only for a few data points around its sharp peak (3+,Ec.m.=330keV) over the gentle tail of the former(2−,Ec.m.=10keV). This allowed us s-wave-only correction, and normalization to the 330 keV peak of the previous data(Sekharan et al.1976)despite of itsp
wave. The(n p, 1)channel is also considereds-wave dominant (1−,Ec.m.=500keV), and we applied the same normalization factor as7Be(n p, 0)since ours s1 0 was determined from the yields shown in Figure1(c). The7Be(n,a)channel is purelyp- wave dominant, and normalized to the Ec.m.=1 MeV peak (Hou et al. 2015; Kawabata et al. 2017; Lamia et al.
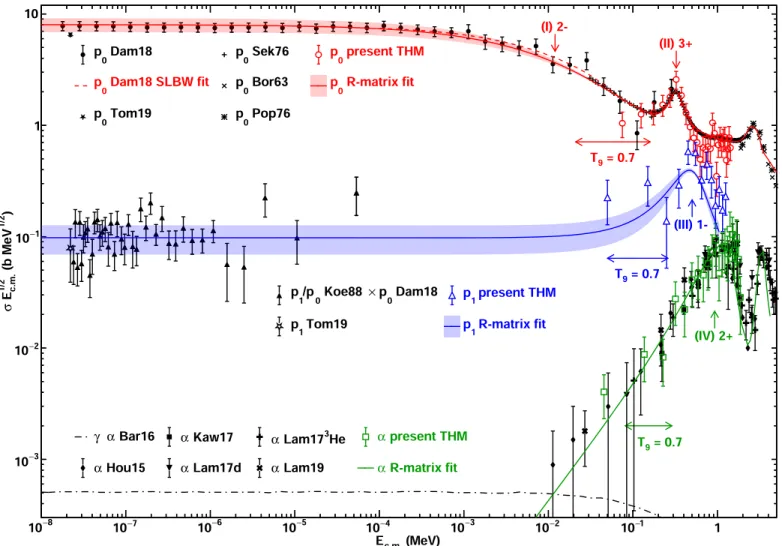
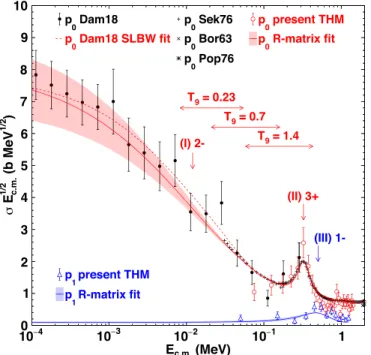
2017, 2019). The normalized cross sections multiplied by Ec.m. of the 7Be(n p, 0)7Li,7Be(n p, 1)7Li*, and7Be(n,a)4He reaction channels are shown in Figure2. Note that their error bars include the statistical uncertainties, the normalization uncertainties, and the ones arising from the isotropic approx- imation, added in quadrature. We also plotted the previous data and evaluations for comparison (Borchers & Poppe 1963;
Poppe et al.1976; Sekharan et al. 1976; Koehler et al. 1988;
Hou et al.2015; Barbagallo et al.2016; Kawabata et al.2017;
Lamia et al.2017, 2019; Damone et al. 2018; Tomandl et al.
2019)with labels defined in the caption of Figure2. Note that the (n p, 1) cross sections obtained from the s s1 0 ratio by Koe88 (Koehler et al. 1988) are renormalized to the Dam18
n p, 0
( )cross sections(labeled as p1 p0 Koe88×p0Dam18). 5.R-matrix Analysis
To obtain reaction rates in a wide temperature range
=
T9 0.001–10 (where T9 is in units of 109K) for BBN
Figure 1.(a)2H(7Be, Li7 p)1H-channelQvalue vs.7Li-prelative energy of the THM data and of the Monte Carlo simulation.(b)Projection of the data in(a)to theQ- value axis.(c)Excitation functions of thep0andp1channels determined by the summed-Gaussianfit.
calculation inputs, continuous excitation functions over10-8to a few MeV are needed for numerical integration. Therefore we performed anR-matrix analysis to compile both the present and the previous data of these three reaction channels by using AZURE2(Azuma et al.2010)including all the relevant partial widthsGn,Gp0,Gp1, andGa. The7Be(n p, 0)data set used for the R-matrix analysis is based on the same selection as used in Damone et al.(2018), Damone(2018; part of Dam18+Sek76 as displayed in Figure 2), and the present THM data, Bor63, and Pop76 are added. For the 7Be(n p, 1) and 7Be(n,a) channels, all the labeled data shown in Figure 2 (except for p1Tom19 andga Bar16) were used without any data cutoff.
AppendixB shows the adopted data sets more explicitly. We included nine known levels below the8Be excitation energy of
=
Ex 24 MeV (Tilley et al. 2004) and an additional non- resonant background pole, with a common channel radius of 5fm for each channel in the same manner as Adahchour &
Descouvemont (2003). The most significant channel 7Be n p, 07
( )Li is dominated by four of these levels as described in detail by a former R-matrix study (Adahchour & Descouve- mont2003; Descouvemont et al.2004); the 2−resonance near the neutron threshold(labeled as levelI)principally dominates the cross section up to the BBN energies, the two 3+states at
=
Ex 19.24 MeV (levelII) and Ex=21.5 MeV well charac- terize the corresponding single peaks, and a 2+ background pole accounts for the enhancement at high energies. The most important resonances to expand analysis to the7Be(n p, 1)7Li* and7Be(n,a)4He channels are the 1−state atEx=19.4 MeV (levelIII) and the 2+ state at Ex=20.1 MeV (levelIV), respectively; the former expresses the 7Be(n p, 1) resonance behavior peaked at Ec.m.~0.5 MeV tailing down to the thermal neutron energy by the1 v law, and the latter forms thefirst peak in the7Be(n,a)spectrum aroundEc.m.~1 MeV. Despite its importance in the(n,a)channel, level IV is much less significant in the total cross section especially at lower energies due to itsp-wave nature. Therefore we imposed some restrictions on level IV, which made the analysis much simpler;
fixing Gp0,Gp1, andGa at a known ratio G G ~a p 4.5 (Tilley et al.2004), and freeingGnand resonance energy(refitted to be 19.87 MeV)not to significantly exceed the known total width G =880 keV(Tilley et al.2004). The other four higher-lying levels (0+ at Ex=20.2 MeV, 2+ at Ex=22.24 MeV, 1− at
=
Ex 22MeV, and 2− at Ex=24MeV) play rather supple- mentary roles mainly for the higher-energy behavior. The 4+ and 4−higher-spin states(atEx=19.86 MeV and 20.9 MeV, respectively)were not included due to their limited influences.
Figure 2.The present cross sections multiplied by Ec.m.of the7Be(n p, 0)7Li, the7Be(n p, 1)7Li*, and the7Be(n,a)4He reactions are shown as open red circles, blue triangles, and green squares, respectively. The previous experimental data and evaluations are labeled as Dam18(Damone et al.2018), Tom19(Tomandl et al.2019), Sek76(Sekharan et al.1976), Bor63(Borchers & Poppe1963), and Pop76(Poppe et al.1976)for(n p, 0); Koe88(Koehler et al.1988)and Tom19 for(n p, 1);
Bar16(Barbagallo et al.2016)for(n,ga); and Hou15(Hou et al.2015), Kaw17(Kawabata et al.2017), Lam17d, Lam173He(Lamia et al.2017), and Lam19(Lamia et al.2019)for(n,a). The solid lines are the presentR-matrixfits with light-colored bands as their uncertainties.
We do not introduce theγ-emission channels to fit the Bar16 plots(representing the7Be(n,ga)4He reaction channel Barba- gallo et al. 2016), which appears significant only below the BBN energies. See AppendixCfor more details on the present R-matrix analysis.
The resulting resonance parameters of levels I–IV are listed in Table 1. The resonance energies and partial widths with uncertainty indices are the ones obtained by the present analysis. The initial partial widths of levelI conform to that of Adahchour & Descouvemont(2003)and refitted to the present
n p, 0
( )data set, thus the Gn and Gp0 were consequently larger than those evaluated in Koehler et al. (1988)and Tilley et al.
(2004). The fixed level IV widths are indicated with double daggers, and the brackets specify provisionalfitting results. The totalΓof levels I–IV is compared with the known valuesΓ(Ref.) as in the rightmost column of Table1. Thefitted curves to the
n p, 0
( )-,(n p, 1)-, and (n,a)-channel cross sections appear as solid curves in Figure2, associating their uncertainties in light- colored bands except for the(n,a)-channel due to the limited parameter freedom of levelIV. The vertical arrows with the spin-parity indices in Figure 2 are placed at the resonance energies of levelsI–IV, and the horizontal arrows indicate energy ranges so as to cover 68% of reaction rates for each reaction channel at a typical BBN temperatureT9=0.7. Note that our 7Be(n p, 0) fitting curve appears significantly lower than that of the single-level Breit–Wignerfit by Damone et al.
(2018; red dashed curve, p0 Dam18 SLBW fit in Figure 2), especially aroundEc.m.~10 keV(see AppendixD), where the R-matrix analysis does not demand resonances other than levelI. Contrarily, Dam18 SLBW analysis attempted to bestfit the experimental data (although their uncertainties are rela- tively large around Ec.m.~10keV) assuming known reso- nances but without any constraints on partial widths, which let level-III Gn significantly exceed the Wigner limit (see Damone 2018).
6. Application to BBN
The uncertainties of the excitation functions from the R-matrix fitting (as shown in Figure 2) and those of the reaction rates were evaluated by a Monte Carlo simulation varying the resonance parameters around the best-fit values by their uncertainties. Figures 3(a)–(d) show the 7Be(n p, )7Li reaction rates with uncertainties relative to that of Cyburt (2004; black solid curve, Cyb04) in the same manner as Damone et al.(2018). The effective BBN temperature range of
=
T9 0.23–1.4 is indicated by cyan vertical bands. Figure3(a) represents the previous 7Be(n p, 0) rates DAACV04 (Descou- vemont et al.2004)and Dam18(Damone et al.2018), and the latter is plotted in each panel for comparison. One can see that
the present p0 rate in Figure 3(b)appears significantly lower than Dam18p0as expected. Our recommendedp0+p1rate in Figure3(c)is ultimately comparable to Dam18p0in the BBN range, but with different temperature dependence due to the
n p, 1
( )contribution. The sum of Dam18p0and the presentp1in Figure3(d)represents a possible upper limit deducible from the adopted cross section data set, but the Dam18p0contribution retains the large uncertainties. The present recommended reaction rate data sets and the analytic form are posted in AppendixE.
We have calculated the 7Li/H abundances with the above
7Be(n p, )7Li reaction rates by using one of the most recent BBN codesPRIMAT(Pitrou et al.2018, see AppendixF). Note that the present7Be(n,a)4He reaction rate was found to offer little change (∼0.1%) to the7Li/H yield compared to Bar16 rate (Barbagallo et al. 2016), which is used in PRIMAT by default, thus not to be discussed here. Table 2 compares the
7Li/H yields (in units of 10−10) at the baryon-to-photon number density ratio h =6.09´10-10 (Pitrou et al. 2018) determined from the cosmic microwave background observa- tion. The upper four rows demonstrate that thePRIMATresults with Cyb04 and Dam18 rates are consistent with those from Damone et al. (2018) who used the AlterBBN code (Arbey 2012) within the errors, although the PRIMAT ones tend to be slightly smaller. The lower four rows represent the comparison between thePRIMATdefault rate(DAACV04)and the present ones. We highlight that the recommendedp0+p1
rate yields a significantly smaller 7Li/H value (5.18-+0.250.22´ 10-10) than DAACV04 p0(5.63-+0.240.22 ´10-10) by about one- tenth or 2 standard deviations. The maximum possible rate Dam18 p0 + present p1 would derive an extra few percent reduction of7Li/H but rather retain the largest uncertainties in Table2. Therefore, the recommended rate may impose a more strict constraint on the primordial 7Li/H abundance owing to the reevaluation of the (n p, 0) uncertainty and the first-ever quantified (n p, 1) contribution, which should be adopted in future BBN investigations although we obviously need additional contributions to get closer to the observed 7Li/H value1.580.3´10-10 (Sbordone et al.2010).
7. Summary
We discussed the neutron-induced reactions on 7Be, which play pivotal roles in the 7Li production during BBN. We applied THM to measure the7Be(n p, )7Li and the7Be(n,a)4He reactions simultaneously via the 2H(7Be, Li7 p)1H and the 2H
Be,aa
7 1
( )H reactions with a 7Be RI beam at CRIB. The multichannel R-matrix analysis with AZURE2 fitted both the previous and the present data consistently with the 8Be
Table 1
Low-lying Resonance Parameters Resulted from theR-matrix Fit
Level No. Jp Ex Ec.m. ln Gn lp0 Gp0 lp1 Gp1 la Ga Γ Γ(Ref.)
I 2− 18910a 10 0 297-+3223 0 651-+7355 2 ∼0 L L 948-+8059 1634b
II 3+ 19230b 330 1 89-+98 1 66-+34 3 ∼0 L L 155-+109 165b
III 1− 19400a 500 0 263-+4656 0 ∼0 0 326-+7075 L L 589-+8494 645a
IV 2+ (1988520) (98520) 1 (893) 1 23c 1 143c 2 726c (981) 880a
Notes.The brackets indicate provisionalfit values. Energies are all in units of keV.
aFrom Tilley et al.(2004).
bFrom Adahchour & Descouvemont(2003).
cThe proton andαwidths of Level IV arefixed at a ratioG G ~a p 4.5(Tilley et al.2004).
resonance structure, which indicated slightly smaller 7Be n p, 07
( )Li cross sections with better uncertainty evaluations than those of Damone et al. (2018), and quantified the 7Be
n p, 17
( )Li*contribution in the BBN energy range for the first time. The new BBN calculation by PRIMAT with the recommended p0 + p1 reaction rate substituting the default rate(Descouvemont et al.2004)results in the decrement of the primordial 7Li abundance by about one-tenth or 2 standard
deviations, which is still incomplete but should be accounted for as a part of the solution to the CLP.
This experiment was performed at RI Beam Factory operated by RIKEN Nishina Center and CNS, University of Tokyo. This work was supported by JSPS KAKENHI (grant Nos.
15K17631, 18K13556, and 19K03883). K.Y.C. and S.M.C.
were supported by National Research Foundation of Korea (Nos.2020R1I1A1A01065120,2020R1A2C1005981,2019K2- A9A2A10018827, and 2016R1A5A1013277). D. Kahl would like to thank the UK STFC for support. D. Kim acknowledges the support from the IBS grant funded by the Korean government (No. IBS-R031-D1). G.G.K. acknowledges the support by NKFIH (NN128072) and from the Janos Bolyai research fellowship of the Hungarian Academy of Sciences and from UNKP-20-5-DE-2 New National Excellence Program of the Ministry of Human Capacities of Hungary. The authors acknowledge Finanziamenti di Linea 2 and Starting Grant 2020 by University of Catania. We would like to give a special thanks to C.Pitrou and A.Coc for the helpful discussion about thePRIMATcalculation.
Software:AZURE2 (Azuma et al. 2010), PRIMAT (Pitrou et al.2018).
Appendix A
Validity Test of the Extraction of the p0- and p1-channel Yields
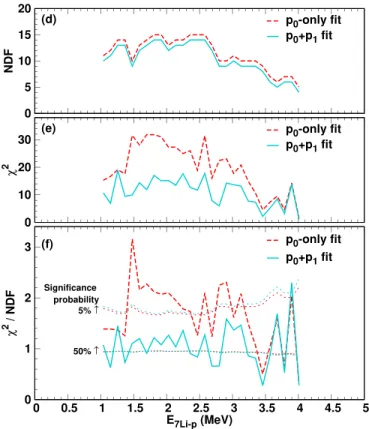
We add a supplemental FigureA1relevant to Figure1with information of chi-squared test. Panel (d) and (e) show the number of degrees of freedom (NDF) and the chi-squarec2, respectively, versus relative energyE7Li‐p. The red dashed lines
Figure 3.Comparison of the previous(Dam18, Damone et al.2018; DAACV04, Descouvemont et al.2004)and the present7Be(n p, )7Lireaction rates relative to that of Cyb04(Cyburt2004)together with uncertainties in light-colored bands.
Table 2
7Li Abundances ath=6.09´10-10(Pitrou et al.2018)with Different BBN Calculation Codes and the7Be(n p, )7Li Reaction Rate Sources Reaction Rate Source BBN Code 7Li/H(10−10) Cyb04p0
a AlterBBN 5.46b
Dam18p0b AlterBBN 5.260.40b
Cyb04p0a PRIMAT 5.38-+0.310.30
Dam18p0
b PRIMAT 5.15-+0.490.43
DAACV04p0c PRIMAT 5.63-+0.240.22d
Presentp0 PRIMAT 5.37-+0.250.22
Presentp0+p1(recommended) PRIMAT 5.18-+0.250.22
Dam18p0b+presentp1(max.) PRIMAT 4.97-+0.410.47
Observation L 1.580.3e
Notes.
aCyburt(2004).
bDamone et al.(2018).
cAdahchour & Descouvemont(2003); Descouvemont et al.(2004).
dPitrou et al.(2018).
eSbordone et al.(2010).
represent the “p0-only” fit, assuming that there is only p0
contribution with a single Gaussian function peaked at the Q03 body‐ (corresponding to “p0” in Figure 1(b)), and the cyan solid lines represent the“p0 +p1”fit, employing a sum of two Gaussian functions peaked at Q03 body‐ and Q13 body‐ (corresp- onding to “p0 +p1”in Figure 1(b)). The reduced chi-square c2 NDF versusE7Li‐pis then plotted in panel(f). Note that the only free parameters in thep0-only and the p0 +p1fits are the heights of the Gaussian functions, otherwise the peak positions and the widths are not fitted butfixed as functions of E7Li‐p, which are determined from the experimental data themselves of which E7Li‐p dependency was confirmed by the simulation.
That means that the difference between their NDFs is always 1 as seen in panel (d). One can see that thep0-onlyc2 always tends to be larger than p0 +p1 below 3.5 MeV. The dotted lines in panel(f)indicate the upper significance probabilities of 50% and 5% for the NDFs as functions ofE7Li‐pfor thep0-only and p0 +p1 fits. This figure tells us that, if the p0-only assumption is valid, such a c2 would appear only at a probability of less than 5% at most of the energies, which is obviously unlikely. On the other hand, the p0 +p1 fit c2 mostly settles around the 50% line, which means a “good” model. In conclusion, there is no reason to deny the existence of p1 events, which can be evaluated quantitatively in a statistically reasonable way.
Appendix B
Adopted Cross Section Data Used forR-matrix Fit The cross section data sets of the 7Be(n p, 0)7Li,
7Be(n p, 1)7Li*, and 7Be(n,a)4He reaction channels used for theR-matrix analysis are listed below with the selected center- of-mass energy ranges:
1. (n p, 0): Dam18 (Damone et al. 2018, 1.79´ 10-8–2.84´10-2 MeV), Sek76(Sekharan et al. 1976,
´ -
3.09 10 2–2.03 MeV), Bor63(Borchers & Poppe1963, 1.89–7.12 MeV), Pop76(Poppe et al.1976, 1.98–20.9 MeV), Present(TableB1,1.71´10-1–6.21´10-1 MeV). 2. (n p, 1): Koe88 renormalized by Dam18 (Koehler et al.
1988; Damone et al. 2018, 2.41´10-8–5.36´10-5 MeV), Present(TableB2,5.00 ´10-2–1.75 MeV). 3. (n,a): Hou15(Hou et al.2015,1.13´10-2–5.75 MeV),
Kaw17(Kawabata et al.2017,2.21´10-1–7.48´10-1 MeV), Lam17d (Lamia et al. 2017, 8.44´10-2– 4.07 MeV), Lam173He (Lamia et al.2017,1.03´10-1– 5.29 MeV), Lam19 (Lamia et al. 2019, 2.70´10-2– 1.71 MeV), Present(TableB3,4.55´10-2–1.95 MeV). These present data are tabulated in TablesB1,B2, andB3, respectively.
Figure A1.Chi-squared test for thep0- andp1-channel extraction.
Table B1
Present Cross Section Data for the7Be(n p, 0)7Li Reaction Channel
Ec.m.(MeV) σ(mb) σError(mb)
1.7100E−01 3.2811E+03 7.2395E+02
2.2100E−01 3.2069E+03 6.7440E+02
2.7100E−01 3.2683E+03 6.5078E+02
3.2100E−01 4.6566E+03 8.4118E+02
3.7100E−01 2.9348E+03 5.5204E+02
4.2100E−01 2.0413E+03 4.2481E+02
4.7100E−01 1.4278E+03 3.2382E+02
5.2100E−01 1.1368E+03 2.6914E+02
5.7100E−01 9.5194E+02 2.4849E+02
6.2100E−01 9.6064E+02 2.3840E+02
Table B2
Present Cross Section Data for the7Be(n p, 1)7Li*Reaction Channel
Ec.m.(MeV) σ(mb) σError(mb)
5.0000E−02 1.0051E+03 4.3335E+02
1.5000E−01 7.9321E+02 3.0778E+02
2.5000E−01 2.7660E+02 1.7228E+02
3.5000E−01 4.9286E+02 1.8788E+02
4.5000E−01 8.7029E+02 2.0718E+02
5.5000E−01 7.6830E+02 1.7937E+02
6.5000E−01 4.0124E+02 1.3012E+02
7.5000E−01 5.1972E+02 1.4332E+02
8.5000E−01 3.5284E+02 1.1173E+02
9.5000E−01 1.9607E+02 7.3929E+01
1.0500E+00 2.6023E+02 7.7816E+01
1.1500E+00 1.6192E+02 5.8325E+01
1.2500E+00 2.0574E+02 6.6264E+01
1.3500E+00 1.1979E+02 5.3054E+01
1.4500E+00 2.3857E+02 6.4166E+01
1.5500E+00 1.1074E+02 4.5971E+01
1.6500E+00 1.7302E+02 5.4818E+01
1.7500E+00 1.2916E+02 5.0571E+01
1.8500E+00 1.2031E+02 5.1566E+01
1.9500E+00 9.9726E+01 4.2692E+01
2.0500E+00 1.0598E+02 4.6713E+01
2.1500E+00 7.9459E+01 3.6836E+01
2.2500E+00 5.8217E+01 3.2418E+01
2.3500E+00 4.0515E+01 4.3453E+01
2.4500E+00 5.5771E+01 3.8033E+01
Appendix C Details on theR-matrix Fit
We here give a supplemental description of theR-matrixfit.
The levels above IV are labeled as V–X in serial order. This attempt of R-matrix analysis in a wide energy range (Ec.m.<5MeV) rather emphasizes that the cross sections in the BBN-relevant energy region (Ec.m.<0.6MeV) are char- acterized almost only by thefirst few resonances up to level IV, but is not to discuss the uniqueness of thefit at higher energies where the levels overlap each other more substantially.
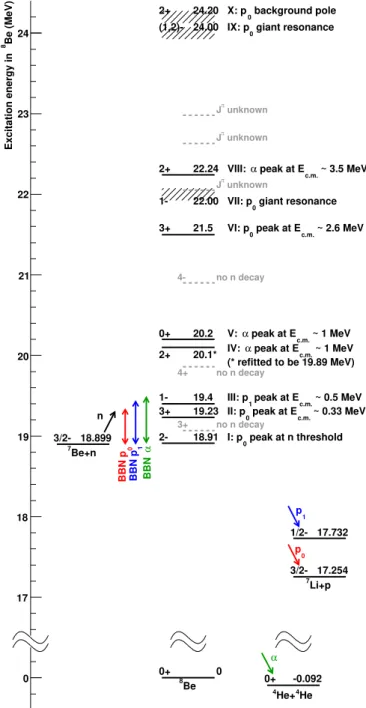
FigureC1illustrates the level scheme of8Be excitation energy above the7Be+nthreshold. TableC1shows all the resonance parameters resulted from theR-matrixfit. Detailed explanations for each excited levels of8Be excitation used for theR-matrix analysis are given below.
1. Level I(2−,Ex=18.91 MeV): This is considered as the most responsible resonance for the enhancement of the
n p, 0
( )cross section above the neutron threshold up to the BBN-relevant energies. The parameterization conforms to that of Adahchour & Descouvemont (2003), namely, G = G + G = G + G + Gn p n p0 p1, although the Gp1 was found to be negligible from thefit. TheGais not allowed by the parity conservation law for this excited state.
Another R-matrix analysis by Koehler et al. (1988) defines the resonance energy and width as the properties of a pole of theS-matrix in the so-called Riemann sheet IV, which provides much smaller total width as adopted in Tilley et al. (2004). The energy and partial widths could not be determined simultaneously from the behavior of the (n p, 0) excitation function near the neutron threshold. We fixed the resonance energy at
=
Ex 19.10 MeV(Tilley et al.2004)and free the widths, rather than fixing the widths and freeing the energy as Adahchour & Descouvemont (2003) did because the cross section varies sensitively to the resonance energy,
which is so close to the threshold. Note that Adahchour &
Descouvemont(2003)and Koehler et al.(1988)analyses were based on Koe88p0data(Koehler et al.1988)in the level-I dominant energy region, while we performed the fit to Dam18p0data(Damone et al.2018), which resulted in differentfitted parameters. As long as the existence of level I is only assumed in this energy region, the fitted excitation function was always found to settle lower than the single-level Breit–Wigner resonance fit (p0 Dam18 SLBW fit) by Damone et al. (2018) especially around
=
Ec.m. 10keV no matter if all the level I parameters are freed or some arefixed. This is nothing but becausep0
Dam18 SLBWfit allows anomalistically largeGnof level
Table B3
Present Cross Section Data for the7Be(n,a)4He Reaction Channel
Ec.m.(MeV) σ(mb) σError(mb)
4.5455E−02 1.8920E+01 8.0471E+00
1.3636E−01 2.3730E+01 1.0252E+01
2.2727E−01 1.7352E+01 7.8241E+00
3.1818E−01 4.8899E+01 2.0648E+01
4.0909E−01 3.4661E+01 1.4974E+01
5.0000E−01 5.7867E+01 2.4435E+01
5.9091E−01 6.1183E+01 2.5835E+01
6.8182E−01 5.4730E+01 2.3276E+01
7.7273E−01 6.5180E+01 2.7523E+01
8.6364E−01 7.8637E+01 3.3022E+01
9.5455E−01 9.5229E+01 3.9814E+01
1.0455E+00 4.5928E+01 1.9989E+01
1.1364E+00 7.0944E+01 3.0172E+01
1.2273E+00 7.4196E+01 3.1555E+01
1.3182E+00 6.1473E+01 2.6558E+01
1.4091E+00 9.8541E+01 4.1611E+01
1.5000E+00 8.5586E+01 3.6560E+01
1.5909E+00 5.9830E+01 2.6277E+01
1.6818E+00 7.6157E+01 3.3146E+01
1.7727E+00 4.7037E+01 2.1640E+01
1.8636E+00 2.0911E+01 1.1196E+01
1.9546E+00 2.2840E+01 1.2229E+01
Figure C1.Level scheme of the8Be excitation energy above the7Be+ n threshold. The levels adopted in theR-matrix analysis are shown as black solid lines, and the ones not adopted are shown as gray dashed lines. The adopted broad levels are shown in black hatch. The effective energy ranges to the BBN for each decay channel are indicated by colored vertical arrows. The typical contributions are briefly explained on the right-hand side of each level.