ORIGINAL RESEARCH
Evidence of a Myenteric Plexus Barrier and Its Macrophage- Dependent Degradation During Murine Colitis: Implications in Enteric Neuroin fl ammation
Q1
Q12
David Dora,
1,aSzilamer Ferenczi,
2,aRhian Stavely,
3Viktoria E. Toth,
4,5Zoltan V. Varga,
4,5Tamas Kovacs,
1Ildiko Bodi,
1Ryo Hotta,
3Krisztina J. Kovacs,
2Allan M. Goldstein,
3and Nandor Nagy
11Department of Anatomy, Histology and Embryology, Faculty of Medicine, Semmelweis University, Budapest, Hungary;
2Institute of Experimental Medicine, Laboratory of Molecular Neuroendocrinology, Budapest, Hungary;3Department of Pediatric Surgery, Massachusetts General Hospital, Harvard Medical School, Boston, Massachusetts;4Department of Pharmacology and Pharmacotherapy, Semmelweis University, Budapest, Hungary; and5HCEMM-SU Cardiometabolic Immunology Research Group, Semmelweis University, Budapest, Hungary
DSS
DSS+
macrophage depletion with L-clodronate
FITC-dextran
FITC-dextran
- Matrix degradation
- Myenteric barrier disruption - Enteric neuroinflammation Inflamed muscularis
Intact muscularis
FITC leaks inside ganglia
- No matrix degradation - Intact myenteric barrier
SUMMARY
The impermeable barrier present around the myenteric plexus is disrupted after experimental colitis in a macrophage-dependent manner, exposing enteric neurons and glia to inflammatory cells. This study supports a po- tential mechanism for the onset of neuroinflammation in colitis and other gastrointestinal pathologies associated with acquired enteric neuronal dysfunction.
BACKGROUND & AIMS: Neuroinflammation in the gut is associated with many gastrointestinal (GI) diseases, including inflammatory bowel disease. In the brain, neuroinflammatory conditions are associated with blood-brain barrier (BBB) disruption and subsequent neuronal injury. We sought to determine whether the enteric nervous system is similarly protected by a physical barrier and whether that barrier is disrupted in colitis.
METHODS: Confocal and electron microscopy were used to characterize myenteric plexus structure, and FITC-dextran
assays were used to assess for presence of a barrier. Colitis was induced with dextran sulfate sodium, with co-administration of liposome-encapsulated clodronate to deplete macrophages.
RESULTS: We identified a blood-myenteric barrier (BMB) consisting of extracellular matrix proteins (agrin and collagen- 4) and glial end-feet, reminiscent of the BBB, surrounded by a collagen-rich periganglionic space. The BMB is impermeable to the passive movement of 4 kDa FITC-dextran particles. A population of macrophages is present within enteric ganglia (intraganglionic macrophages [IGMs]) and exhibits a distinct morphology from muscularis macrophages, with extensive cytoplasmic vacuolization and mitochondrial swelling but without signs of apoptosis. IGMs can penetrate the BMB in physiological conditions and establish direct contact with neurons and glia. Dextran sulfate sodium-induced colitis leads to BMB disruption, loss of its barrier integrity, and increased numbers of IGMs in a macrophage-dependent process.
CONCLUSIONS: In intestinal inflammation, macrophage- mediated degradation of the BMB disrupts its physiological barrier function, eliminates the separation of the intra- and extra-ganglionic compartments, and allows inflammatory 23
45 67 89 10 1112 1314 15 1617 1819 2021 2223 2425 26 2728 2930 31 3233 3435 3637 3839 4041 42 4344 4546 4748 4950 5152 53 5455 5657 58
6061 6263 6465 6667 68 6970 7172 73 7475 7677 7879 8081 8283 84 8586 8788 89 9091 9293 9495 9697 9899 100 101102 103104 105106 107108 109110 111 112113 114115 116
stimuli to access the myenteric plexus. This suggests a potential mechanism for the onset of neuroinflammation in colitis and other GI pathologies with acquired enteric neuronal dysfunc- tion. (Cell Mol Gastroenterol Hepatol 2021;-:-–-; https://
doi.org/10.1016/j.jcmgh.2021.07.003)
Keywords: Barrier; Enteric Ganglion; Macrophage; ECM;
Intraganglionic Macrophage; Colitis.
A
mong its many essential roles, the gastrointestinal (GI) tract regulates motility, digestion, absorption of nutrients, removal of waste, and protection from pathogens, allergens, and toxins. Many of these functions rely on co- ordination between the enteric nervous system (ENS) and the immune system. The ENS comprises a complex network of neural and glial cells that is influenced by the central nervous system (CNS) but performs a wide array of functions independently to maintain homeostasis, including regulating GI motility and participating in crosstalk with the microbiota and resident leukocytes of the intestinal immune system.1,2 Enteric neuroinflammation disrupts these processes and has been implicated in chronic GI diseases including esoph- ageal achalasia, gastroparesis, chronic intestinal pseudo- obstruction, irritable bowel syndrome, and inflammatory bowel disease (IBD).3–6 In IBD, infiltration of nonresident leukocytes to the enteric plexuses (plexitis) is predictive of future relapses, indicating that neuroinflammation may contribute to chronic intestinal inflammation.6Intestinal macrophages are a tissue-specific population of leukocytes descending from erythro-myeloid progenitors that colonize every layer of the gut including the muscularis propria.7,8 Whereas mucosal macrophages have a role in antigen sampling and antimicrobial (M1) responses, resi- dent muscularis macrophages (MMs) exhibit an anti- inflammatory (M2) phenotype important in tissue protec- tion and regeneration.9Nevertheless, conditions of inflam- mation or stimulation by pathogen-associated molecular patterns (PAMPs) can activate resident MMs into a proin- flammatory phenotype with unknown consequences on the ENS.10,11Early histologic studies describing ultrastructural features of enteric ganglia12–14 identified macrophages closely juxtaposed to nerve fibers15 and enteric neu- rons.16,17Recently, subpopulations of microglia-like MMs in proximity to the ENS have been identified, including myenteric plexus macrophages (MyMs), situated in close spatial association with the myenteric plexus,18–20 and intraganglionic macrophages (IGMs) in the embryonic and postnatal avian and mouse intestine.21Detailed character- ization of the morphology and immunophenotype of MyMs and IGMs has not yet been accomplished. Furthermore, it is unknown whether IGMs and MyMs are the same cell pop- ulation capable of migrating in and out of the myenteric plexus to interact with enteric neurons and glial cells.
The blood-brain barrier (BBB) of the CNS protects neu- rons and glia from proinflammatory PAMPs such as lipo- polysaccharides (LPS).22 The gut is the major site of interaction between commensal microbiota and the host.
Despite some early attempts to characterize the presence of
a“blood-myenteric ganglia”barrier,23–25there is still a gap in our knowledge about the nature of this barrier that might protect enteric neurons and glial cells from exogenous pathogenic macromolecules. During gangliogenesis, migrating enteric neural crest cells secrete extracellular matrix (ECM) molecules, including collagens, tenascin, and agrin.26–28 Among these, agrin persists postnatally and could serve to physically separate and protect the enteric ganglia from the surrounding environment.21
In the present study, we describe the existence of a barrier that encapsulates the myenteric plexus at an ultra- structural level and consists of ECM proteins and glial end- feet. IGMs are demonstrated to be capable of penetrating the blood-myenteric barrier (BMB) and undergo morphologic transformation. In physiological conditions the BMB is impermeable to fluorescein isothiocyanate (FITC)-dextran, indicating that it is a functional barrier to exogenous mac- romolecules. Experimental colitis in mice severely disrupts the BMB, degrading its ECM components and disrupting its barrier function. However, this effect can be rescued by the experimental depletion of MMs with L-clodronate, suggest- ing that inflammation-mediated disruption of the BMB is macrophage-dependent.
Results
A Subset of Hematopoietic Cells in Colonic Enteric Ganglia Possess a Macrophage Signature
We evaluated the presence of IGMs in 1-mm-thick sem- ithin sections from CX3CR1GFP adult mouse colon labeled with antibody against the ECM protein agrin. Agrin is secreted by neural crest-derived cells28and demarcates the outer border of the myenteric ganglia.21Greenfluorescent protein (GFP) labeling (developed with VectaRed) shows macrophages present inside the enteric ganglia (Figure 1A and B, arrowheads). Fluorescent immunostaining shows CX3CR1GFP IGMs localized within the agrin-expressing ganglionic border (Figure 1C, arrowheads). MyMs are situ- ated outside the ganglia (Figure 1C, arrows), but with their cell bodies adjacent to the agrinþ ganglionic border. Sur- rounding the ganglia is the periganglionic space (PGS) (Figure 1E, asterisks), which comprises the connective tis- sue space between the agrin and collagen type 4 (Col4)
aAuthors share co-first authorship.
Abbreviations used in this paper: BBB, blood-brain barrier; BMB, blood-myenteric barrier; CNS, central nervous system; DSS, dextran sulfate sodium; ECM, extracellular matrix; ENS, enteric nervous sys- tem; FITC,fluorescein isothiocyanate; GFP, greenfluorescent protein;
GI, gastrointestinal; Iba1, ionized calcium-binding adapter molecule 1;
IBD, inflammatory bowel disease; IGM, intraganglionic macrophage;
IL, interleukin; iNOS, inducible nitric oxide synthase; LPS, lipopoly- saccharide; MCP-1, monocyte chemoattractant protein-1; MM, mus- cularis macrophage; MMP, matrix metalloproteinase; MyMs, myenteric plexus macrophages; PAMP, pathogen-associated molec- ular pattern; PBS, phosphate-buffered saline; PGS, periganglionic space; qPCR, quantitative polymerase chain reaction; STED, stimu- lated emission depletion; TNF, tumor necrosis factor. Q6
©2021 The Authors. Published by Elsevier Inc. on behalf of the AGA Institute. This is an open access article under the CC BY-NC-ND
license (http://creativecommons.org/licenses/by-nc-nd/4.0/).
2352-345X
https://doi.org/10.1016/j.jcmgh.2021.07.003
117 118119 120121 122 123124 125126 127128 129130 131132 133 134135 136137 138139 140141 142143 144 145146 147148 149 150151 152153 154 155156 157158 159160 161162 163164 165 166167 168169 170171 172173 174175
176 177178 179180 181 182183 184185 186187 188189 190191 192 193194 195196 197198 199200 201202 203 204205 206207 208 209210 211212 213 214215 216217 218219 220221 222223 224 225226 227228 229230 231232 233234
web4C=FPO
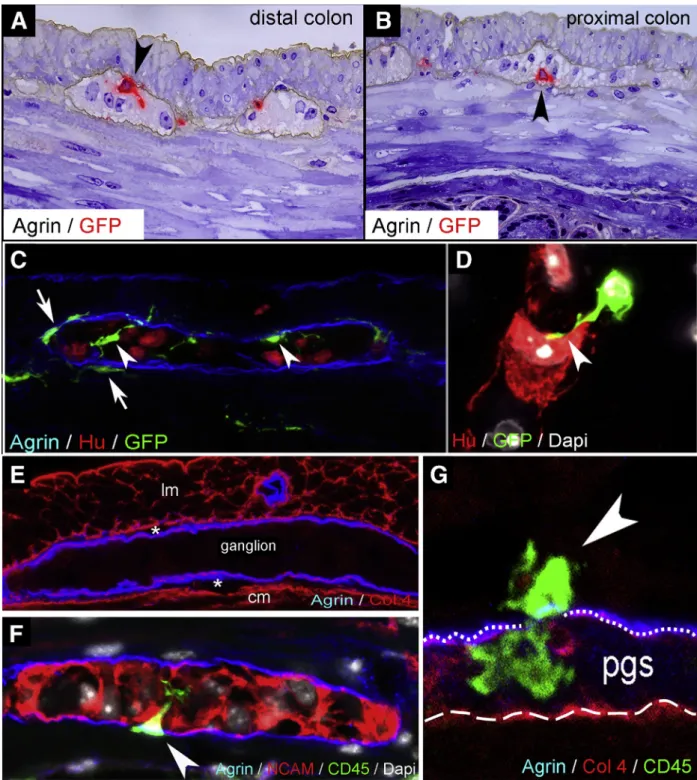
Figure 1.IGMs and their characterization in CX3CR1GFPmouse colon.Double immunolabeling of semithin sections with agrin and GFP was performed on distal (A) and proximal (B) colon sections of adult CX3CR1GFPmice. GFPþIGMs (red) are present inside the agrinþ basement membrane of the enteric ganglia (brown). Immunofluorescent staining with agrin (ganglionic basement membrane), Hu (enteric neurons), and GFP (macrophages) shows spatially distinct populations of MMs, with IGMs labeled with arrowheadsand MyMs in the PGS witharrows(C). GFPþIGM in physical contact with an enteric neuron (D, arrowhead). Agrin and Col4 immunolabeling shows the ECM capsule surrounding the enteric ganglia (E). The periganglionic space (E,asterisks) is present between the Col4-expressing smooth muscle basement membrane and the Col4þ/agrinþ expressing ganglionic basement membrane. Super-resolution imaging of IGMs and the PGS shows a MyM penetrating the ganglionic basement membrane (G,dotted line) and entering the enteric ganglion (FandG,arrowheads). The smooth muscle basement membrane again shows expression of Col4, but not agrin (G,dashed line). cm, circular muscle layer;
lm, longitudinal muscle layer.
235 236237 238239 240 241242 243244 245246 247248 249250 251 252253 254255 256257 258259 260261 262 263264 265266 267 268269 270271 272 273274 275276 277278 279280 281282 283 284285 286287 288289 290291 292293
294 295296 297298 299 300301 302303 304305 306307 308309 310 311312 313314 315316 317318 319320 321 322323 324325 326 327328 329330 331 332333 334335 336337 338339 340341 342 343344 345346 347348 349350 351352
expressing ganglionic basement membrane (Figure 1G, dotted line) and the smooth muscle basement membrane expressing Col4 but not agrin (Figure 1G, dashed line).
Super-resolution imaging using stimulation emission deple- tion (STED) microscopy revealed that CD45þCX3CR1þ macrophages are also present in the PGS and can penetrate the ganglionic basement membrane and enter the enteric ganglia (Figure 1F and G, arrowheads). The morphologic features of these cells suggest active migration from the PGS into the intraganglionic space. STED imaging also demon- strates CX3CR1þ macrophages in direct physical contact with Hu-expressing enteric neurons (Figure 1D, arrowhead).
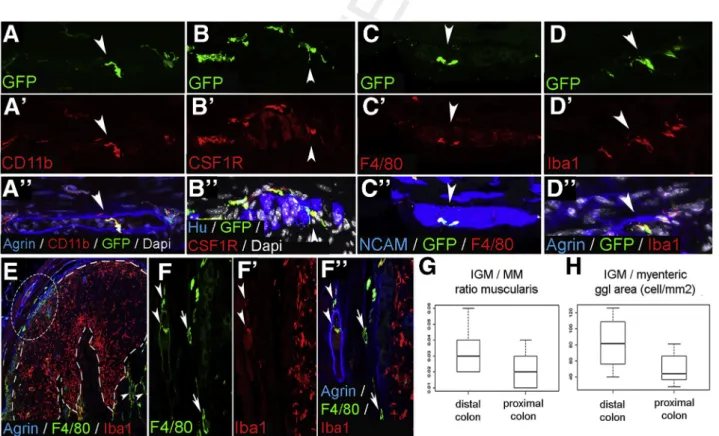
To characterize the immunophenotype of IGMs, we performed confocal microscopy on serial sections of CX3CR1GFPmouse distal colon. Previously it was shown that CX3CR1þMMs are CD45þ, CD11bþ, and F4/80þ.9Double immunostaining with anti-GFP antibody (Figure 2A) and the macrophage marker CD11b (Figure 2A’) confirms coex- pression on all MMs including IGMs (Figure 2A”, arrow- head). GFPþIGMs also express colony-stimulating factor 1 receptor (Figure 2B–B”), pan-macrophage marker F4/80 (Figure 2C–C”), and ionized calcium-binding adapter mole- cule 1 (Iba1) (Figure 2D–D”), which is known to be expressed by intestinal MMs.29
Q7 We find the IGMs present
inside the enteric ganglia, which are delineated by agrin expression (Figure 2A” and D”) and among Huþ (Figure 2B”) and NCAMþ(Figure 2C”) enteric neurons. F4/
80 and Iba1 are coexpressed on MMs and IGMs (Figure 2E, circled area; Figure 2F–F”, arrowheads). However, Iba1 is not expressed by most submucosal macrophages (Figure 2F–F”, arrows). In contrast, macrophages in mucosal lymphatic aggregates express Iba1 and not F4/80 (Figure 2E, dashed line;Figure 2F–F”). Thesefindings sug- gest that the various subpopulations of intestinal macro- phages possess different immunophenotypes, with IGMs expressing CD45, CX3CR1, CD11b, Iba1, F4/80, and colony- stimulating factor 1 receptor.
We compared the total number of MMs in the muscularis propria of CX3CR1GFPmouse colon and found no significant difference between distal and proximal colon (76.03 ± 32.64 vs 73.82 ±29.26 cell/mm2,P¼.4506). The ratio of IGMs to total MMs is higher in the distal colon, although this difference did not reach statistical significance (3.26 % ± 1.3 % vs 2.12 %±1.1 %,P¼.0977;Figure 2G). When the density of IGMs is adjusted to ganglionic area, there is a significantly higher density of IGMs in the distal compared with proximal colon (82.37 ±32.98 vs 50.25±19.6 cell/
mm2,P¼.0309;Figure 2H).
web4C=FPO
Figure 2.Immunophenotype and spatial distribution of IGMs in CX3CR1GFPmouse colon.GFPþIGMs are present within the agrin-bordered enteric ganglia and co-express CD11b (A–A”), CSF1R (B–B”), F4/80 (C–C”), and Iba1 (D–D”). F4/80 and Iba1 are co-expressed by MMs and IGMs (F–F”,arrowheads, magnified fromcircled area in E), but Iba1 is not present in submucosal macrophages (F–F”,arrows). In lymphatic aggregates of the colonic mucosa (E,area within dashed line), mac- rophages express Iba1 but not F4/80. Comparison of MM and IGM cell number in the proximal and distal colon of CX3CR1GFP mice shows no significant difference in ratio of IGMs to total MMs (G; 3.26 %±1.3 % vs 2.12 %±1.1 %,P¼.0977, n¼8).
However, the number of IGMs is significantly higher in distal colon compared with proximal colon when adjusted to myenteric ganglion area (H; 82.37±32.98 vs 50.25±19.6 cell/mm2,P¼.0309, n¼8).
353 354355 356357 358 359360 361362 363364 365366 367368 369 370371 372373 374375 376377 378379 380 381382 383384 385 386387 388389 390 391392 393394 395396 397398 399400 401 402403 404405 406407 408409 410411
412 413414 415416 417 418419 420421 422423 424425 426427 428 429430 431432 433434 435436 437438 439 440441 442443 444 445446 447448 449 450451 452453 454455 456457 458459 460 461462 463464 465466 467468 469470
IGMs Are Structurally Distinct From Extraganglionic Macrophages
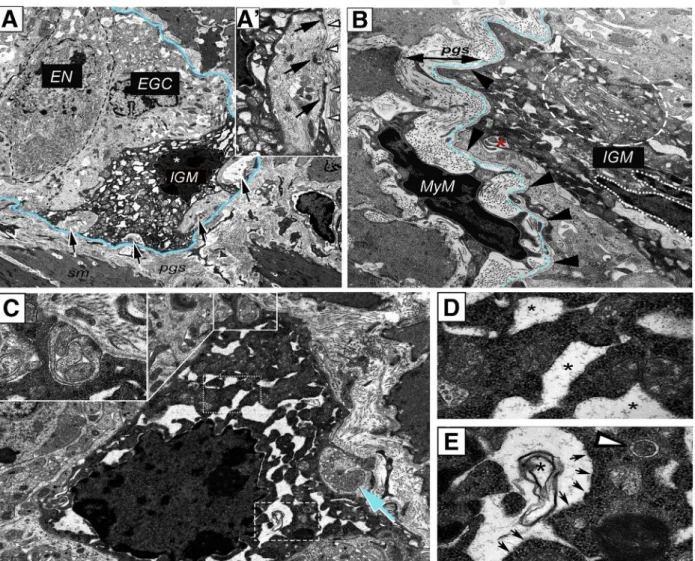
To study IGM ultrastructure and their microenviron- ment, electron microscopy was performed on the distal colon of mice. In the ganglia, enteric neurons (Figure 3A, dashed line) are characterized by a condensed cytoplasm, euchromatic nucleus, and prominent nucleoli. In con- trast, enteric glial cells exhibit a euchromatic nucleus, anchored heterochromatin, and a cytoplasm of lower den- sity (Figure 3A).12,13Enteric ganglia also contain electron- dense, highly vacuolated cells that display a distinct morphology from neural and glial cells. These are the IGMs (Figure 3A). Formation of pseudopodia around glial cell
processes (Figure 3A–A’, arrows) suggests a phagocytic function of the IGM. Despite signs of cellular degeneration, including swollen mitochondria (Figure 3A’) and massive cytoplasmic vacuolization, the nucleus of the IGM shows no sign of apoptosis (Figure 3A, asterisk).Figure 3Bshows the morphologic difference between periganglionic macro- phages and IGMs. The IGM is characterized by a low nu- cleus/cytoplasm ratio and a segmented non-apoptotic nucleus. IGMs also exhibit an extensive Golgi and vesicular apparatus (Figure 3B, dashed circle) and active formation of phagocytic vesicles (Figure 3B, asterisk). Some IGMs display mostly empty vacuoles (Figure 3C, dotted rectangle;
Figure 3D, asterisks), with lined-up ribosomes on the edge
web4C=FPO
Figure 3.Ultrastructure of IGMs in the mouse colon.Low magnification image of a myenteric ganglion (A) shows electron- dense IGM, displaying distinct morphology from enteric glial cells (EGC) and enteric neurons (EN).Dashed linelabels EN with condensed cytoplasm. IGM (* marks IGM nucleus) shows active phagocytosis, with multiple pseudopodia around glial cell processes (A–A’,arrows). IGM is situated internal to the basement membrane of the enteric ganglion (A, blue line;A’, ar- rowheads). Periganglionic MyM exhibits a high nucleus/cytoplasm ratio, in contrast to IGM, which is characterized by hy- pertrophic cytoplasm, abundant mitochondria, extensive vacuolization, and well-developed Golgi apparatus (B, encircled area). A phagocytic vesicle is seen (B, asterisk). The ganglionic basement membrane is continuous and uninterrupted on external surface of IGM (B,arrowheads, with basement membrane located underdashed blue line). IGMs exhibit mostly empty vacuoles (C, dotted line; enlarged inD, where vacuoles are marked byasterisks), with lined-up ribosomes on their borders (E, arrows) and occasional membranous whorls are present (C, dashed line; enlarged in E, asterisk). Evidence of phagocytic activity is seen in IGM (C,insetandarrow), but autophagosomes are rarely seen (E,arrowhead). EGC, enteric glial cell; EN, enteric neuron.
471 472473 474475 476 477478 479480 481482 483484 485486 487 488489 490491 492493 494495 496497 498 499500 501502 503 504505 506507 508 509510 511512 513514 515516 517518 519 520521 522523 524525 526527 528529
530 531532 533534 535 536537 538539 540541 542543 544545 546 547548 549550 551552 553554 555556 557 558559 560561 562 563564 565566 567 568569 570571 572573 574575 576577 578 579580 581582 583584 585586 587588
(Figure 3C, dashed rectangle;Figure 3E, arrows) and occa- sionally filled with membranous whorls (Figure 3E, asterisk). Signs of pseudopodia and phagosome formation are present in the IGM (Figure 3C, inset). Although an oc- casional autophagosome is seen (Figure 3E, arrowhead), the IGMs show no morphologic signs of significant autophago- some formation.
Enteric Ganglia Are Surrounded by a Barrier Formed By ECM and Glial End-Feet
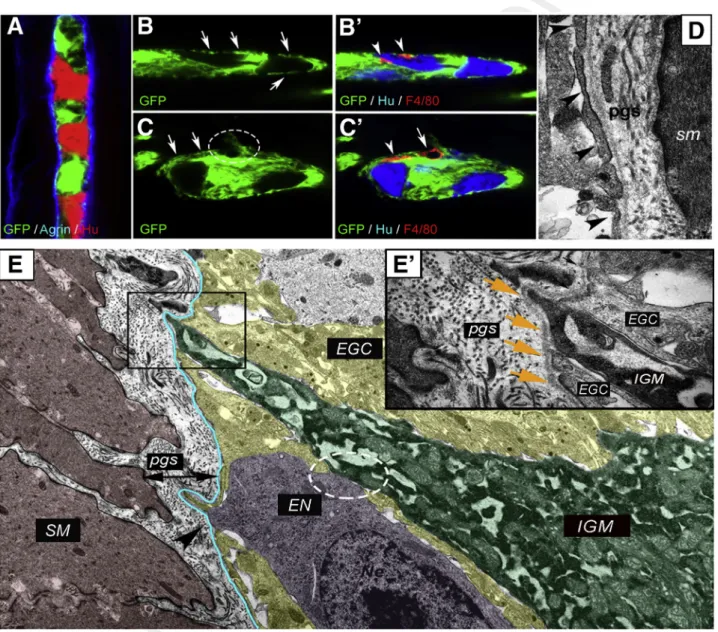
Immunofluorescence was performed on the distal colon of PLP1GFP mice (Figure 4A–C’). Proteolipid protein 1 is expressed by enteric glial cells.30Confocal imaging reveals that GFPþenteric glia establish an almost continuous layer of glial end-feet (Figure 4A) internal to the agrin-expressing ECM layer (Figure 4A). IGMs are located internal to this glial
web4C=FPO
Figure 4.Morphology of glial limiting membrane and enteric ganglion basement membrane in the mouse colon.An enteric ganglion in the distal colon of a PLP1GFP mouse shows GFP-expressing glial cells, agrin-expressing ganglionic basement membrane, and Huþ neurons (A). Glial end-feet establish a continuous layer around the enteric ganglia, occa- sionally interrupted by small gaps (B, arrows). F4/80þ IGMs are located internal to the glial end-feet (B’, arrowheads) and among Huþenteric neurons. Disruption of glial end-feet (C, encircled area) is present at suspected entry points of F4/80þ macrophages (C’, arrow). Continuity of the glial end-feet is intact around the macrophage process (C’, arrowhead) but not around its cell body (C’, arrow). Electron micrograph of PGS shows structure of the enteric ganglion barrier, formed by a layer of glial end-feet (D, arrowheads) and the basement membrane. In the microenvironment of an IGM (E, green shaded area), the ganglionic barrier includes glial cells (EGC; yellow shaded area) and ganglionic basement membrane (blue line). High magnification image shows IGM between 2 glial end-feet, delineated from the PGS by a continuous basement membrane (E, squared area is magnified inE’, wherearrowsdenote basement membrane). Enteric neuron (E, magenta shaded area) establishes physical contact with IGM (E, circled area) and disrupts the continuous glial end-feet layer at suspectedfiber exit point (E, arrowhead). EGC, enteric glial cell; EN, enteric neuron; SM, smooth muscle.
589 590591 592593 594 595596 597598 599600 601602 603604 605 606607 608609 610611 612613 614615 616 617618 619620 621 622623 624625 626 627628 629630 631632 633634 635636 637 638639 640641 642643 644645 646647
648 649650 651652 653 654655 656657 658659 660661 662663 664 665666 667668 669670 671672 673674 675 676677 678679 680 681682 683684 685 686687 688689 690691 692693 694695 696 697698 699700 701702 703704 705706
barrier (Figure 4B’, arrowheads), intermingling with Huþ enteric neurons. At sites where glial end-feet disruption occurs (Figure 4C, circle), an F4/80þ macrophage is seen (Figure 4C’, arrow). Interestingly, the continuity of glial end- feet is present around the process of the same macrophage (Figure 4C, arrows;C’, arrowhead) but not around its cell body (Figure 4C, circle; C’, arrow). Figure 4D shows the ultrastructure of the glial end-feet (arrowheads), with the continuous ganglionic basement membrane and the PGS surrounding it. IGMs in the ganglionic microenvironment are adjacent to enteric glial cells and enteric neurons (Figure 4E). Although glial end-feet closely bound the IGMs inside the ganglion, they do not entirely separate them from the PGS (Figure 4E’). As can be seen, the continuity of the glial end-feet layer is interrupted by IGMs (Figure 4E, boxed area) and also by enteric neurons, most likely at sites where neural fibers exit the ganglion (Figure 4E, arrowhead).
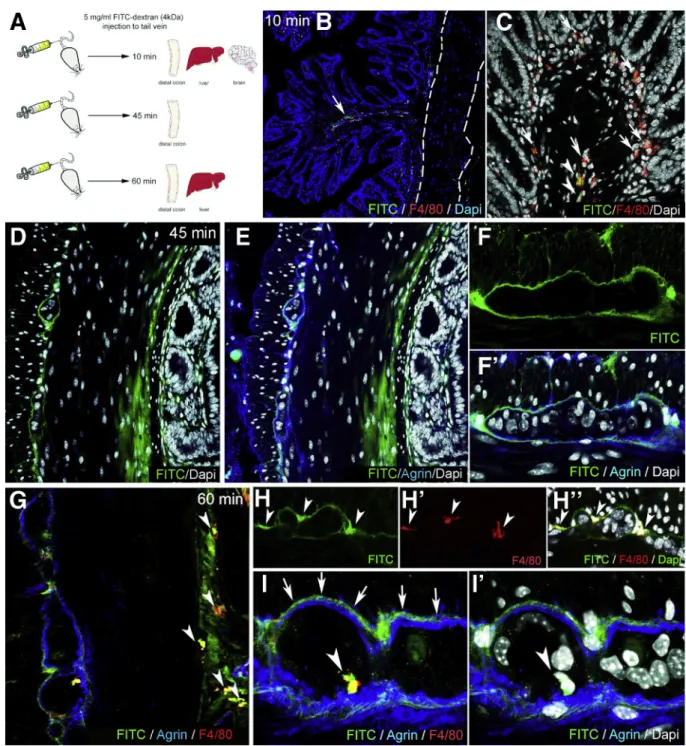
FITC-dextran assays were performed to assess the bar- rier function of the ECM and glial end-feet around the enteric ganglia, because this is reminiscent of the BBB. FITC- dextran 4kDa was injected into the tail vein of wild-type C57BL/6 mice. Animals were killed after 10 minutes, and the distal colon, liver, and cerebellum were removed (Figure 5A). At 10 minutes after FITC administration,fluo- rescent particles are scattered in the submucosa and mu- cosa of the gut (Figure 5B) and around blood vessels (Figure 5B, arrow), whereas the muscularis shows no green fluorescence (Figure 5B, dashed lines). At this time point, only a few F4/80þcells co-localize with FITC (Figure 5C, arrowheads), whereas most macrophages do not contain fluorescent particles (Figure 5C, arrows). In the liver where capillaries are discontinuous, having 30- to 40-mm diameter openings in their endothelium, diffuse green fluorescent signal is already present at 10 minutes (Figure 6A), with only scattered expression in the colonic mucosa of the same animal (Figure 6B). FITC signal was not detected in the cerebellar interstitium of experimental mice (Figure 6C). At 45 minutes after FITC injection, signal is present in all layers of the gut wall but not within the enteric ganglia (Figure 5D–F). As shown in Figure 5F–F’, fluorescence surrounds the agrin-expressing borders of the enteric ganglia and diffusely stains the PGS, but no fluorescence is detected in the intraganglionic space. After 60 minutes, intestinal F4/80þ macrophages contain phagocytosed FITCþ particles (Figure 5G, arrowheads).
Diffuse FITC signal in the PGS persists, and MyMs incor- porate fluorescent particles as well (Figure 5H–H”, ar- rowheads). Interestingly, at 60 minutes, F4/80þIGMs also contain FITC (Figure 5I–I’, arrowheads). Because FITC molecules normally cannot penetrate the ganglionic bar- rier (Figure 5I, arrows), the presence of FITC in the gan- glion suggests that IGMs, capable of phagocytosis, enter the ganglia from the PGS. At 60 minutes after FITC injection, all F4/80þKupffer cells in the liver arefilled withfluorescent label (Figure 6D), and high levels of macrophage-FITC co- localization are also present in the colon (Figure 6E–E”).
Thesefindings are strongly suggestive of the presence of a BMB.
DSS-Induced Colitis Induces Degradation of the Periganglionic ECM via a M1-Macrophage- Dependent Process
DSS induces experimental colitis by disrupting the in- testinal epithelial barrier.27 Treatment with liposome- encapsulated clodronate (L-clodronate) produces tempo- rary depletion of tissue and blood mononuclear phago- cytes.28Thus, induction of DSS colitis followed by treatment with L-clodronate blocks macrophage recruitment by depleting the monocyte pool in the blood and bone marrow, thereby allowing us to study colitis in the absence of mac- rophages (Figure 7A). Figure 7B and D show the typical colonic shortening associated with colitis and its reversal in mice treated with clodronate. General inflammatory signs, such as muscularis thickening (Figure 7C), and disease ac- tivity index (Figure 7E) all show significant improvement in animals receiving L-clodronate treatment. Figure 7Fshows the histology of the colon after DSS treatment and with concurrent DSS-clodronate administration. Whereas the ECM barrier surrounding the enteric ganglia normally con- tains a continuous layer of agrin and Col4 (Fig. 7G–G’), DSS- induced acute colitis is associated with degradation of this ECM barrier and extensive infiltration of F4/80þ macro- phages (Figure 7H–H’andJ), including IGM infiltration into the Huþenteric ganglia (Figure 7H, inset). Interestingly, the agrin expression in the vascular basement membrane of muscularis vessels remains intact (Figure 7H’, arrowhead).
In the inflammatory infiltrate 2 types of F4/80þ cells are distinguishable according to cellular morphology31: rami- fied, bipolar, or stellate-shaped MMs (Figure 7H’, inset) and round monocytes with kidney-shaped nuclei (Fig 7H’, inset).
L-clodronate treatment, which depletes macrophages from the muscularis propria, leads to preservation of normal ECM patterning, with intact agrin and Col4 expression in the BMB (Figure 7I–I’andJ). The increased density of F4/80þMMs (Figure 7K) and IGMs (Figure 7LandM) observed after DSS treatment is not seen with L-clodronate treatment. No sig- nificant difference was found in the relative distribution of MMs in different layers of the gut wall (Figure 7N).
Neutrophil In
filtration Is Not Required for
Colitis-Induced Degradation of the Enteric Ganglia
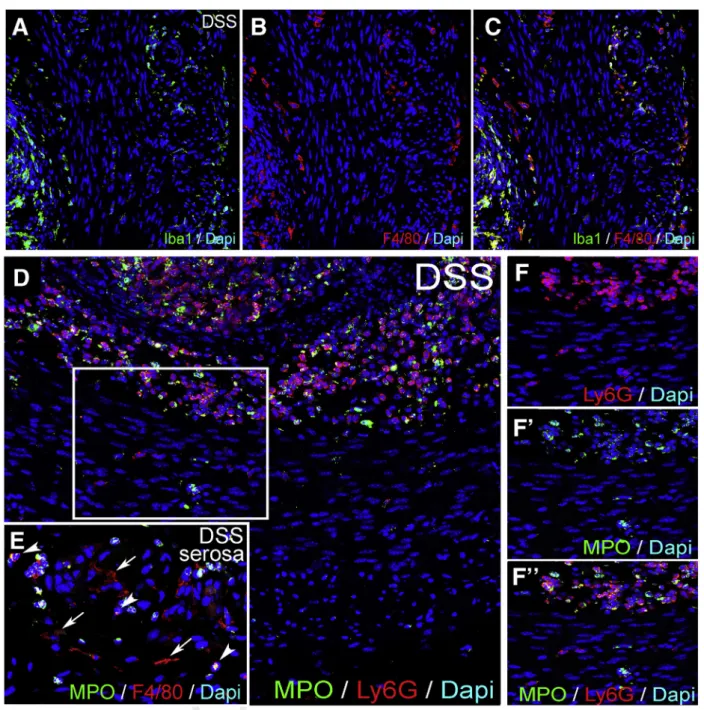
To understand to what extent neutrophils contribute to inflammation in the muscularis propria during DSS-colitis, we performed quantitative polymerase chain reaction (qPCR) and immunofluorescence with the neutrophil markers Ly6G and MPO. Ly6G RNA expression was increased in whole gut and isolated muscularis after DSS, but not after concurrent L-clodronate treatment (Figure 8A and B). The mucosa and submucosa both exhibit massive infiltration of Ly6G-expressing neutrophils, comparable to the number of Iba1þmacrophages (Figure 8I). In contrast, the muscularis only has a modest infiltration of Ly6Gþcells compared with MMs (Figure 8I’,R, andS). Note that Iba1 is used as a marker for F4/80þ macrophages because their cellular expression in the muscularis overlaps completely (Figure 9A–C). No Ly6Gþneutrophils are detected adjacent to or within enteric ganglia (Figure 8I’, inset). Very few 707708709 710711 712 713714 715716 717718 719720 721722 723 724725 726727 728729 730731 732733 734 735736 737738 739 740741 742743 744 745746 747748 749750 751752 753754 755 756757 758759 760761 762763 764765
766 767768 769770 771 772773 774775 776777 778779 780781 782 783784 785786 787788 789790 791792 793 794795 796797 798 799800 801802 803 804805 806807 808809 810811 812813 814 815816 817818 819820 821822 823824
Ly6Gþ cells are detected in the muscularis propria of the colon of control animals (Figure 8Rand S), and only a low number are present in DSSþL-clodronate treated mice (Figure 8R and S), mostly neutrophils in the mucosa (Figure 8O). Double staining with anti-myeloperoxidase antibody shows that the majority of Ly6Gþ neutrophils
coexpress myeloperoxidase in all layers of the inflamed gut (Figure 9D–F”). In summary, neutrophil infiltration is high in the mucosal and submucosal layers of the gut during DSS colitis but less so in the muscularis propria, where Ly6Gþ cells do not appear to interact physically with the enteric ganglia as the macrophages do.
web4C=FPO
Figure 5.Enteric ganglia are surrounded by a protective myenteric plexus barrier.Schematic drawing shows experi- mental design of FITC-dextran assays, where wild-type C57BL/6 mice receive intravenous FITC-dextran (50 mg/mL) and are killed 10, 45, and 60 minutes later (A). At 10 minutes after FITC-dextran loading, scattered greenfluorescence is present in the lamina propria (B, arrow) but not the muscularis propria (B, dashed line). Most F4/80þ macrophages in the colon do not contain FITC particles (C, arrows), but some do (C, arrowheads). At 45 minutes after injection, diffuse FITC signal appears in the mucosa and submucosa (DandE). Strong FITC signal is also present around the enteric ganglia but not within them (F–F’).
At 60 minutes, F4/80þmacrophages contain FITC (G, arrowheads). MyMs expressing FITC are seen in the PGS (H-H”, ar- rowheads; I, arrows), and FITC-loaded IGMs have entered into the intraganglionic compartment (I–I’,arrowhead).
825 826827 828829 830 831832 833834 835836 837838 839840 841 842843 844845 846847 848849 850851 852 853854 855856 857 858859 860861 862 863864 865866 867868 869870 871872 873 874875 876877 878879 880881 882883
884 885886 887888 889 890891 892893 894895 896897 898899 900 901902 903904 905906 907908 909910 911 912913 914915 916 917918 919920 921 922923 924925 926927 928929 930931 932 933934 935936 937938 939940 941942
Dynamic Changes in Macrophage Polarization Occur in the Muscularis in the Setting of Colitis
Colitis was previously shown to be associated with a shift to M1-macrophage polarization32,33 and increased expression of inflammatory mediators.34,35 Expression of inducible nitric oxide synthase (iNOS) (a marker of M1- polarization36) significantly increases in whole colon and isolated muscularis of DSS-treated mice and reverts to baseline in DSSþL-clodronate treated animals (Figure 8C and D). Interestingly, RNA expression of M2-polarization markers CD163 and ARG136 show no significant change during the course of DSS treatment or concurrent L-clodr- onate injection (Figure 8E–H). Immunofluorescence for iNOS in DSS-treated mice reveals expression in clusters of F4/80þ macrophages and monocytes in the mucosa (Figure 8J), submucosa (Figure 8J’), and serosa (Figure 8J”).
A few F4/80-negative cells also express iNOS (Figure 8J, asterisks). After DSS, iNOS is expressed in 31 % (Figure 8Q) of F4/80þMMs (Figure 8K–K’, arrowheads) and monocytes (Figure 8K”, arrowheads), whereas 69 % of F4/80þcells do not express iNOS (Figure 8K’, arrow, andQ’). Interestingly, multiple CD45-negative non-hematopoietic cells express iNOS in the inflamed colon (Figure 8M, arrows), instead expressing smooth muscle actin (Figure 8N). Area-adjusted
cell counting reveals that 59 % of iNOSþcells in the mus- cularis after DSS treatment are SMAþsmooth muscle cells (Figure 8Q). If DSS treatment is interrupted by L-clodronate administration, the number of iNOSþcells significantly de- creases in the muscularis (Figure 8RandS), leaving 96 % of F4/80þ cells iNOS– (Figure 8Q’), and of the remaining iNOSþcells, 93 % are smooth muscle cells (Figure 8Pand Q). Quantitative data on cell counting are shown in Supplementary Material. Our findings reveal that iNOS expression significantly increases in the colonic muscularis, where, in addition to macrophages, smooth muscle cells also express the molecule. Furthermore, L-clodronate treatment reverses the shift toward M1-polarization in the muscularis propria but does not affect M2-associated molecular markers such as ARG-1 and CD163.
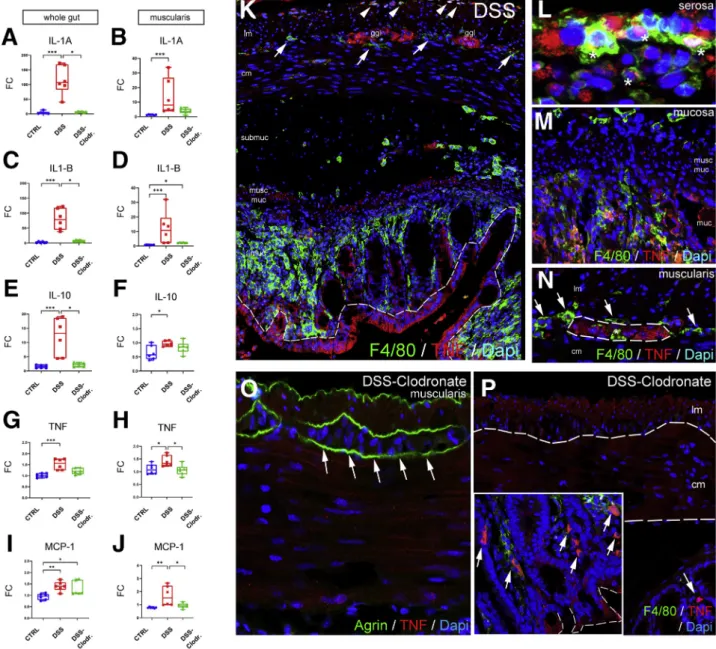
Along with M1 macrophage polarization, the RNA expression of proinflammatory cytokines interleukin (IL) 1A, IL1B, tumor necrosis factor (TNF) alpha, and monocyte chemoattractant protein-1 (MCP-1) all show significant in- creases as a consequence of DSS treatment (Figure 10A,C,G, and I). Interestingly, the inflammation is not limited to the mucosa, because isolated muscularis tissue exhibits simi- larly elevated RNA expression for these markers (Figure 10B, D, H, and J). IL10 has been shown to be
web4C=FPO
Figure 6.FITC-dextran assays: control organs.At 10 minutes after FITC injection, diffusefluorescence is present in the liver (A), but only scattered FITC particles are visible in the colon of the same animal (B), and no FITC is seen in the cerebellum (C). Agrin is expressed around blood vessels (C, arrowheads) and in the external glial limiting membrane (C, arrows). At 60 minutes after FITC administration, most Kupffer cells incorporate FITC in the liver (D). In the colon, diffuse interstitial FITC signal is present in the mucosa and submucosa (E) and in most F4/80þmacrophages (E’–E”).
943 944945 946947 948 949950 951952 953954 955956 957958 959 960961 962963 964965 966967 968969 970 971972 973974 975 976977 978979 980 981982 983984 985986 987988 989990 991 992993 994995 996997 998999 10001001
1002 10031004 10051006 1007 10081009 10101011 10121013 10141015 10161017 1018 10191020 10211022 10231024 10251026 10271028 1029 10301031 10321033 1034 10351036 10371038 1039 10401041 10421043 10441045 10461047 10481049 1050 10511052 10531054 10551056 10571058 10591060
expressed in the gut mucosa at later stages of colitis to initiate fibrosis and regeneration in severely inflamed tis- sues.35Here IL10 RNA levels increase more than 10-fold in
whole gut (Figure 10E) and slightly in the muscularis (Figure 10F). Concurrent L-clodronate treatment decreases the expression of IL1A, IL1B, and IL10 significantly in whole
web4C=FPO
1061 10621063 10641065 1066 10671068 10691070 10711072 10731074 10751076 1077 10781079 10801081 10821083 10841085 10861087 1088 10891090 10911092 1093 10941095 10961097 1098 10991100 11011102 11031104 11051106 11071108 1109 11101111 11121113 11141115 11161117 11181119
1120 11211122 11231124 1125 11261127 11281129 11301131 11321133 11341135 1136 11371138 11391140 11411142 11431144 11451146 1147 11481149 11501151 1152 11531154 11551156 1157 11581159 11601161 11621163 11641165 11661167 1168 11691170 11711172 11731174 11751176 11771178
gut of experimental mice (Figure 10A, C, and E). In the muscularis, the reversal effect of L-clodronate is statistically significant for TNF and MCP-1 expression (Figure 10HandJ) but not for IL1A and IL1B expression (Figure 10B andD).
IL10 expression in the muscularis is not affected by L-clodronate treatment (Figure 10F).
Double immunofluorescence was performed to reveal the cell populations that express TNF, a master regulator of the inflammatory response. After induction of DSS co- litis, TNF protein is expressed by the mucosal epithelial lining37 (Figure 10K, dashed line), serosal F4/80þ cells (Figure 10K, arrowheads; and Figure 10L, asterisks), clusters of mucosal macrophages (Figure 10M), and enteric ganglia (Figure 10K and N, dashed line). Interest- ingly, F4/80þMyMs (Figure 10KandN, arrows) and IGMs (Figure 10N, asterisk) show no co-localization with TNF expression. In DSSþL-clodronate treated mice enteric ganglia do not express TNF (Figure 10O, arrows), whereas clusters of mucosal epithelial cells (Figure 10P, inset, dashed line) and F4/80þ macrophages (Figure 10P, ar- rows) show persistent TNF production despite L-clodro- nate treatment. In the absence of MMs, TNF production decreases in the muscularis, and the major source of TNF is not the macrophages, but rather the enteric ganglia. This finding implies an indirect crosstalk between these cell populations that is consistent with other studies in different contexts.2,18
Matrix Metalloproteinase 10 Shows Strong Expression in the Muscularis and Myenteric Plexus After DSS Treatment, Reversed by the Depletion of MMs
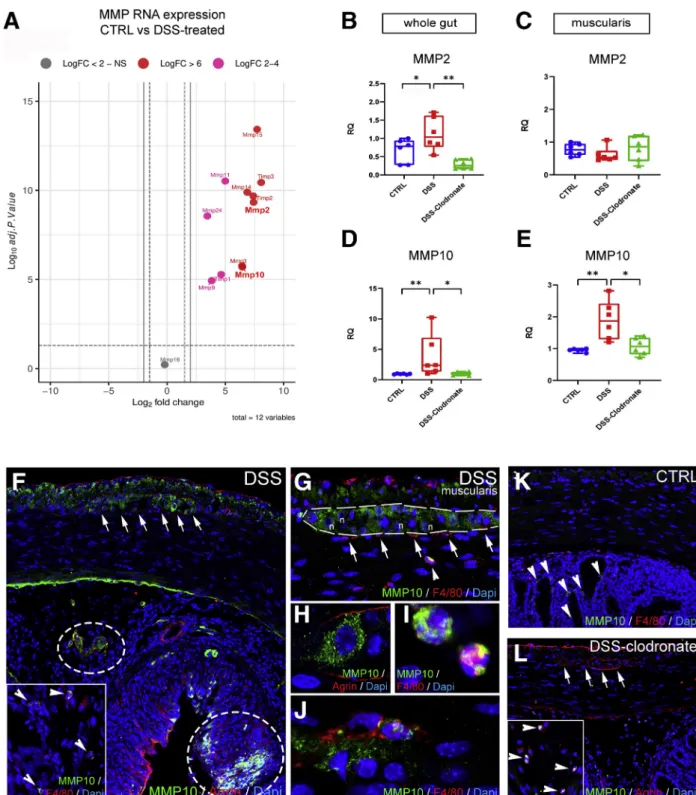
According to RNA sequencing analysis earlier reported (accession number : PRJNA687627) in DSS-treated vs con- trol mice, matrix metalloproteases (MMPs) are increased in colitis (Figure 11A,Table 1).38Collagen 4 is the substrate of
gelatinase MMP2, whereas agrin is the substrate of stro- melysin MMP10. According to qPCR, both MMPs exhibit increased RNA expression in the gut wall after DSS and return to baseline with L-clodronate injection (Figure 11B and D). In the muscularis specifically, MMP2 expression does not change significantly (Figure 11C), whereas MMP10 expression increases nearly 2-fold after DSS (Figure 11E).
DSS induces patchy expression of MMP10 protein in the mucosa and submucosa, co-localizing with agrin expression (Figure 11F, encircled areas) and with F4/80þ cells (Figure 11F, inset, arrowheads). In the muscularis, MMP10 is expressed diffusely in the longitudinal muscle layer and inside enteric ganglia (Figure 11F, arrows andG, dashed line). Apart from enteric neurons (Figure 11H), F4/
80þ monocytes (Figure 11G, arrowhead and I) and MMs (Figure 11J) also express MMP10. In contrast with DSS- treated animals, control (Figure 11K) and DSSþL- clodronate treated mice (Figure 11L) exhibit virtually no expression of MMP10 in the muscularis layer or in the enteric ganglia (Figure 11L, arrows), whereas scattered F4/
80-negative cells (Figure 11K, arrowheads) and F4/80þ monocytes (Figure 11L, arrowheads) express MMP10 in the mucosa of control and L-clodronate treated animals, respectively.
DSS-Induced Colitis Disrupts the Ganglionic Basement Membrane Causing BMB Dysfunction
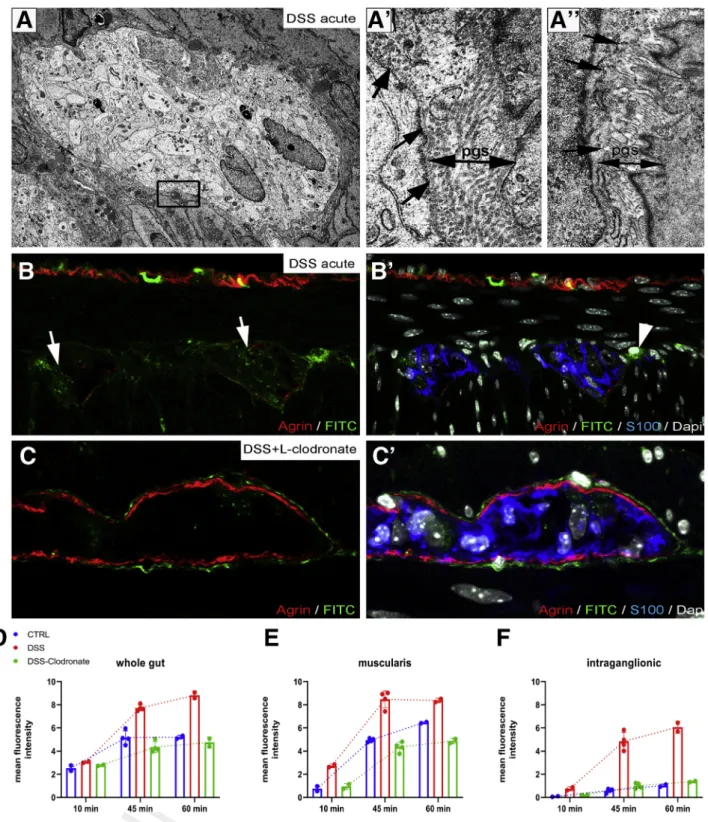
Electron microscopy of enteric ganglia in DSS-treated mice (Figure 12) reveals the disruption (Figure 12, boxed area,Figure 12A’, arrows) or absence (Figure 12A”, arrows) of the ganglionic basement membrane and the accumula- tion of collagenfibers in the PGS (Figure 12A’). To test the functional integrity of the BMB barrier in colitis, we injected DSS- and DSSþL-clodronate treated mice on day 7 with FITC dextran as described above and removed the
Figure 7.(See previous page).DSS treatment leads to colitis and disruption of periganglionic ECM via a macrophage- dependent mechanism. Schematic drawing shows experimental design of DSS treatment and concurrent L-clodronate administration (A). Colonic shortening characteristic of DSS-induced colitis was observed, but not in mice receiving clodronate treatment (BandD). Muscularis propria was thickened in DSS-treated mice compared with controls (172±11.6 vs 136.8± 18.8mm,P¼.003;C) and with clodronate treated mice (F; 172±11.6 vs 124.2±15.7mm,P¼.022;C). Radar chart shows higher disease activity index (DAI) scores in DSS versus controls (2±0.8 vs 0,P<.001) and clodronate treated animals (2± 0.8 vs 0.4±0.5,P¼.003;E). L-clodronate treatment ameliorates DSS-induced colitis based on histopathologic assessment with H&E staining (F). Agrin (G) and Col4 (G’) are normally expressed around the enteric ganglia but are severely disrupted after 7 days of DSS treatment (HandH’). DSS colitis is associated with extensive F4/80þmacrophage infiltration in the distal colon, including within the ganglia (H, inset; H’, arrowhead). In animals treated with liposomal clodronate during DSS administration, macrophages are absent from the muscularis propria (I–I’). Although inflammatory signs are still present in the mucosa and lamina propria, normal ECM patterning is preserved, with intact agrin and Col4 around the ganglia (I–I’). DSS leads to agrin degradation in the BMB, where 61 % and 22 % of enteric ganglia exhibit a degraded or semi-degraded agrin layer, respectively, and only 16 % remain intact. In clodronate treated mice, only 17 % and 8 % of enteric ganglia have a degraded or semi-degraded periganglionic agrin layer, respectively, with 75 % intact (J). F4/80þMM density was significantly increased in DSS-treated mice compared with controls (213.9 ±39 vs 70.4±28.9 cell/mm2,P<.001;K) and clodronate treated mice (213.9±39 vs 66.9±19 cell/mm2,P<.001;K). Cellular density of IGMs adjusted to muscularis area was increased after DSS- colitis compared with controls (6.3±1.8 vs 1.9±0.8 cell/mm2,P<.001;L) and clodronate treated animals (H; 6.3±1.8 vs 1.5
±1.1 cell/mm2,P¼.002;L). DSS treatment also increased IGM density in DSS-treated compared with control mice (174.9± 47.7 vs 81.5±28.7 cell/mm2,P¼.003) and with clodronate treated mice (174.9±47.7 vs 35.7±24.4 cell/mm2,P<.001) when adjusted to total myenteric ganglion area (M). Relative distribution of MMs in different anatomic layers did not differ among groups (N). cm, circular muscle; DAI, disease activity index; lm, longitudinal muscle; lp, lamina propria; mp, myenteric plexus; sm, submucosa.
1179 11801181 11821183 1184 11851186 11871188 11891190 11911192 11931194 1195 11961197 11981199 12001201 12021203 12041205 1206 12071208 12091210 1211 12121213 12141215 1216 12171218 12191220 12211222 12231224 12251226 1227 12281229 12301231 12321233 12341235 12361237
1238 12391240 12411242 1243 12441245 12461247 12481249 12501251 12521253 1254 12551256 12571258 12591260 12611262 12631264 1265 12661267 12681269 1270 12711272 12731274 1275 12761277 12781279 12801281 12821283 12841285 1286 12871288 12891290 12911292 12931294 12951296
distal colon after 15, 45, and 60 minutes. After 60 minutes, FITC particles penetrate the disrupted BMB, with increased intraganglionic fluorescence in DSS-treated animals (Figure 12B–B’) as compared with untreated controls (Figure 5I–I’). In contrast, animals receiving both DSS and L-clodronate show accumulation of FITC only around the enteric ganglia but not within them (Figure 12C–C’).
Figure 12D–F shows the meanfluorescent intensity curve measured in whole gut cross sections, muscularis, and intraganglionic areas after 10, 45, and 60 minutes of FITC injection. Note the significant increase in intraganglionic fluorescence after DSS treatment as compared with control and DSSþL-clodronate treatment (Figure 12F).
web4C=FPO
1297 12981299 13001301 1302 13031304 13051306 13071308 13091310 13111312 1313 13141315 13161317 13181319 13201321 13221323 1324 13251326 13271328 1329 13301331 13321333 1334 13351336 13371338 13391340 13411342 13431344 1345 13461347 13481349 13501351 13521353 13541355
1356 13571358 13591360 1361 13621363 13641365 13661367 13681369 13701371 1372 13731374 13751376 13771378 13791380 13811382 1383 13841385 13861387 1388 13891390 13911392 1393 13941395 13961397 13981399 14001401 14021403 1404 14051406 14071408 14091410 14111412 14131414
DSS Colitis Is Associated With Enteric Neuroin
flammation, Including Neural
Hypertrophy, Glial Swelling, and Submucosal Plexus Degeneration
In addition to infiltration of the muscularis by a variety of immune cells, DSS colitis also causes significant morphologic changes inside the myenteric plexus. Enteric glial cells, which create the glial limiting membrane, rear- range from a parallel (Figure 4D, arrowheads) to perpen- dicular orientation (Figure 13A, yellow shaded area) relative to the ganglionic basement membrane (Figure 13A, blue dashed line). Moreover, after DSS, glia exhibit a swollen morphology compared with control (Figure 13B and C).
Enteric neurons (Figure 13D, magenta shaded area) ac- quire multiple lipid droplets (Figure 13D, arrows and F, asterisks), many mitochondria (Figure 13E, asterisks), and increased rough endoplasmic reticulum
Q8 (Figure 13F, arrow).
Morphometry identifies a significant increase in myenteric ganglion density (Figure 13H), without a concomitant in- crease in neural cell density (Figure 13G) or neurons per ganglion (Figure 13I). The colitis-associated hyper- ganglionosis is reversed by concurrent L-clodronate treat- ment (Figure 13H). Interestingly, DSS treatment causes a sharp decline in the number of submucosal neurons, and this returns to baseline with L-clodronate treatment (Figure 13J).
Discussion
We describe the existence of a physical BMB at an ul- trastructural level that is composed of ECM proteins (agrin and Col4) and enteric glial end-feet reminiscent of the BBB.
MyMs were observed to actively transmigrate through the BMB and transform into morphologically distinct IGMs, suggesting these cells are capable of BMB remodeling. The BMB was demonstrated to possess a functional role, as shown by its ability to restrict the entry of 4 kDa dextran
into the myenteric plexus. During conditions of inflamma- tion, the integrity of the BMB was compromised via degra- dation of its ECM constituents in a macrophage-dependent manner. These data for the first time demonstrate that the myenteric plexus can be directly exposed to extra-ganglionic factors during inflammation and offer a mechanism for enteric neuroinflammation and dysfunction in chronic in- flammatory GI disorders.
The BBB serves to restrict the passage of cells, proteins, pathogens, and PAMPs between the blood and CNS micro- environment to protect the brain from inflammation and injury. We find that the structures of the BMB are remi- niscent of those of the BBB. The BBB is composed of a continuous layer of glial end-feet39 called the limiting glial membrane,40ECM proteins, and a basement membrane between the processes of astrocytes and the non- fenestrated endothelial cells.41 Similarly, enteric ganglia are separated from the surrounding interstitial tissues of the gut wall by layers of cellular and ECM components. End- feet of PLP1þenteric glial cells organize into a cellular layer surrounded externally by a ganglionic basement membrane that expresses agrin and Col4. Interestingly, the molecular structure of this barrier resembles the external glial limiting membrane of the BBB, with both possessing strong agrin expression. Of note, in vertebrate development, agrin accu- mulates on brain capillaries around the time when the vasculature becomes impermeable.42,43 Because agrin knockout mice die at birth and ENS-specific deletion of agrin is not available, no study has examined the alterations spe- cific to the ENS-associated ECM in inflammation and injury.
Previous studies have shown that the impenetrable perineurium that surrounds peripheral ganglia is absent in the ENS.23The microenvironment of the avascular enteric ganglia and nervefibers are exposed to extracellularfluid by permeable blood vessels present in adjacent tissues of the gut.24 The permeability of this barrier was tested using
Figure 8.(See previous page).DSS treatment is associated with neutrophil infiltration and increases expression of iNOS in macrophages and smooth muscle cells in a macrophage-dependent fashion. Graphs show relative RNA expression (fold change, FC) of macrophage and neutrophil markers in whole gut and isolated muscularis samples. Quanti- tative PCR shows significantly higher expression of neutrophil marker Ly6g in DSS-treated vs control (1.82 vs 0.66,P¼.02;A) and vs DSSþclodronate treated (1.82 vs 0.31,P<.001;A) mice in whole gut and DSS-treated vs control (3.47 vs 1.08,P<
.001;B) muscularis. M1-macrophage marker iNOS RNA is significantly overexpressed in DSS-treated vs control (4.24 vs 0.87, P<.001;C) and vs DSSþclodronate treated animals (4.24 vs 1.53,P¼.045;C) in whole gut and in muscularis (2.45 vs 0.97, P ¼.02, and 2.45 vs 0.78, P< .001;D), respectively. M2-macrophage markers CD163 and ARG1 showed no significant difference (E–H). Immunofluorescence shows that in DSS-treated animals, Ly6Gþneutrophils are predominant in the mucosa and submucosa (I) but only slightly increased in the muscularis (I’, arrowheads), where Iba1þmacrophages dominate. Ly6G expression does not co-localize with Iba1 (I–I’). In the mucosa, submucosa, and serosa, iNOS is expressed in F4/80þ monocytes (J–J”, arrowheads) and occasionally in macrophages (J, arrow) and F4/80- cells (J, asterisk). In the muscularis, F4/
80þmacrophages (K–K’, arrowheads), monocytes (K”, arrowheads), and CD45-negative non-hematopoietic cells express the iNOS protein (M, arrows). Multiple CD45þ cells do not express iNOS (M, arrowhead). iNOS (L, arrows) is not expressed in Ly6Gþneutrophils (L, arrowheads) in the muscularis layer. Double labeling with SMA shows smooth muscle expression of iNOS (N, dashed line). With concurrent L-clodronate administration, DSS-treated mice exhibit a low number of Ly6Gþneu- trophils restricted to the submucosa (O, arrowheads) and a decreased number of iNOSþsmooth muscle cells in the mus- cularis (P, arrowheads). According to area-adjusted cell counting in the muscularis, 59 % of iNOSþcells are smooth muscle cells, whereas only 41 % are F4/80þ(Q). In contrast, in L-clodronate treated mice, only 7 % of iNOS-expressing cells are F4/
80þ; 93 % are SMAþsmooth muscle cells (Q). In a different comparison, 31 % of F4/80þcells are iNOS-positive after DSS treatment, whereas only 4 % in the presence of L-clodronate (Q’).RandSshow the comparison of cell densities of F4/80, Ly6G, and iNOS positive cells in the muscularis layer in the different experimental groups. Bar charts show data for cell counting, including means and standard deviation; *P< .05, **P< .01, ***P< .001. Box and whisker plots (minimum-to- maximum) show median of fold change values with 95 % confidence intervals. *P<.05, **P<.01, ***P<.001.
1415 14161417 14181419 1420 14211422 14231424 14251426 14271428 14291430 1431 14321433 14341435 14361437 14381439 14401441 1442 14431444 14451446 1447 14481449 14501451 1452 14531454 14551456 14571458 14591460 14611462 1463 14641465 14661467 14681469 14701471 14721473
1474 14751476 14771478 1479 14801481 14821483 14841485 14861487 14881489 1490 14911492 14931494 14951496 14971498 14991500 1501 15021503 15041505 1506 15071508 15091510 1511 15121513 15141515 15161517 15181519 15201521 1522 15231524 15251526 15271528 15291530 15311532
horseradish peroxidase (34 kDa) and Evans blue labeled albumin (69 kDa) by Gershon and Bursztajn,25and no tracer molecules were detected around or inside the myenteric plexus after 45 minutes. This led those investigators to hypothesize the presence of a blood-myenteric plexus bar- rier to macromolecular diffusion. To assess the barrier function of the ganglionic basement membrane more directly, we injected FITC-dextran of a lower molecular weight (4 kDa) rather than albumin or horseradish peroxi- dase. This low molecular size FITC-dextran is able to leak out from myenteric plexus capillaries, leading to the inter- stitial accumulation offluorescent particles in the PGS. FITC-
dextran loadings supported the observation of Gershon and Bursztajn that the outer boundary of the enteric ganglia is indeed impermeable. Thus the BMB is able to restrict the passive transport of 4 kDa particles. Interestingly, some IGMs containing FITC-dextran particles were observed in the impermeable myenteric plexus 15 minutes after MyMs acquired FITC expression. Although sensory dorsal root and autonomic ganglia include blood vessels where monocytes can exit via diapedesis directly into the neuronal tissue,44 blood and lymphatic vessels are not present inside enteric ganglia.23,24This suggests that MMs actively took up FITC- dextran particles and brought them into the myenteric
web4C=FPO
Figure 9.Iba1 and MPO expression in DSS-treated colon.Expression of Iba1 and F4/80 is co-localized in the colon of a DSS-treated mouse (A–C). Expression of MPO overlaps with Ly6G in neutrophils of the mucosa and submucosa (D), whereas some Ly6Gþcells in the muscularis propria do not express MPO (F–F”). In the serosa, ramified F4/80þmacrophages are MPO-negative (E, arrows), whereas round F4/80þmonocytes express MPO (E, arrowheads). MPO, myeloperoxidase. Q10 1533
15341535 15361537 1538 15391540 15411542 15431544 15451546 15471548 1549 15501551 15521553 15541555 15561557 15581559 1560 15611562 15631564 1565 15661567 15681569 1570 15711572 15731574 15751576 15771578 15791580 1581 15821583 15841585 15861587 15881589 15901591
1592 15931594 15951596 1597 15981599 16001601 16021603 16041605 16061607 1608 16091610 16111612 16131614 16151616 16171618 1619 16201621 16221623 1624 16251626 16271628 1629 16301631 16321633 16341635 16361637 16381639 1640 16411642 16431644 16451646 16471648 16491650
plexus from the PGS, indicating that MyMs traffic into the ganglia through the BMB in physiological conditions.
Although these data suggest that MMs are capable of trafficking in and out of the enteric ganglia, IGMs are unique and undergo several structural changes. Inside the ganglia, IGMs exhibit signs of cellular degeneration, including extensive cytoplasmic vacuolization and accumulation of swollen mitochondria with no morphologic signs of
apoptosis. IGMs show distinct ultrastructure from extra- ganglionic MyMs with an active translational machinery and Golgi apparatus. These features indicate that MyMs and IGMs may have different functions and roles in pathologic conditions. This is supported by similar phenomena in the sciatic nerve where transcriptionally unique perineurial and endoneurial macrophages are differentially activated in response to crush injury.45
web4C=FPO
Figure 10.Macrophages are required for muscularis propria expression of proinflammatory cytokines during DSS- induced colitis.Graphs show relative RNA expression (fold change, FC) of inflammation-related biomarkers in whole gut and isolated muscularis. qPCR shows significantly higher expression of IL1A (A), IL1B (C), and IL10 (E) in the whole gut after DSS treatment as compared with control and clodronate-treated groups. In muscularis samples, IL1A (B), IL1B (D), and IL10 (F) expression is significantly increased in DSS-treated vs control) but does not reach statistical significance compared with DSS- clodronate treatment. TNF (GandH) and MCP-1 (IandJ) expression is significantly increased in DSS-treated whole gut and muscularis. Immunofluorescence in DSS-treated mouse colon shows strong expression of TNF in the epithelium (K, dashed line), serosal monocytes and macrophages (L, asterisks), mucosal macrophages (M), and enteric ganglia (N, dashed line), but not in MMs (N, arrows) or IGMs (N, asterisk). With clodronate treatment, the muscularis and enteric ganglia show no immunoreactivity for TNF (O, arrows), only scattered F4/80þmacrophages (P, arrows), and clusters of epithelial cells in the mucosa (P, inset). Box and whisker plots (minimum-to-maximum) show median of fold change values with 95 % confidence intervals. *P<.05, **P<.01,
***P<.001. cm, circular muscle; ggl, ganglia; lm, longitudinal muscle; muc, mucosa; musc muc, muscularis mucosa.
1651 16521653 16541655 1656 16571658 16591660 16611662 16631664 16651666 1667 16681669 16701671 16721673 16741675 16761677 1678 16791680 16811682 1683 16841685 16861687 1688 16891690 16911692 16931694 16951696 16971698 1699 17001701 17021703 17041705 17061707 17081709
1710 17111712 17131714 1715 17161717 17181719 17201721 17221723 17241725 1726 17271728 17291730 17311732 17331734 17351736 1737 17381739 17401741 1742 17431744 17451746 1747 17481749 17501751 17521753 17541755 17561757 1758 17591760 17611762 17631764 17651766 17671768
web4C=FPO
Figure 11.Secretion of MMP10 by MMs and enteric ganglia contributes to BMB disruption in DSS-induced colitis.
Volcano plot shows that MMP expression is increased in DSS-treated animals compared with controls (A), including MMP2 (LogFc 7.42,P<.001) and MMP10 (LogFc 6.45,P<.001). Graphs show relative RNA expression (fold change, FC) of MMP2 and MMP10 in whole gut and isolated muscularis samples. MMP2 expression is significantly increased in whole gut of DSS- treated animals (B) but not in the muscularis (C), whereas MMP10 expression is elevated in both (D and E). MMP10 is expressed diffusely in the longitudinal muscle layer and inside enteric ganglia after DSS treatment (F, arrows). In the sub- mucosa and mucosa, MMP10 expression co-localizes with its substrate, agrin (F, circled areas) and F4/80þmonocytes and macrophages (F, arrowheads). In the muscularis, apart from enteric neurons (GandH), F4/80þmonocytes (G, arrowhead) and scattered MMs (J) express MMP10 but not MyMs or IGMs (F, arrows). In control guts, MMP10 is not expressed in the muscularis layer (K) but only in scattered F4/80-negative cells in the mucosa (K, arrowheads). In DSSþ clodronate treated animals, no MMP10 immunopositivity is detected in enteric ganglia or in the muscularis layer (L, arrows). In the submucosa small number of F4/80þmonocytes express MMP10 (L, arrowheads). Box and whisker plots (minimum-to-maximum) show median of FC values with 95 % confidence intervals. *P<.05, **P<.01, ***P<.001.
1769 17701771 17721773 1774 17751776 17771778 17791780 17811782 17831784 1785 17861787 17881789 17901791 17921793 17941795 1796 17971798 17991800 1801 18021803 18041805 1806 18071808 18091810 18111812 18131814 18151816 1817 18181819 18201821 18221823 18241825 18261827
1828 18291830 18311832 1833 18341835 18361837 18381839 18401841 18421843 1844 18451846 18471848 18491850 18511852 18531854 1855 18561857 18581859 1860 18611862 18631864 1865 18661867 18681869 18701871 18721873 18741875 1876 18771878 18791880 18811882 18831884 18851886
The presence of a subpopulation of macrophages inside the enteric ganglia is curious, and its functional importance requires elucidation. Interestingly, the immunophenotype of these IGMs is similar to that of microglial cells, including the expression of CX3CR1, Iba1, and CSF1R.21,46Microglia are the predominant immune cell in the brain parenchyma and play an important role in phagocytosis, neuroprotection during ischemia and inflammation,47 and synaptic prun- ing.48They also contribute to BBB homeostasis in steady- state and pathologic conditions.49The shared immunophe- notype of IGMs and microglia suggests potentially parallel functions in removing dead cells and modulating inflam- matory signaling in their respective nervous systems. In support of this, we observed that IGMs show active signs of phagocytosis, which is based on their subcellular charac- teristics on electron microscopy. This result is further reinforced by our finding that IGMs pick up FITC-dextran particles and bring them into the ganglia. It has been shown that immunolabeled MMs can contain tdTomato expression in ChAT-cre:tdTomato mice, suggesting that macrophages phagocytose enteric neurons during homeo- static maintenance of the ENS.50Our data support this and indicate that IGMs are a distinct phagocytic population of macrophage critical to this process.
Crosstalk between the microbiome, macrophages, and ENS is beginning to be elucidated and has implications in immunomodulation and intestinal disease.18 Studies in experimental colitis demonstrate that enteric neuro- inflammation disrupts neurally regulated processes, such as intestinal motility, and results in neural hyperexcitability, local leukocyte infiltration to the enteric ganglia (plexitis), neuronal death, neurochemical plasticity, and a “reactive” glial cell phenotype.6,51,52However, the mechanisms driving neuroinflammation in the gut are unknown. In our study, DSS-induced colitis resulted in significant inflammation in the muscularis propria indicated by increased expression of iNOS in macrophages and smooth muscle cells and elevated levels of inflammatory cytokines including TNF, IL1A, IL1B, and MCP-1, which is in line with other studies.53,54 ECM
proteins in the muscularis propria were degraded, including agrin and Col4 of the ganglionic basement membrane, which was associated with increased numbers of IGMs. This resulted in the loss of BMB integrity, which could be critical to initiating enteric neuroinflammation via infiltration of PAMPs and proinflammatory leukocytes. Our data indicate that these interactions are unlikely in physiological condi- tions because of BMB impermeability and may only occur after the barrier is compromised. Degradation of the barrier may allow non-resident immune cells to interact with the enteric ganglia and result in neuronal injury. Intraganglionic non-resident leukocytes, described in plexitis or ganglioni- tis, are observed in Crohn’s disease and may precede and contribute to the progression of inflammation.6 This is supported by the observation that plexitis in grossly unin- flamed intestinal segments is a predictor of disease recur- rence after surgery for Crohn’s disease.55Our data indicate that muscularis inflammation is associated with elevated levels of macrophages and neutrophils, albeit neutrophils were present in lower quantities and, unlike macrophages, did not physically interact with the ENS or constitute the leukocytes involved in plexitis.
Considering that MMs were observed to acquire a proinflammatory phenotype and exhibit enhanced penetra- tion of the enteric ganglia during colitis, we hypothesized that BMB disruption was mediated by MMs. Macrophages were depleted using the liposome-encapsulated clodronate (L-clodronate) model, which ablates infiltrating macro- phages in the intestine.56 Co-administration of DSS and L-clodronate had several notable consequences. The severity of colitis was reduced in mice treated with L-clodronate, which is consistent with ablation of proinflammatory M1 polarized macrophages.33 M1 polarization is not specific to the mucosa, because proinflammatory MMs are also observed during colitis,11 albeit our data indicate that despite the induction of the M1 marker iNOS, the expression of the M2-associated markers, ARG-1 and CD163, is main- tained during inflammation in the intestine. Nevertheless, increases in the number of MMs and IGMs and the extent of M1-polarization in colitis were attenuated after L-clodro- nate treatment. This correlated with the preservation of ECM patterning and the amelioration of BMB permeability, thus confirming that MMs and IGMs play a pivotal role in the inflammation-associated ECM degradation and BMB injury that occur during colitis. This further indicates that, like microglia and the BBB,49 MMs can contribute to BMB permeability in pathologic conditions.
Intestinal inflammation is known to induce expression of ECM remodeling MMPs in macrophages.57 These enzymes are responsible for BBB failure in chronic neurodegenera- tive disorders and may explain the effects of MMs on BMB degradation.58Here, we showed that MMP10 is specifically overexpressed in the muscularis after DSS. MMP10 was expressed by MMs and returned to baseline levels in the muscularis with concurrent L-clodronate treatment. Inter- estingly, we identified that enteric neurons also secreted MMP10 in mice with colitis. Likewise, the major source of elevated TNF in the muscularis originated from the enteric ganglia. The expression of MMP10 and TNF in the myenteric Table 1.Fold Change and AdjustedPValues on Volcano Plot
Analysis
Gene LogFC AdjustedPvalue
Mmp15 7,721425488 3.78E-14
Mmp2 7,426049148 4.67E-10
Mmp14 6,880658085 1.27E-10
Mmp10 6,45768995 2.00E-06
Mmp3 6,43643922 1.71E-06
Mmp11 4,994405387 2.99E-11
Mmp9 3,836082737 1.16E-05
Mmp24 3,459050834 2.73E-09
Mmp16 -0,197007951 0.598400541
Timp3 8,072593837 3.60E-11
Timp2 7,395911406 2.05E-10
Timp1 4,645747477 5.23E-06
1887 18881889 18901891 1892 18931894 18951896 18971898 18991900 19011902 1903 19041905 19061907 19081909 19101911 19121913 1914 19151916 19171918 1919 19201921 19221923 1924 19251926 19271928 19291930 19311932 19331934 1935 19361937 19381939 19401941 19421943 19441945
1946 19471948 19491950 1951 19521953 19541955 19561957 19581959 19601961 1962 19631964 19651966 19671968 19691970 19711972 1973 19741975 19761977 1978 19791980 19811982 1983 19841985 19861987 19881989 19901991 19921993 1994 19951996 19971998 19992000 20012002 20032004
ganglia was dependent on the presence of macrophage.
These data indicate that although degradation of the ECM, BMB permeability, and neuroinflammation are macrophage-
dependent processes, secondary responses from the enteric neurons and glia may contribute to barrier degradation and the inflammatory milieu.
web4C=FPO
Figure 12.DSS colitis is associated with macrophage-dependent structural and functional disruption of the BMB.
Electron microscopy of DSS-treated colon (A) reveals partial disruption (A’, arrows) or complete absence (A”, arrows) of periganglionic basement membrane. PGS is dense and closely packed with collagenfibers (A’–A”, double arrows). 60 minutes after administration of FITC-dextran to DSS-treated animals leads to FITC accumulation in the enteric ganglia (B–B’) and MyMs (B’, arrowhead). Clodronate treatment prevents this, leaving FITC-dextran particles accumulating in the PGS sur- rounding the ganglia (C–C’).D,E, andFshow the change in meanfluorescent intensity 10, 45, and 60 minutes after FITC- dextran injections in whole gut (D), muscularis (E), and enteric ganglia (F).
2005 20062007 20082009 2010 20112012 20132014 20152016 20172018 20192020 2021 20222023 20242025 20262027 20282029 20302031 2032 20332034 20352036 2037 20382039 20402041 2042 20432044 20452046 20472048 20492050 20512052 2053 20542055 20562057 20582059 20602061 20622063
2064 20652066 20672068 2069 20702071 20722073 20742075 20762077 20782079 2080 20812082 20832084 20852086 20872088 20892090 2091 20922093 20942095 2096 20972098 20992100 2101 21022103 21042105 21062107 21082109 21102111 2112 21132114 21152116 21172118 21192120 21212122
web4C=FPO
Figure 13.DSS colitis is associated with enteric neuroinflammation, including neural hypertrophy, glial swelling, and submucosal plexus degeneration. Electron microscopy shows swollen glial end-feet arranged perpendicularly (A, yellow shaded area) to the border of enteric ganglion (A, blue dashed line).BandCshow enteric glial morphology in control vs DSS- treated animals. Enteric neurons (D, magenta shaded area) after DSS treatment accumulate lipid droplets (D, arrows; F, as- terisks) and mitochondria (E, asterisks) and exhibit a hyperplastic rough ER (Eand F,arrow). Number of enteric neurons is unchanged after DSS (G), but their total surface area adjusted to total muscularis area increases significantly and is reversed with L-clodronate injection (H). Average neuron number per myenteric ganglion is unchanged after DSS colitis, whereas number of submucosal neurons decreases significantly (J), and this is reversed with L-clodronate treatment (J). Scatter dia- grams show data for morphometry and cell counting, including means and standard deviation; *P<.05, **P<.01, ***P<.001.
2123 21242125 21262127 2128 21292130 21312132 21332134 21352136 21372138 2139 21402141 21422143 21442145 21462147 21482149 2150 21512152 21532154 2155 21562157 21582159 2160 21612162 21632164 21652166 21672168 21692170 2171 21722173 21742175 21762177 21782179 21802181
2182 21832184 21852186 2187 21882189 21902191 21922193 21942195 21962197 2198 21992200 22012202 22032204 22052206 22072208 2209 22102211 22122213 2214 22152216 22172218 2219 22202221 22222223 22242225 22262227 22282229 2230 22312232 22332234 22352236 22372238 22392240