Vol. 9, No. 4, 2019 pp. 43-54 http://doi.org/10.24368/jates.v9i4.118 12 43
http://jates.org
Journal of Applied
Technical and Educational Sciences jATES
ISSN 2560-5429
Analysis of students’ dropout rate at Subotica Tech
Sanja Maravić Čisara, Robert Pinterb
Subotica Tech – College of Applied Sciences, Marka Oreskovica 16, 24000 Subotica, Serbia
asanjam@vts.su.ac.rs, bprobi@vts.su.ac.rs
Abstract
The analysis of the study success at the Subotica Tech - College of Applied Sciences (Serbia) was done with the aim of determining the passing of exams success and the completion of the studies in order to determine the dynamics of the study and to detect the critical points of the teaching process which lead to problems and finding the best way to eliminate them. Indicators, which were used, are the passing of students at the end of the fall semester, as well as the correlation of success from high school achieved by the enrolled students, with success in the entrance exam and success after the first year of studying.
Keywords: dropout rates; higher education; engineering studies,
Introduction 1.
Academic failures among university students have been the subject of interest in higher education community (Namestovski, et al., 2018). The definition of dropping out is complex, as there are different definitions perhaps the most common being its consideration as transferring to a different course and/or university (Heublein, 2014), or alternatively definitively dropping out of university, identified as non-enrolment on the original courses in the two years after the last enrolment (Gury, 2011).
According to Times Higher Education (Times Higher Education, 2018), one in four UK student nurses drops out of degree courses, in USA more than 48 % of first-time, full-time students who started at a four-year college had not earned a degree (Hess, 2018). That is why student retention is an increasing concern for higher education institutions. According to the Higher Education Development Strategy in the Republic of Serbia (MPNTR, 2012), in the section “The Vision for the Development of Academic Studies”, it is defined that the efficiency of studies should be such that more than 15% of students do not leave studies. The current state of academic studies in Serbia is such that the degree of dropout ranged from 43%
A great number of studies managed to prove that the increase of absenteeism will by and large lead to a decrease in grades. A strong correlation between lecture attendance and examination performance by also presented by Purcell in his study (Purcell, 2007). For every 10% increase in student attendance at lectures, there was a 3% enhancement in examination performance (Molnár & Sik, 2018) and (Kővári, 2019).
Review of Literature 2.
Many interested parties' debate and try to find reasons for students’ dropout. Consequently, the ability to predict a student's performance could be useful in many ways to stakeholders of higher education institutions. According to (Sagenmüller, 2017), there are eight reasons why students drop out from higher education:
- financial problems;
- poor secondary school preparation;
- the student is not sure or convinced with the major;
- conflict with work and family commitments;
- increasingly failing courses;
- lack of quality time with teachers and counsellors;
- de-motivating school environment and - lack of student support.
Dropping out of school is a global issue in the world and many studies on dropout have examined factors contributing to the dropout of student. While some factors exhibit constant effects, like high school characteristics, other effects do vary from the first year to the fourth.
Men and women do not generally exhibit the same dropout behaviour. Socio-economic background, and especially the parents' level of education, would appear to be influential only at the beginning of the university period (Gury, 2011).
Students’ prior academic histories are also important when we talk about dropout. Older students who did not enter higher education upon completing secondary education are subsequently more likely to fail or drop out (Tinto, 2010).
Researchers from the University of Granada have created a statistical model that evaluates the likelihood that the student will drop out of studies. The purpose of the research is to solve the problem of giving up because 30-50% of students in Spain dropout at some point of studies.
The model analyses students' databases from 1992 to the present, using the logistic regression
model, which allows calculating the likelihood of dropping out of studies. More than 10,000 students of computer science, about 25,000 students of economics and about 40,000 students from the philosophy and arts have been analysed. The rate of dropout by computer science and economics students is about 40%, while for students of philosophy and arts is more than 60%. The results showed that those who score low on the entrance exam (had a low number of points), as well as those who enrolled at the age of 25 or more, drops out mostly. The impact of the family also proved to be an important factor in leaving the studies because students could not cope with the pressure of their parents. This research shows that out of 23 variables that were studied, performance and average grade are most related to dropout. The lower the grades are, the greater the likelihood that the student will dropout is, while the sex and the geographical background have almost no influence (Rovira, Puertas, & Igual, 2017).
Research 3.
Based on the findings of researchers in Granada (Rovira, Puertas, & Igual, 2017), we conducted a research at the Subotica Tech- College of Applied Sciences (Serbia). The participants were the students who enrolled for the first time in the 2018/19 school year (changes from one study program to another were not taken into account as well as students who redid their first year of study).
Table 1 gives an overview of the number of students who enrolled the Subotica Tech and who have certified the fall and summer semester of the respective school year. On the basis of the data presented in the Table 1, on average, 76% of students certified the fall semester and 61%
the summer semester, so the dropout rate is nearly 40%.
Table 1. Dropout rate
Year
Number of students
% of students who certified the fall
semester
% of dropout
% of students who certified the summer semester
% of dropout
2012/13 223 80 20 64 36
2013/14 218 77 23 61 39
2014/15 165 73 27 57 43
2015/16 161 73 27 54 46
2016/17 162 80 20 68 32
2017/18 180 76 24 61 39
2018/19 161 73 27 62* 38*
* prediction based on the average from the previous school years
From the total number of 161 students who enrolled the Subotica Tech for the first time in 2018/19 school year, 137 (85%) were male students and 24 females (15%).
If we try to describe the typical student who enrolled the college, then his average mark during high school was very good and he had 30.90 points from a high school (max is 40).
3.1. Results
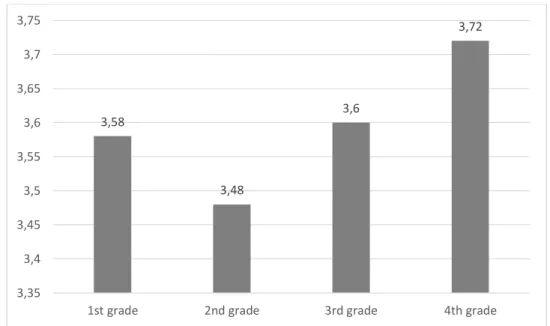
Students who did not certify the first semester: A total of 43 students out of 161 did not certify the fall semester (~ 27%). An average student who did not pass the semester during the high school had the average grade of 3.58 in the first year, in the second year 3.48, in the third year 3.60 and in the fourth year 3.72. We can say that during his secondary education he was on the border of good and very good average grades. For the average grade, he had 28.76 points. The average number of points in the entrance exam was 45.95 points (max 60), which gives a total of 74.71 points (max 100). Among them, the oldest student who enrolled was 44 years old and the average grade during his secondary school education was 2.80.
The average grades for all four years of secondary school are shown in the Fig.1. The weakest success that a student had during his high school education was 2.46.
Fig. 1. The average grade during secondary school for students who did not certify the semester
Students who had 0 ECTS at the end of the first semester: From 118 students who certified the fall semester, a total of 14 did not pass any exams. An average student belonging to this group had a good average grade during his high school education (except in the third year when he had a very good average grade but at the very border of 3.50). The average
3,58
3,48
3,6
3,72
3,35 3,4 3,45 3,5 3,55 3,6 3,65 3,7 3,75
1st grade 2nd grade 3rd grade 4th grade
number of points in the entrance exam is 46.43, and among them there are 3 students who had a maximum score of 60 on the entrance exam. According to the success in high school and the achieved success in the entrance exam, the total number of points is 73.57 (max 100).
The lowest average score was 2.33, and the lowest number of points in the entrance examination 24.
Fig. 2. The average grade during secondary school for students who had 0 ECTS at the end of the first semester
Students who had 5/6 ECTS at the end of the first semester (passed one exam): From 118 students who certified the semester, a total of 13 passed one exam (11%). An average student belonging to this group had a very good average grade during his education in high school, except in the second year when he had a good average grade. The average number of points in the entrance examination is 48. According to the success in high school and the achieved success in the entrance examination, the total number of points is 77.32.
The lowest average score was 2.62, and the lowest number of points in the entrance exam 32.
3,31
3,45
3,5
3,41
3,2 3,25 3,3 3,35 3,4 3,45 3,5 3,55
1st grade 2nd grade 3rd grade 4th grade
Fig. 3. The average grade during secondary school for students who had 5/6 ECTS at the end of the first semester
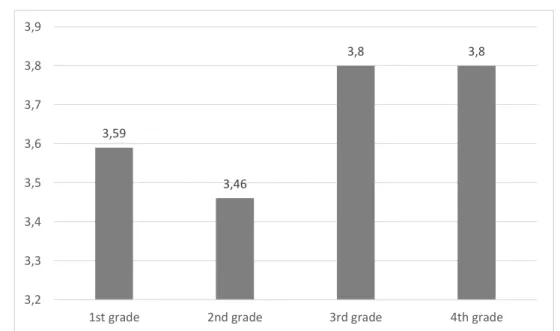
Students who had 10/11/12 ECTS at the end of the semester (passed two exams): From 118 students who certified the semester, a total of 16 passed two exams. An average student belonging to this group had a very good average grade during his education in high school, and the highest average was in the fourth year of high school. According to the success in high school and achieved success in the entrance exam, the total number of points is 77.71.
The lowest average score was 2.7, and the lowest number of points in the entrance exam 36.
Fig. 4. The average grade during secondary school for students who had 10/11/12 ECTS at the end of the first semester
3,59
3,46
3,8 3,8
3,2 3,3 3,4 3,5 3,6 3,7 3,8 3,9
1st grade 2nd grade 3rd grade 4th grade
3,83
3,74
3,85
4,07
3,5 3,6 3,7 3,8 3,9 4 4,1
1st grade 2nd grade 3rd grade 4th grade
Students who had 15/16/17 ECTS at the end of the semester: From 118 students who certified the semester, a total of 11 passed three exams. An average student belonging to this group during his secondary school education was consistently a student with a very good average grade of 3.80 in all four years. According to the success in high school and achieved success in the entrance exam, the total number of points is 81.27.
The lowest average score was 2.71, and the lowest number of points in the entrance exam 36.
Fig. 5. The minimum average grade during secondary school for students who passed three exams at the end of the first semester
Students who passed all exams at the end of the first semester: From 118 students who certified the semester, a total of 33 passed all the exams from the first semester (28%). An average student belonging to this group had a very good average grade during his secondary school education in the first three years. The average grade was increasing from year to year, so in the third year it was almost an excellent (4.49 average) and in the fourth year excellent marks were achieved with an average of 4.64. According to the success in high school and achieved success in the entrance exam, the total number of points is 88.95. Of these, 33 students, 12 had a maximum of 60 points in the entrance exam.
The lowest average score was 3.38, and the lowest number of points in the entrance examination 24.
3,82
3,86
3,88
3,81
3,75 3,77 3,79 3,81 3,83 3,85 3,87 3,89
1st grade 2nd grade 3rd grade 4th grade
Fig. 6. The average grade during secondary school for students who passed all exams at the end of the first semester
Based on the results presented for the fall semester of the academic year 2018/19, it can be concluded that:
• The total student achievement according to the achieved ECTS credits differs according to the student's success during their secondary school. So, if we look at students who did not pass any exam, we see that they had (barely) a good average grade during high school, while students who passed all the exams at the end of the fall semester were with a very good average grade(at the very border to the excellent average grade) in high school.
• First year students who passed all exams in the fall semester had 17% more points in the entrance exam.
• Among the students who sat for all exams in the fall semester, 36% had the maximum number of points in the entrance exam. Among students who did not pass any exams, 21%
had maximum impact in the entrance exam.
On the basis of the data previously published, we can conclude that there is a correlation between the successes in high school education and the efficiency in mastering the tasks enquired by the higher education system.
As an improvement measure, we can propose to explore, in cooperation with the Student Parliament, the reasons why students give up further studies. In addition to the basic assumptions from which we went into our research stating that the success of the studies is
4,27
4,37
4,49
4,64
4 4,1 4,2 4,3 4,4 4,5 4,6 4,7
1st grade 2nd grade 3rd grade 4th grade
related to the success achieved during secondary school, the research should be extended to collect information on motivation and expectations from higher education, past experience in higher education, attendance at classes, passed exams , average grade, etc. Also, we should find out what student perceptions are about the extent to which the expectations from the studies have been fulfilled and the opinions on the content and organization of the studies. As the first step in further research, a pilot project for monitoring student attendance has been introduced to identify students who do not attend regular classes and who are at risk of giving up further studies (Pinter, Pot, Maravić Čisar, & Čović, 2019).
Conclusion
For many students, the transition to university is a challenging experience that involves significant life changes and adaptation to multiple demands whose effects and significance must be interpreted in the sociocultural context in which they are produced. The objective of the present study was to analyse the association between pre-university achievement and adjustment to university. From a practical point of view, recognition of the influence of certain variables on the successful transition to university is not by itself sufficient, and empirical evidence must be presented. This will lead to the development of institutional support systems for those students in critical groups, thus promoting successful transition and lowering the dropout rates. The early dropout prediction indicates those students who are in most need of help. Tutors can focus on them and thus, increase their motivation and performance (Gogh, 2018) and teachers could apply innovative teaching methods (Molnar, 2011) and learning mobile (Molnár, 2012) support systems (Molnar, 2013) to increase student success. The motivation for this study was to understand the dropout problem and to learn how to combat and conquer the problem. The results show, similar to the research done in Granada (Rovira, Puertas, & Igual, 2017) that success during high school education has an impact on the success of studying (Ujbanyi et al, 2017). In the further work we plan to expand the research so that in addition to the grades from the high school and the success at the entrance examination, we will monitor the student's success during further education (until graduation).
References
Molnár, G. (2012). New learning spaces? M-learning's, in particular the IPad’s potentials in education, International Journal of Interactive Mobile Technologies Vol. 7. No.1. pp.
Gury, N. (2011). Dropping out of Higher Education in France: A Micro-Economic Approach Using Survival Analysis. Education Economics, 19, 51-64.
Gogh et al. (2018). Metacognition and Lifelong Learning. 9th IEEE International Conference on Cognitive Infocommunications, pp. 271–276. doi: 10.1109/CogInfoCom.2018.8639961 Hess, F. (2018, June 6). The College Dropout Problem. Retrieved June 17, 2019, from Forbes:
https://www.forbes.com/sites/frederickhess/2018/06/06/the-college-dropout- problem/#6c89153c5fd2
Heublein, U. (2014). Student Drop‐ out from German Higher Education Institutions. European Journal of Education, 49(4), 497-513. doi: https://doi.org/10.1111/ejed.12097
How to improve students retention in higher education in the USA. (n.d.). (u-planner) Retrieved May 29, 2019, from https://cdn2.hubspot.net/hubfs/1533000/ebook/retention_ebook/Ebook_- _Strategies_and_Best_Practices_to_Improve_Student_Retention.pdf
Kovari, A. (2019). A felnőttoktatás 4.0 és az az ipar 4.0 kihívásai az életen át tartó tanulásban.
PEDACTA, 9(1), 9–16. http://doi.org/10.24193/PedActa.9.1.2
Molnár, G., & Sik, D. (2018). Supporting Learning Process Effectiveness with Online Web 2.0 Systems on the basis of BME Teacher Training. 2018 IEEE 9th International Conference on Cognitive Infocommunications (CogInfoCom), (pp. 337-340). Budapest. doi:DOI:
10.1109/CogInfoCom.2018.8639903
Molnár, G. (2011). Új módszerek a pedagógiai gyakorlatban - az IKT alapú megoldások tükrében. SZAKKÉPZÉSI SZEMLE, XXVII(3), 170–177.
Molnár, G. (2013). The role of electronic and virtual learning support systems in the learning process.
In IEEE 8th International Symposium on Applied Computational Intelligence and Informatics (pp. 51–54). http://doi.org/10.1109/SACI.2013.6609024
Molnár, G. (2013). Formális és informális hálózatalapú tanulási környezetek, s a bennük rejlő tanulási potenciálok szerepe. In V. Oktatás-Informatikai Konferencia, pp. 196–201.
MPNTR. (2012). Strategija razvoja obrazovanja u Srbiji do 2020. godine. Službeni glasnik RS, 107/2012. Retrieved May 29, 2019, from http://www.mpn.gov.rs/wp-
content/uploads/2015/08/STRATEGIJA-OBRAZOVANJA.pdf
Namestovski, Ž., Major, L., Molnár, G., Szűts, Z., Esztelecki, P., & Kőrösi, G. (2018). External Motivation, the Key to Success in the MOOCs Framework. Acta Polytechnica Hungarica, 15(6), 125-142. Retrieved June 17, 2019, from https://uni-
obuda.hu/journal/Namestovski_Major_Molnar_Szuts_Esztelecki_Korosi_85.pdf
Pinter, R., Pot, M., Maravić Čisar, S., & Čović, Z. (2019). Automatski sistem za evidenciju prisustva nastavi korišćenjem Arduino platforme i Android aplikacije. YU INFO. Kopaonik.
Purcell, P. (2007). Engineering Student Attendance at Lectures: Effect on Examination Performance.
International Conference on Engineering Education – ICEE. Retrieved June 17, 2019, from http://citeseerx.ist.psu.edu/viewdoc/download?doi=10.1.1.506.7890&rep=rep1&type=pdf Rovira, S., Puertas, E., & Igual, L. (2017). Data-driven system to predict academic grades and
dropout. PLoS ONE, 12(2). doi: https://doi.org/10.1371/journal.pone.0171207
Sagenmüller, I. (2017, March 31). Student retention: 8 reasons people drop out of higher education.
Retrieved May 29, 2019, from u-planner: https://www.u-planner.com/en-us/blog/student- retention-8-reasons-people-drop-out-of-higher-education
Sziladi G. et al. (2017). The analysis of hand gesture based cursor position control during solve an IT related task. 8th IEEE International Conference on Cognitive Infocommunications, pp. 413–
418. doi: 10.1109/CogInfoCom.2017.8268281
Times Higher Education. (2018, September 3). Retrieved June 17, 2019, from
https://www.timeshighereducation.com/news/one-four-uk-student-nurses-drops-out-degree- course
Tinto, V. (2010). From theory to action: Exploring the institutional conditions for student retention.
Higher Education: Handbook of Theory and Research, 25, 51-89. Retrieved May 29, 2019 Ujbanyi T. et al. (2017). ICT Based Interactive and Smart Technologies in Education - Teaching
Difficulties. International Journal of Management and Applied Science, 3.(10.), 72–77.
Short professional biography
Sanja Maravić Čisar works at Subotica Tech – College of Applied Sciences as a lecturer at Computer Science Department for more than 20 years. She has taught a number of courses over the years, some of them are C, C++ and Java. The focus of her current research has been mainly on using computer adaptive tests in education, implementation of Scrum in project driven higher education and gamification as a way to engage students. She is author and co- author of more than 95 publications. She is a member of the IEEE.
Robert Pinter is a professor at Subotica Tech - College of Applied Sciences. He obtained his MsC degree at the Electrical Engineering Faculty at the Budapest University of Technology. He defended his PhD thesis at the Technical Faculty “Mihajlo Pupin” in Zrenjanin, Serbia, in 2012. He teaches various computer science courses in the field of programming languages and mobile application development. The main research area in his scientific works is improving the efficiency of e-learning with the application of novel technologies and new teaching methodology.